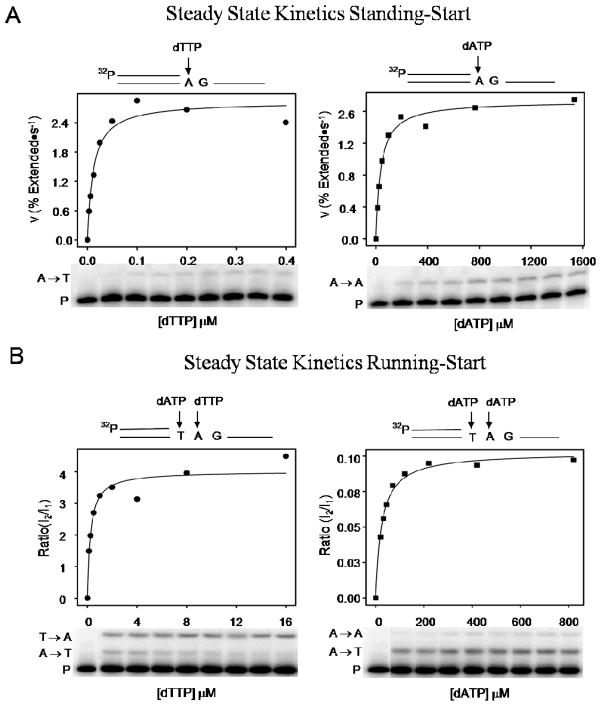
Figure 3.
Steady state kinetics measurements for standing-start compared with running-start. Standing-start (A) and running-start (B) velocities for extension of primer (P) by incorporation of a right T (T →A, left panel) or wrong A (A→A, right panel) are shown plotted as a function of corresponding dNTP concentration. The ratio I2/I1 is the velocity of extended primer where I2 is the band intensity at site 2 (T→A or A→A) and I1 is the band intensity at site 1 (A→T). A rectangular hyperbola fit to the data is used to determine Vmax/Km for right and wrong incorporations (see RESULTS). The standing-and running-start misinsertion frequencies, fins = (Vmax/Km)W/(Vmax/Km)R are shown in Table 1, and Table 1 footnote, respectively. The running-start dATP is kept at a constant concentration (10 μM) when measuring right incorporation of T opposite template A (T→A, left panel). When measuring wrong incorporation of A opposite template A (A→A, right panel), the running-start dATP concentration is varied from 10 to 600 μM. The concentrations of primer-template and KF− are 10 nM and 0.25 nM, respectively.

