

Abstract
• Background and Aims Plant genome size is an important biological characteristic, with relationships to systematics, ecology and distribution. Currently, there is no information regarding nuclear DNA content for any Carthamus species. In addition to improving the knowledge base, this research focuses on interspecific variation and its implications for the infrageneric classification of this genus. Genome size variation in the process of allopolyploid formation is also addressed.
• Methods Nuclear DNA samples from 34 populations of 16 species of the genus Carthamus were assessed by flow cytometry using propidium iodide.
• Key Results The 2C values ranged from 2·26 pg for C. leucocaulos to 7·46 pg for C. turkestanicus, and monoploid genome size (1Cx-value) ranged from 1·13 pg in C. leucocaulos to 1·53 pg in C. alexandrinus. Mean genome sizes differed significantly, based on sectional classification. Both allopolyploid species (C. creticus and C. turkestanicus) exhibited nuclear DNA contents in accordance with the sum of the putative parental C-values (in one case with a slight reduction, frequent in polyploids), supporting their hybrid origin.
• Conclusions Genome size represents a useful tool in elucidating systematic relationships between closely related species. A considerable reduction in monoploid genome size, possibly due to the hybrid formation, is also reported within these taxa.
Keywords: Allopolyploidization, Carthamus, Compositae, C-value, DNA content, flow cytometry, genome size, interspecific hybrids, systematics
INTRODUCTION
As currently circumscribed (Vilatersana et al., 2005), Carthamus L. includes 18 species in two sections, Carthamus and Atractylis Rchb. Its distribution is centred in the east of the Mediterranean basin. Some species (C. creticus L., C. lanatus L. and C. leucocaulos Sibth. & Sm.) have colonized other Mediterranean regions, including Argentina, Australia, California and South Africa, where they can be invasive (Knowles and Ashri, 1958; Ashri and Knowles, 1960; Hanelt, 1963; Estilai and Knowles, 1978). Carthamus tinctorius L. (safflower) is widely cultivated for a variety of uses including oil extraction (Hanelt, 1963) and as a saffron substitute.
Section Atractylis includes a group of allopolyploid species. Much early work, based on morphology, karyology, experimental hybridizations and isozyme studies (Ashri and Knowles, 1960; Harvey and Knowles, 1965; Khidir and Knowles, 1970a, b; Efron et al., 1973), indicated that C. creticus originated from C. lanatus and C. leucocaulos, and C. turkestanicus Popov originated from C. lanatus and C. glaucus M. Bieb subsp. glaucus. Some researchers regarded C. lanatus as an interspecific hybrid between one x = 10 ancestor and another x = 12 ancestor (Ashri and Knowles, 1960). However, it is also possible that C. lanatus is an autopolyploid (R. Vilatersana, unpubl. res.) originating from an x = 11 ancestor, such as C. divaricatus Beg. and Vaccari (Estilai and Knowles, 1976). The latter is a Libyan species that has not been studied in the present work. It appears to be highly variable. The present study addresses nearly all Carthamus species, encompassing its distribution throughout the Mediterranean basin.
Three basic chromosome numbers occur in Carthamus (x = 10, 11 and 12), excluding the allotetraploids which behave as diploids (there are no multivalents at meiosis; Khidir and Knowles 1970a, b) with 2n = 64.
Nuclear DNA content plays an important role in systematics (Kellogg, 1998; Leitch et al., 1998), and although originally it was primarily linked to the ecological and physiological conditions of an organism, it has recently received increased focus within this field. Since 1950, when the term C-value was coined by Swift (for the amount of DNA in the unreplicated haploid or gametic nucleus of an individual), considerable scientific effort has been made, not only to increase information related to plant C-values (Bennett and Leitch, 2004) but also to understand both the tremendous differences in DNA amounts among various organisms, known as the C-value enigma (Gregory, 2001, 2005), and the molecular mechanisms leading to increases or decreases in genome size (Petrov et al., 2000; Bennetzen et al., 2005).
Numerous studies on nuclear DNA content in allopolyploids have been conducted (Gerstel and Burns, 1966; Buitendijk et al., 1997; Comai, 2000; Bennetzen, 2002; Liu and Wendel, 2002; Ozkan et al., 2003; Siško et al., 2003; Bureš et al., 2004), and it now seems apparent that in allopolyploids nuclear DNA content either corresponds to approximately the sum of the parental genome sizes or is non-additive, with a smaller amount of nuclear DNA for the hybrid than expected. On the other hand, changes in genome size within a narrow group of species are believed to be a true indicator of the ongoing processes of speciation or genetic divergence (Price, 1976; Murray, 2005).
The main goals of this study were: (a) to assess the degree of variation (particularly interspecific variation) in nuclear DNA content; (b) to investigate the connection (if any) between nuclear DNA content and the infrageneric classification of Carthamus; (c) to document the changes in genome size resulting from allopolyploidization; and (d) to contribute data on the C-values for this genus, since there are no previous studies on these species.
MATERIALS AND METHODS
Plant material
Table 1 shows the provenance of all material investigated. Petunia hybrida Vilm. ‘PxPc6’ (2C = 2·85 pg) and Pisum sativum L. ‘Express Long’ (2C = 8·37 pg) were used as internal standards for flow cytometric measurements (Marie and Brown, 1993). The seeds were provided by the Institut des Sciences du Végétal, Gif-sur-Yvette, France. Voucher specimens are preserved in the herbarium BC.
Table 1.
Origin of the material studied (vouchers are in the herbarium BC)
| Species | Origin of materials |
|---|---|
| Section Atractylis | |
| Carthamus alexandrinus (Boiss. & Heldr.) Asch. | EGYPT, Alexandria: between El Amiriya and Bourg-el-Arab, Susanna 1835 and Vilatersana, 7 June 1998. |
| EGYPT, Alexandria: 10 km from Bourg-el-Arab, Susanna 1843 and Vilatersana, 7 June 1998. | |
| EGYPT, Alexandria: 106 km East of Marsa Matruh, Susanna 1858 and Vilatersana, 8 June 1998. | |
| Carthamus anatolicus (Boiss.) G. Samuelsson in Rech. f. | ISRAEL, Messilot: near Shehulot. Institut für Pflanzengenetik und Kulturpflanzenforschung, Gatersleben. Cart 43/76. |
| ISRAEL, Kefar Shammai. Institut für Pflanzengenetik und Kulturpflanzenforschung, Gatersleben. Cart 53/76. | |
| Carthamus boissieri Halácsy | GREECE, Crete: Rethymnon, road between Asomatos and Moni Preveli, Vilatersana 30, 7 July 1996. |
| GREECE, Crete: Hania, Drapanon Peninsula, Vilatersana 36, 9 July 1996. | |
| GREECE. Institut für Pflanzengenetik und Kulturpflanzenforschung, Gatersleben. Cart 85/99. | |
| Carthamus creticus L. | MOROCCO, Al Hoceima: 38 km S of Al Hoceima on the road to Nador, Garnatje, Susanna 1772 and Vilatersana, 15 June 1997. |
| EGYPT, Alexandria: near El Amiriya, Susanna 1851 and Vilatersana, 7 June 1998. | |
| Carthamus dentatus Vahl ssp. ruber (Link) Hanelt | GREECE, Crete: Rethymnon, road N-97 between Rotosi and Mesohorio, Vilatersana 44, 14 July 1996. |
| Carthamus glaucus M. Bieb. ssp. glaucus | TURKEY, Ahar Dağ: Tekeyatağ, 1500 m. Ertuğrul, Garcia-Jacas, Susanna 2338 and Uysal, 4 August 2002. |
| Carthamus lanatus L. | GREECE, Crete: Rethymnon, between road N-77 and necropolis Minois, Vilatersana 27, 7 July 1996. |
| SPAIN, Soria: between Morcuera and Montejo de Tiermes. Garcia-Jacas and Susanna 2444B, 15 August 2003. | |
| ITALY, Calabria: road SS-106, km 256, near Neto river, Carretero, Pignone, Sonante and Vilatersana 207, 22 July 2003. | |
| SPAIN, Balearic Islands: Formentera, Garnatje and Vilatersana 413, 18 April 2005. | |
| Carthamus lanatus L. ssp. montanus (Pomel) Gahand et Maire. | TUNISIA, Gulf of Tunis: Cedria Plage, Institut für Pflanzengenetik und Kulturpflanzenforschung, Gatersleben. Cart 84/95. |
| Carthamus leucocaulos Sibth. & Sm. | GREECE, Crete: Hania, base of Mount Hrissokalitissas, Vilatersana 40, 11 July 1996. |
| Carthamus nitidus Boiss. | ISRAEL: Negev Desert, Dead Sea, Levy, September 1997. |
| Carthamus tenuis (Boiss. & Blanche) Bornm. | ISRAEL: Jordan Valley, Levy, September 1997. |
| Carthamus turkestanicus Popov | ARMENIA, Ararat: near Surenavan along a water conduction 1 km from the road, Fajvush, Gabrielyan, Garcia-Jacas, Guara, Hovannisyan, Susanna 1532, Tamanyan and Vallès, 19 August 1995. |
| ARMENIA, Ekhegnazdor: near Agarakadzor, Fajvush, Gabrielyan, Garcia-Jacas, Guara, Hovannisyan, Susanna 1551N, Tamanyan and Vallès, 20 August 1995. | |
| IRAN, Azarbayjan-e-Shargui: 35 km from Tabriz on the road to Ahar, Garcia-Jacas, Mozaffarian, Susanna 1656 and Vallès, 5 August 1996. | |
| UZBEKISTAN, Tashkent: between Jizak and Tashkent, Kapustina, Khassanov, Susanna 2064B and Vallès, 8 October 1999. | |
| Section Carthamus | |
| Carthamus gypsicola Iljin | ARMENIA, Ararat: Vedi, Fajvush, Gabrielyan, Garcia-Jacas, Guara, Hovannisyan, Susanna 1579, Tamanyan and Vallès, 25 August 1995. |
| Carthamus oxyacantha M. Bieb. | IRAN, Tehran: Sorkhehesar near Tehran, Garcia-Jacas, Mozaffarian, Susanna 1626 and Vallès, 2 August 1996. |
| IRAN, Azarbayjan-e-Gharbi: 30 km from Khoy on the road to Orumiyeh, Garcia-Jacas, Mozaffarian, Susanna 1689 and Vallès, 2 August 1996. | |
| Carthamus palaestinus Eig | ISRAEL. USDA, Western Regional Plant Introduction Station. Pullman, Washington PI 235663. |
| Carthamus persicus Desf. ex Willd. | LEBANON. USDA, Western Regional Plant Introduction Station. Pullman, Washington PI 243151. |
| TURKEY, Elaziğ: road from Elaziğ to Bingöl. Ertuğrul, Garcia-Jacas, Susanna 2358 and Uysal, 6 August 2002. | |
| Carthamus tinctorius L. | KAZAKHSTAN, Irsu: 1 km from Rayerka, near of Aksu Canyon, Ivaschenko, Susanna 2190 and Vallès, 30 August 2000. |
| SLOVENIA, Ljubljana: Botanical Garden. | |
| SPAIN, Huescá, Castroviejo, 20 September 1984. | |
| UZBEKISTAN, Samarkand: between Samarkand and Bukhara, Khassanov, November 1999. | |
DNA content assessment
Fresh young leaves from the plants studied were co-chopped with an internal standard in 600 µL of Galbraith's buffer (Galbraith et al., 1983) supplemented with 100 µg ml−1 RNase A (Boehringer, Meylan, France) using a razor blade in a plastic Petri dish. To ensure peak identification, the amount of the target species leaf (∼3 cm2) was approximately twice that of the standard. Additionally, a sample containing only the standard was first prepared and analysed to determine its peak position. Nuclei were filtered through a 30 µm nylon filter in order to eliminate cell debris before adding 60 µg mL−1 of propidium iodide (Sigma-Aldrich, Alcobendas, Madrid, Spain). Samples were kept on ice for 20 min before measurement. Five individuals per species were analysed (except C. dentatus, marked in the table with an asterisk). Two samples from each individual were extracted and measured independently. Fluorescence analysis was carried out using an Epics XL flow cytometer (Coulter Corporation, Hialeah, FL, USA). The instrument was set up in the standard configuration: excitation of the sample was conducted using a standard 488 nm air-cooled argon-ion laser at 15 mW power. Forward scatter (FSC), side scatter (SSC) and red (620 nm) fluorescence for propidium iodide were then acquired. Optical alignment was based on the optimized signal from 10 nm fluorescent beads (Immunocheck, Epics Division). Time was used as a control for the stability of the instrument. Red fluorescence was projected on a 1024 monoparametrical histogram. Aggregates were excluded, with single cells gated by area vs. peak fluorescence signal. The total nuclear DNA content was calculated by multiplying the known DNA content of the standard by the quotient between the 2C peak positions of the target species and the standard in the histogram of fluorescence intensities, under the assumption that there is a linear correlation between the fluorescent signals from stained nuclei of the unknown specimen, the known internal standard and DNA content.
Statistical analyses
The means and s.d. were calculated from the means of individual plants.
Analysis of variance (ANOVA) was carried out to evaluate whether the differences among sections were significant or not. In those cases in which ANOVA revealed significant differences, a least significant difference (l.s.d.) test was performed. Statgraphics Plus 5.0 (Statistical Graphics Corp.) was used for the statistical analysis.
ANOVA was performed using 2C values and monoploid genome size (1Cx, according to the recently proposed terms for genome size in Greilhuber et al., 2005) as dependent variables.
RESULTS
Data on nuclear DNA content and other karyological features are presented in Table 2. The 2C values ranged from 2·26 pg for C. leucocaulos to 7·46 pg for C. turkestanicus, and monoploid genome size (1Cx-value) ranged from 1·13 pg in C. leucocaulos to 1·53 pg in C. alexandrinus. The analyses were of good quality [mean half peak coefficient of variation (HPCV) = 4·54 %]. According to both the literature and the Plant DNA C-values Database (http://www.rbgkew.org.uk/cval/homepage.html; release 3.0, Bennett and Leitch, 2004), this is the first study on genome size in the genus Carthamus.
Table 2.
Nuclear DNA content and the other karyological features of the populations studied
| Taxa | 2C ± s.d. (pg)+ | 2C (Mbp)† | 2n‡ | Ploidy level | 1Cx§ | Standard¶ |
|---|---|---|---|---|---|---|
| Section Atractylis | ||||||
| C. alexandrinus, S-1835 | 3·02 ± 0·20 | 2953·56 | 20 | 2× | 1·51 | Pisum |
| C. alexandrinus, S-1843 | 2·99 ± 0·04 | 2924·22 | 20 | 2× | 1·50 | Pisum |
| C. alexandrinus, S-1858 | 3·06 ± 0·11 | 2992·68 | 20 | 2× | 1·53 | Pisum |
| C. anatolicus, 53/76 | 2·96 ± 0·03 | 2894·88 | 20 | 2× | 1·48 | Pisum |
| C. anatolicus, 43/76 | 2·99 ± 0·06 | 2924·22 | 20 | 2× | 1·50 | Pisum |
| C. boissieri, V-30 | 2·89 ± 0·03 | 2826·42 | 20 | 2× | 1·45 | Pisum |
| C. boissieri, V-36 | 2·94 ± 0·01 | 2875·32 | 20 | 2× | 1·47 | Pisum |
| C. boissieri, Greece | 2·95 ± 0·18 | 2885·10 | 20 | 2× | 1·48 | Pisum |
| C. creticus, S-1772 | 7·06 ± 0·11 | 6904·68 | 64 | 6× | 1·18 | Petunia |
| C. creticus, S-1851 | 6·89 ± 0·07 | 6738·42 | 64 | 6× | 1·15 | Petunia |
| C. dentatus ssp. ruber | 2·70* | 2640·60 | 20 | 2× | 1·35 | Pisum |
| C. glaucus ssp. glaucus | 3·00 ± 0·08 | 2934·00 | 20 | 2× | 1·50 | Pisum |
| C. lanatus, V-27 | 4·75 ± 0·05 | 4645·50 | 44 | 4× | 1·19 | Petunia |
| C. lanatus, V-207 | 4·76 ± 0·08 | 4655·28 | 44 | 4× | 1·19 | Pisum |
| C. lanatus, S-2444B | 4·80 ± 0·07 | 4694·40 | 44 | 4× | 1·20 | Pisum |
| C. lanatus, V-413 | 4·62 ± 0·02 | 4518·36 | 44 | 4× | 1·16 | Pisum |
| C. lanatus ssp. montanus | 4·83 ± 0·06 | 4723·74 | 44 | 4× | 1·21 | Pisum |
| C. leucocaulos | 2·26 ± 0·02 | 2210·28 | 20 | 2× | 1·13 | Pisum |
| C. nitidus | 2·44 ± 0·04 | 2386·32 | 24 | 2× | 1·22 | Pisum |
| C. tenuis | 2·74 ± 0·07 | 2679·72 | 20 | 2× | 1·37 | Pisum |
| C. turkestanicus, S-1532 | 7·32 ± 0·11 | 7158·96 | 64 | 6× | 1·22 | Petunia |
| C. turkestanicus, S-1551N | 7·46 ± 0·17 | 7295·88 | 64 | 6× | 1·24 | Pisum |
| C. turkestanicus, S-1656 | 7·29 ± 0·05 | 7129·62 | 64 | 6× | 1·22 | Petunia |
| C. turkestanicus, S-2064B | 7·31 ± 0·11 | 7149·18 | 64 | 6× | 1·22 | Petunia |
| Section Carthamus | ||||||
| C. gypsicola | 2·71 ± 0·06 | 2650·38 | 24 | 2× | 1·36 | Pisum |
| C. oxyacantha, S-1626 | 2·58 ± 0·02 | 2523·24 | 24 | 2× | 1·29 | Pisum |
| C. oxyacantha, S-1689 | 2·62 ± 0·06 | 2562·36 | 24 | 2× | 1·31 | Pisum |
| C. palaestinus | 2·82 ± 0·06 | 2757·96 | 24 | 2× | 1·41 | Pisum |
| C. persicus, Lebanon | 2·65 ± 0·08 | 2591·70 | 24 | 2× | 1·33 | Pisum |
| C. persicus, S-2358 | 2·65 ± 0·06 | 2591·70 | 24 | 2× | 1·33 | Pisum |
| C. tinctorius, S-2190 | 2·77 ± 0·04 | 2709·06 | 24 | 2× | 1·39 | Pisum |
| C. tinctorius, Uzbekistan | 2·76 ± 0·07 | 2699·28 | 24 | 2× | 1·38 | Pisum |
| C. tinctorius, Huesca | 2·79 ± 0·05 | 2728·62 | 24 | 2× | 1·40 | Pisum |
| C. tinctorius, Ljubljana | 2·68 ± 0·04 | 2621·04 | 24 | 2× | 1·34 | Pisum |
2C nuclear DNA content (mean value ± s.d. of 10 samples).
1 pg = 978 Mbp (Dolezel et al., 2003).
Somatic chromosome number.
Monoploid genome size (2C value divided by ploidy level)
Internal standard used in each case (see text for details regarding Pisum and Petunia).
Only one individual was measured.
DISCUSSION
Systematic implications for infrageneric classification
The mean 2C values were significantly different between the two sections, Carthamus (2·70 pg) and Atractylis (4·33 pg), considered by Vilatersana et al. (2005) (P = 0·0103). When the allopolyploids were omitted from the analysis, the means were no longer significantly different (P = 0·1009), indicating that the differences in genome size are attributable to the different ploidy levels (2x, 4x and 6x; see Table 2). To avoid the bias due to inclusion of data from species with different ploidy levels, the analyses were carried out using the 1Cx-value (monoploid genome size) as a variable. Mean 1Cx values in the two sections (1·32 pg for Atractylis and 1·35 pg for Carthamus) were not significantly different (P = 0·4711). This apparently results from the low monoploid genome size of the allopolyploid taxa, lowering the mean of the section. However, when the allopolyploids were excluded from the analysis, the means still remain not significantly different (P = 0·1076).
Our results lead to the conclusion that differences in genome size within this species group go further than those due to formation of allopolyploids. These results also suggest that, in addition to polyploidy, other differential features are present in their genomes.
The dendrogram shown in Fig. 1 illustrates the differentiation among three clusters. Clusters A and C include the species of section Atractylis. One (C) includes all the allopolyploid species. Sectional classification should not be constructed on the basis of hybrid characteristics, i.e. on the assumption that allopolyploids form a separate clade only because they are polyploid and of hybrid origin, and not for possessing characteristics sufficiently different from the remaining species to constitute an entirely independent section. However, this group also includes C. leucocaulos and C. nitidus, both from section Atractylis, but not allopolyploid. The former is a species with an insular distribution (Greek islands), a fact possibly related to a reduction in genome size as compared with the species of cluster A, where they should be included. This reduction may result from colonization pressures (Suda et al., 2003; T. Garnatje et al., unpubl. res.), possibly supporting the hypothesis that small C-values were an evolutionary advantage under the pressures of insular selection. According to Estilai and Knowles (1978), C. leucocaulos has a morphological appearance rather different from that of most of the remaining species in this genus although it is quite similar to C. nitidus. The second, C. nitidus, has been regarded as a ‘link species’ between sections Atractylis and Carthamus (Vilatersana et al., 2000).
Fig. 1.
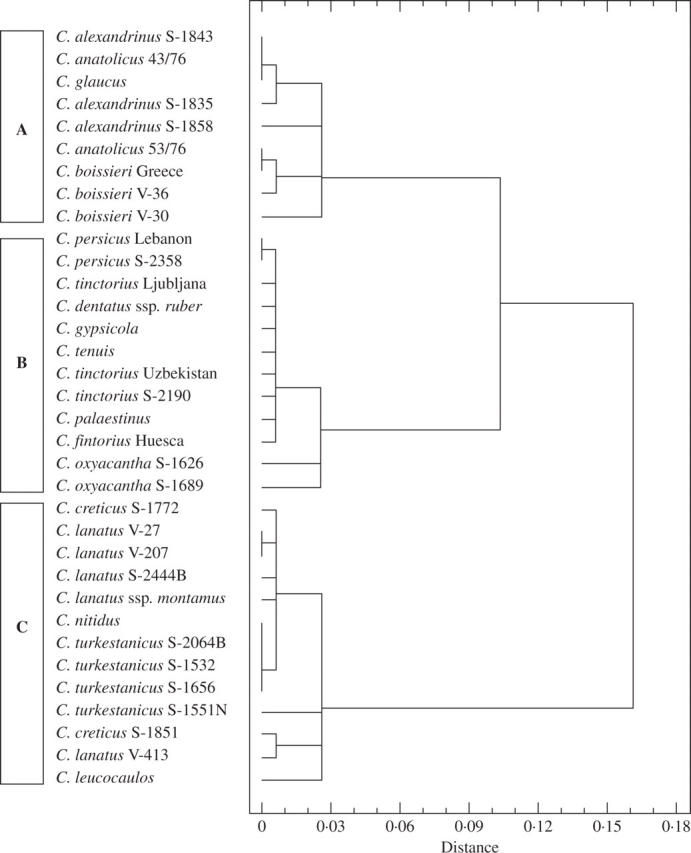
Nearest-neighbour method dendrogram based on Cx values, showing the squared Euclidean distance of the Carthamus taxa analysed.
Thus, cluster C includes the species of section Atractylis with a lower amount of monoploid DNA. This finding could reflect the process of allopolyploid hybrid formation in section Atractylis and the decrease in monoploid genome size that this phenomenon leads to, as Ozkan et al. (2003) noted in Aegilops-Triticum, whereby the DNA loss detected during allopolyploidization may represent a pre-programmed adaptive response, as a mechanism which could stabilize polyploid genomes, to the genomic stress resulting from hybridization and allopolyploidy. The other cluster (B) corresponds to the section Carthamus, with the addition of C. dentatus subsp. ruber and C. tenuis of section Atractylis.
In the case of C. lanatus, the populations studied show that insularity could also explain the reduction in genome size. Continental species have more DNA than those from islands and, within these latter, the population from Formentera, the smallest island and consequently the island subject to higher selection constraints, has a significantly (P = 0·0019) lower nuclear DNA amount than the population from Crete (4·62 vs. 4·75, a difference of 2·81 %).
Cytogenetic implications
The ANOVA results demonstrate that in both cases the means of total nuclear DNA content (2C values) differ significantly in relation to chromosome number and ploidy level (P ≤ 0·0001). When the ANOVA is performed using the monoploid genome size (1Cx), significant differences result when the independent variable is either ploidy level (P ≤ 0·0005) or chromosome number (P ≤ 0·0001), as expected.
The multiple range test (l.s.d.) shows that all of the means are significantly different between the four chromosome numbers, except between 2n = 44 and 2n = 64. Monoploid genome size decreases with increasing chromosome number. Mean 1Cx values are significantly different between diploids and tetraploids, as well as between diploids and hexaploids, but are not significant between the two groups of polyploids.
Species of hybrid origin
A number of researchers (Khidir and Knowles, 1970a; Estilai and Knowles, 1978; Vilatersana et al., 2005) support the hypothesis that C. creticus (2n = 64) is an allopolyploid derived from C. lanatus (2n = 44) and C. leucocaulos (2n = 20). The sum of the 2C values for C. lanatus (4·73 pg) and C. leucocaulos (2·26 pg) is 6·99 pg, almost the same as the 2C value for C. creticus (6·98 pg). When analysing the origins of C. turkestanicus (2n = 64), an allopolyploid derived from C. lanatus (2n = 44) and C. glaucus subsp. glaucus (2n = 20), the sum of the 2C values of the parental species was 7·73 pg, whereas the mean of the four C. turkestanicus populations was 7·35 pg (7·29, 7·31, 7·32 and 7·46). These putative hybrids, C. creticus and C. turkestanicus, are regarded as stabilized and, although of polyploid origin, they currently behave as diploids. In both cases, nuclear DNA amounts in the hybrid species fell slightly below the sum of the genome sizes of the parental species. The genome size of C. creticus nearly coincides with the sum of those of C. lanatus and C. leucocaulos, a finding consistent with the hypothesis that these species were its progenitors. This would not, however, exclude other possible parents. In the case of C. turkestanicus, its lower than expected nuclear DNA content could be explained in terms of non-additive changes in genome size, as discussed by Ozkan et al. (2003).
These results are consistent with studies on genome size in hybrids; natural hybrids with a lower nuclear DNA amount than the sum of those of the parents have been recorded in the genus Cirsium (Bureš et al., 2004). A similar situation has been found in artificial hybrids produced by embryo rescue in the genus Cucurbita (Šiško et al., 2003).
Carthamus spp. generally had low nuclear DNA amounts compared with the plant DNA C-values recorded to date (Plant DNA C-values Database, Bennett and Leitch, 2004). The success of weeds has been linked to small genome size, which, among other advantages, helps them to establish quickly and develop rapidly throughout their life cycle (Bennett et al., 1998). Supporting this hypothesis, all these species are annuals and weeds. Despite their higher nuclear DNA contents, some of the allopolyploids, notably C. creticus and C. lanatus, also display an invasive nature, colonizing areas of Australia and the USA (Peirce, 1992).
Concluding remarks
Analyses of genome size in this genus do not provide additional evidence for recognition of two (Atractylis and Carthamus) sections, although they show that the species of section Carthamus form a distinct cluster. Allopolyploid taxa, however, are clearly differentiated from the remaining species due to their decreased monoploid genome size, probably a consequence of allopolyploidization. We have also verified that 1Cx values in the genus decrease with increasing ploidy levels, and that the allopolyploids exhibit a total nuclear DNA content more or less equal to, or a little less than, the sum of those of the parental species. Finally, the most invasive Carthamus spp. exhibit an increased genome size but a decreased chromosome number, with respect to the other taxa of the genus. From the perspective of genome size study, it would be of great interest to see whether the patterns of DNA content variation in allopolyploids, weeds and island colonizers demonstrated in this study are also evident in other plant groups.
Acknowledgments
We gratefully thank Professor J. Greilhuber, Dr M. Fay and an anonymous referee for their advice, which improved the manuscript. We acknowledge the support of Miquel Veny (Institut Botànic de Barcelona), who carefully maintained the plants analysed in this study. We thank Jaume Comas, Ricard Álvarez (Serveis Cientificotècnics generals, Universitat de Barcelona) and Màrius Mumbrú (Laboratori de Botànica, Facultat de Farmàcia, Universitat de Barcelona) for their assistance, R. Rycroft for the English language revision, and Spencer C. Brown and Olivier Catrice (Institut des Sciences du Végétal, CNRS, Gif-sur-Yvette) for supplying Petunia hybrida and Pisum sativum, used as internal standards. This work was subsidized by DGICYT (Spanish government; projects BOS2001-3041-C02-01 and CGL 2004-04563-C02-02/BOS). S.G. is the recipient of a pre-doctoral grant from the Spanish government.
LITERATURE CITED
- Ashri A, Knowles PF. 1960. Cytogenetics of safflower (Carthamus L.) species and their hybrids. Agronomy Journal 52: 11–17. [Google Scholar]
- Bennett MD, Leitch IJ. 2004. Plant DNA C-values Database (release 3.0, December 2004). http://www.rbgkew.org.uk/cval/homepage.html.
- Bennett MD, Leitch IJ, Hanson L. 1998. DNA amounts in two samples of angiosperm weeds. Annals of Botany 82 (Suppl. A): 121–134. [Google Scholar]
- Bennetzen JL. 2002. Opening the door to comparative plant biology. Science 296: 60–63. [DOI] [PubMed] [Google Scholar]
- Bennetzen JL, Ma J, Devos KM. 2005. Mechanisms of recent genome size variation in flowering plants. Annals of Botany 95: 127–132. [DOI] [PMC free article] [PubMed] [Google Scholar]
- Buitendijk JH, Boon EJ, Ramanna MS. 1997. Nuclear DNA content in twelve species of Alstroemeria L. and some of their hybrids. Annals of Botany 79: 343–353. [Google Scholar]
- Bureš P, Wang YF, Horová L, Suda J. 2004. Genome size variation in central European species of Cirsium (Compositae) and their natural hybrids. Annals of Botany 94: 353–363. [DOI] [PMC free article] [PubMed] [Google Scholar]
- Comai L. 2000. Genetic and epigenetic interactions in allopolyploid plants. Plant Molecular Biology 43: 387–399. [DOI] [PubMed] [Google Scholar]
- Dolezel J, Bartos J, Voglmayr H, Greilhuber J. 2003. Nuclear DNA content and genome size of trout and human. Cytometry 51A: 127–128. [DOI] [PubMed] [Google Scholar]
- Efron Y, Peleg M, Ashri A. 1973. Alcohol dehydrogenase allozymes in the safflower genus Carthamus. Biochemical Genetics 9: 299–308. [DOI] [PubMed] [Google Scholar]
- Estilai A, Knowles PF. 1976. Cytogenetic studies of Carthamus divaricatus with eleven pairs of chromosomes and its relationship to other Carthamus species (Compositae). American Journal of Botany 63: 771–782. [Google Scholar]
- Estilai A, Knowles PF. 1978. Relationship of Carthamus leucocaulos to other Carthamus species (Compositae). Canadian Journal of Genetics and Cytology 20: 221–233. [Google Scholar]
- Galbraith DW, Harkins KR, Maddox JM, Ayres NM, Sharma DP, Firoozabadi E. 1983. Rapid flow cytometric analysis of the cell cycle in intact plant tissues. Science 220: 1049–1051. [DOI] [PubMed] [Google Scholar]
- Gerstel DU, Burns JA. 1966. Flower variegation in hybrids between Nicotiana tabacum and N. otophora. Genetics 53: 331–338. [DOI] [PMC free article] [PubMed] [Google Scholar]
- Gregory TR. 2001. Coincidence, coevolution or causation? DNA content, cell size, and the C-value enigma. Biological Reviews 76: 65–101. [DOI] [PubMed] [Google Scholar]
- Gregory TR. 2005. The C-value enigma in plants and animals: a review of parallels and an appeal for partnership. Annals of Botany 95: 133–146. [DOI] [PMC free article] [PubMed] [Google Scholar]
- Greilhuber J, Dolezel J, Lysák MA, Bennett MD. 2005. The origin, evolution and proposed stabilization of the terms ‘genome size’ and ‘C-value’ to describe nuclear DNA contents. Annals of Botany 95: 255–260. [DOI] [PMC free article] [PubMed] [Google Scholar]
- Hanelt P. 1963. Monographische Übersicht der Gattung Carthamus L. (Compositae). Feddes Repertorium Specierum Novarum Regni Vegetabilis 67: 41–180. [Google Scholar]
- Harvey BL, Knowles PF. 1965. Natural and artificial alloploids with 22 pairs of chromosomes in the genus Carthamus (Compositae). Canadian Journal of Genetics and Cytology 7: 126–139. [Google Scholar]
- Kellogg EA. 1998. Relationships of cereal crops and other grasses. Proceedings of the National Academy of Sciences of the USA 95: 2005–2010. [DOI] [PMC free article] [PubMed] [Google Scholar]
- Khidir MO, Knowles PF. 1970a. Cytogenetic studies of Carthamus species (Compositae) with 32 pairs of chromosomes. I. Intrasectional hybridization. American Journal of Botany 57: 123–129. [Google Scholar]
- Khidir MO, Knowles PF. 1970b. Cytogenetic studies of Carthamus species (Compositae) with 32 pairs of chromosomes. II. Intersectional hybridization. Canadian Journal of Genetics and Cytology 12: 90–99. [Google Scholar]
- Knowles PF, Ashri A. 1958. Wild safflower in California. California Agriculture 12: 4–5. [Google Scholar]
- Leitch IJ, Chase MW, Bennett MD. 1998. Phylogenetic analysis of DNA C-values provides evidence for a small ancestral genome size in flowering plants. Annals of Botany 82: 85–94. [Google Scholar]
- Liu B, Wendel JF. 2002. Non-Mendelian phenomena in allopolyploid genome evolution. Current Genomics 3: 489–505. [Google Scholar]
- López G. 1990. Acerca de la clasificación natural del género Carthamus L., s. l. Anales del Jardín Botánico de Madrid 47: 11–34. [Google Scholar]
- Marie D, Brown SC. 1993. A cytometric exercise in plant DNA histograms, with 2C values for 70 species. Biology of the Cell 78: 41–51. [DOI] [PubMed] [Google Scholar]
- Murray BG. 2005. When does intraspecific C-value variation become taxonomically significant? Annals of Botany 95: 119–125. [DOI] [PMC free article] [PubMed] [Google Scholar]
- Ozkan H, Tuna M, Arumuganathan K. 2003. Nonadditive changes in genome size during allopolyploidization in the wheat (Aegilops-Triticum) group. Journal of Heredity 94: 260–264. [DOI] [PubMed] [Google Scholar]
- Peirce JR. 1992. The biology of Australian weeds 23. Carthamus lanatus L. Plant Protection Quarterly 7: 86–95. [Google Scholar]
- Petrov DA, Sangster TA, Johnston JS, Hartl DL, Shaw KL. 2000. Evidence for DNA loss as a determinant of genome size. Science 287: 1060–1062. [DOI] [PubMed] [Google Scholar]
- Pomel A. 1874. Nouveaux matériaux pour la Flore Atlantique. Paris.
- Price HJ. 1976. Evolution of DNA content in higher plants. Botanical Reviews 42: 27–52. [Google Scholar]
- Šiško M, Ivancic A, Bohanec B. 2003. Genome size analysis in the genus Cucurbita and its use for determination of interespecific hybrids obtained using the embryo-rescue technique. Plant Science 165: 663–669. [Google Scholar]
- Suda J, Kyncl T, Freiová R. 2003. Nuclear DNA amounts in Macaronesian angiosperms. Annals of Botany 92: 153–164. [DOI] [PMC free article] [PubMed] [Google Scholar]
- Swift H. 1950. The constancy of desoxyribose nucleic acid in plant nuclei. Proceedings of the National Academy of Sciences of the USA 36: 634–654. [DOI] [PMC free article] [PubMed] [Google Scholar]
- Vilatersana R, Martín J, Susanna A, Garcia-Jacas N, Garnatje T. 2000. Generic delimitation and phylogeny of the Carduncellus–Carthamus complex (Asteraceae) based on ITS sequences. Plant Systematics and Evolution 221: 89–51. [Google Scholar]
- Vilatersana R, Garnatje T, Susanna A, Garcia-Jacas N. 2005. Taxonomic problems in Carthamus (Asteraceae): RAPD markers and sectional classification. Botanical Journal of the Linnean Society 147: 375–383. [Google Scholar]