

Abstract
• Background and Aims It is well known that plant aerial development is affected by light intensity in terms of the date of flowering, the length of stems and petioles, and the final individual leaf area. The aim of the work presented here was to analyse how shade-induced changes in leaf development occur on a dynamic basis from the whole rosette level to that of the cells.
• Methods Care was taken to ensure that light intensity was the only source of micro-meteorological variation in the study. The dynamics of leaf production, rosette expansion, individual leaf area expansion and epidermal cell expansion were analysed in Arabidopsis thaliana plants grown under two light intensities in three independent experiments.
• Key Results The total area of rosette leaves was reduced by the shading treatment. Both the number of leaves produced and their individual leaf areas were reduced. The reduction in leaf number was associated with a reduction in leaf initiation rate and the duration of the phase of leaf production. The reduction in individual leaf area was associated with a reduction in leaf expansion rate and an increase in the duration of leaf expansion. The changes in leaf expansion dynamics were accompanied by a decrease in epidermal cell number which was partly compensated for by an increase in epidermal cell area. Overall, the whole rosette leaf expansion rate was reduced by shading, whereas the total duration of rosette leaf expansion was unaffected. This was mainly due to the accumulation of the increases in the durations of expansion of each individual leaf which was associated with an increase in cell expansion.
• Conclusions The dynamic analysis presented here reveals a new shade-adaptative response mediated via the control of area expansion at the cell, organ and whole plant levels.
Keywords: Arabidopsis thaliana, light intensity, leaf development, expansion rate, duration, initiation, cell expansion
INTRODUCTION
In natural conditions, the light environment of plants varies spatially and temporally in terms of its quality, its quantity and its duration. These three light components are perceived by different photoreceptors and induce distinct physiological and developmental responses (Chory, 1997; Casal, 2000; Chen et al., 2004). In natural conditions, all three light components vary together, therefore it iss difficult to determine precisely which light component induces which plant response. Here the focus is on the effects of light quantity on leaf development in Arabidopsis thaliana.
Reductions in light quantity affect numerous aspects of plant development. Many of these effects are related to the reduction in photosynthesis and consequential changes in sugar availability. For example, root growth is reduced and this has been shown to be related to the limitation in sugar supply from the leaves (Aguirrezabal and Tardieu, 1996; Muller et al., 1998; Freixes et al., 2002), and this is also true for maize kernel set (Setter et al., 2001). As well as the effects of carbon limitation, reductions in light intensity also invoke many specific physiological and morphological responses. The responses most studied are those of the induction of flowering (e.g. Franklin and Whitelam, 2005) and the elongation of stems and petioles (e.g. Kozuka et al., 2005). Additionally, reductions in light intensity induce changes in leaf morphology and alteration of leaf development at the cellular level (Dengler, 1980; Lee et al., 2000; Yano and Terashima, 2004).
In terms of the dynamics of leaf growth, reductions in light intensity have been shown to cause either a reduction or an increase in leaf expansion (e.g. Wilson, 1966; Dengler, 1980; Volenec and Nelson, 1982; Lichtentahler, 1983; Schnyder and Nelson, 1988). There may be a wide range of species-specific responses to the effects of light intensity on leaf development, thus the response of one species cannot be inferred from that of another. However, this controversy could also come from the fact that reduction in incident light is often imposed with different kind of meshes, certainly affecting other micrometeorological conditions which are known to interact with leaf growth. First, shading plants often causes a decrease in leaf temperature. This could have an impact on leaf growth as leaves expand for a longer period at a reduced rate when temperature is decreased (Ben Haj Salah and Tardieu, 1995; Granier and Tardieu, 1998; Lafarge et al., 1998; Granier et al., 2002). In order to avoid such confusion, it is possible to maintain a constant leaf temperature artificially (Volenec and Nelson, 1982; Schnyder and Nelson, 1988). Secondly, shading is most often accompanied by a decrease in evaporative demand and plant transpiration. This could favour leaf expansion rate because a negative relationship between leaf expansion rate and vapour pressure deficit has been reported in maize and sorghum (Ben Haj Salah and Tardieu, 1996; Lafarge and Tardieu, 2002). It is therefore necessary to maintain evaporative demand at low values in the light treatment to accurately test an effect of reduced light intensity. Thirdly, shading can affect the spectral distribution of light, which could also alter leaf development (Gautier et al., 2000), so it is necessary to use neutral filters.
Making use of ‘state-of-the-art’ plant culturing facilities, this work aimed to investigate the effect of light quantity on rosette leaf development in A. thaliana. Rosette leaf development was analysed as a dynamic process at the cell, organ and whole plant levels. Alterations of these variables are discussed in terms of a shade-adaptation strategy.
MATERIALS AND METHODS
Plant culture and experimental design
Wild-type seeds of A. thaliana (L.) Heynh. ecotype Landsberg erecta (Nottingham Arabidopsis Stock Centre) were grown for three experiments (expts 1–3) in two growth-chambers with different light intensities (‘light’ and ‘shade’ treatments). Light in the growth chamber was provided by a bank of cool-white fluorescent tubes and sodium lamps for a photoperiod of 10 h. The shading used was neutral; the light spectrum was unaffected and was tested using a LI-1800 spectroradiometer (LI-COR, Lincoln, NB, USA) (data not shown). Photosynthetic photon flux density (PPFD) was measured continuously at plant level using a radiation sensor (LI-190SB, LI COR). Air temperature and relative humidity were measured by sensors at 20-s intervals (HMP35A Vaisala Oy, Helsinki, Finland). Air humidity was maintained at 75 % in the light treatment and 68 % in the shade. Air temperature was maintained between 21·5 and 22·5 °C during the day and night in both chambers. Leaf temperature was measured with copper-constantan thermocouples touching the lower side of the lamina after leaf emergence. All measurements of temperature, PPFD and relative humidity were averaged and stored every 600 s by a datalogger (Campbell Scientific, LTD- CR10 Wiring Panel, Shepshed, Leics., UK).
Seeds were stored at 4 °C before sowing and then five seeds were sown in 200 cylindrical pots (53 mm diameter and 88 mm height) containing a 50 : 50 mixture (v/v) of loamy soil and organic compost. To avoid population density effects, young seedlings were thinned to one plant per pot 10 d after germination. The substrate was maintained at 80 % of field capacity (corresponding to a soil water content of 0·50 g g−1 of dry soil) by weighing the pots once a day and watering them with a modified one-tenth strength Hoagland's solution with additional micronutrients (Hoagland and Arnon, 1950).
The shade treatments were applied at the initiation of leaf 6, approx. 8 d after sowing when the cotyledons were fully opened and the first two leaves were starting to emerge. The daily mean PPFD in the light treatment was 9·4, 8·5 and 8·4 mol m−2 d−1 and in the shade treatments it was 2·7, 2·2 and 2·5 mol m−2 d−1 in expts 1, 2 and 3 respectively.
Growth measurements
Leaf number
Five plants were harvested at intervals of 2–3 d. Plants were dissected in a drop of water using a microscope (Leica stereomicroscope, wild F8Z, Wetzlar, Germany) at a magnification of ×160. The number of leaves initiated (the number of leaves and leaf primordia visible on the apex) were counted. Leaves were visible when their areas were approx. 0·001 mm2. Maximum leaf initiation rate (IRmax) was calculated as the maximum slope of the linear relationship between leaf number (N) and time (t) during the phase from the initiation of the 4th leaf to the cessation of leaf initiation.
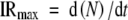 |
(1) |
The duration of the phase of vegetative leaf production was determined as the time taken for 95 % of the final number of rosette leaves to be initiated. The emergence of leaves on the rosette was also determined every 2–3 d by counting the number of leaves visible on the rosette.
Individual leaf development
Areas of each individual leaf on the rosette were measured at intervals of 2–3 d from initiation to the end of expansion of the leaf. From leaf initiation to leaf emergence, this was done by dissecting the apex of five plants in a drop of water under the microscope, the area of the excised leaf was measured with image analysis software (Bioscan-Optimas V 4·10, Edmonds, WA, USA). After leaf emergence, the individual leaf area of ten plants was measured with the aforementioned image analysis software on digital photographs until the end of leaf expansion. Absolute leaf expansion rate at time j (LERj) was calculated from initiation to the end of expansion as the local slope (at time j) of the relationship between leaf area (A) and time:
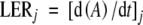 |
(2) |
LERj was calculated by calculating the slope over three data points (j ± 2 or 3 d) which was plotted against the mean time over the period for which it was calculated.
A sigmoidal curve was fitted to the curve relating leaf expansion to time:
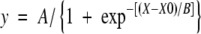 |
(3) |
Final leaf area was calculated as the upper assymptote (A, the plateau) of the sigmoidal curve (eqn 3). Leaf expansion was considered to begin at the time at which the leaf was initiated and to end when it reached 95 % of its final area as calculated from the sigmoidal curve (eqn 3). The maximum absolute expansion rate (LERmax) was calculated as the point of inflection of the fitted sigmoidal curve by the equation (adapted from Torres and Frutos, 1989):
 |
(4) |
Leaf relative expansion rate at time j (RERj) was calculated from initiation to the end of expansion as the local slope (at time j) of the relationship between the logarithm of leaf area (A) and time :
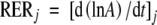 |
(5) |
Like that of LERj, RERj was calculated by calculating the slope over three data points (j ± 2 or 3 d) which was plotted against the mean time over the period for which it was calculated.
Rosette leaf development
Rosette area (total area of rosette leaves) was calculated at intervals of 2–3 d from plant emergence to the end of expansion of the last formed leaf by the sum of each individual leaf area. As for leaf expansion, rosette area expansion was fitted to the sigmoidal curve given by eqn 3. Final rosette area, absolute rosette area expansion rate, the duration of rosette area expansion and relative rosette area expansion rate were calculated by replacing individual leaf area by rosette area in eqns 2–5.
Cellular development
Each 2–3 d after the emergence of leaf 6, a transparent replication film of the adaxial epidermis was obtained after evaporation of a varnish spread on the upper surface of leaf 6. Films were placed under a microscope (Leica, Leitz DM RB, Wetzlar, Germany) coupled to an image analyser. Twenty-five epidermal cell areas were measured at four different places on each leaf, near the base, near the tip and one on each side of the leaf. Epidermal cell number was calculated from the mean cell area and the final area of each leaf.
Photosynthesis measurements
Shoot photosynthetic rate measurements were made at the middle of the day inside the growth chamber, in which the plants were cultivated, on excised rosettes, using a portable closed gas-exchange system (LI-6200; LI-COR Biosciences). Plants were excised and were immediately measured in a 2-L chamber. Carbon dioxide was at atmospheric concentrations of approx. 425 ppm. The effect of excision on photosynthetic rate was tested in a preliminary experiment which showed that the photosynthetic rate was maintained for 15 min after excision (data not shown). As a consequence, photosynthetic rate measurements were done within the first 10 min after excision.
Specific leaf weight
Samples of mature leaf 6 were harvested at the end of the day. The specific leaf weight was determined by drying, in an oven at 60 °C, punched-out leaf circles of known area until they reached a constant weight and calculating the weight of the leaf per unit area.
Statistical analysis of data
All statistical analysis was done at a significance level of P = 0·05 using the computer package analysis SPSS 11.0 for Windows (SPSS Inc., Chicago, IL, USA). The differences in the following variables were compared using a one-way ANOVA where the assumptions of the ANOVA were met: leaf number, maximum leaf initiation rate, duration of phase of rosette leaf initiation, final rosette area, maximal absolute rosette expansion rate, duration of rosette expansion, final individual leaf area, maximal absolute leaf expansion rate, duration of leaf expansion, maximum absolute cell expansion rate, duration of cell expansion, epidermal cell number, photosynthetic rate, and specific leaf weight. Median epidermal cell area was analysed using a Mann–Whitney U-test. The confidence intervals (95 %) shown on graphs were calculated using Microsoft Excel.
RESULTS
The shade treatments used here approximately halved the rate of photosynthesis. In the light treatment the mean photosynthesis rate was 10·3 µmol m−2 s−1 and in the shade it was 4·4 µmol m−2 s−1, this difference was significant (tested using a one-way ANOVA, F(1,6) = 56·1, P = 0·0003).
Reductions in light intensity affected the dynamics of rosette area development
Rosette area expands continuously throughout the development of an individual A. thaliana plant and when the rosette area (sum of all individual leaves) is plotted on a linear scale it forms a sigmoidal-shaped curve (Fig. 1A). The shade treatment reduced the final rosette area by a factor of 5 (Fig. 1A). In order to interpret the rosette expansion changes induced by the shade treatment, the absolute rosette area expansion rate (the area formed per unit of time) was plotted against time, which produced a bell-shaped curve (Fig. 1B). The maximal value of absolute rosette expansion rate was reduced by a factor of 9 by the shade treatment (Fig. 1B). This maximal value was reached two thirds through rosette development for plants in both light and shade treatments. Plotting the expansion of the rosette area on a natural log scale reveals that the young rosettes are in fact rapidly growing during the early stages of plant development (not shown). This rapid relative rosette expansion is clearly viewed by plotting relative expansion rate (the increase in unit area formed per unit area and per unit of time) against time (Fig. 1C). Relative expansion rate was high at the beginning of rosette expansion and then declined continuously until the end of expansion (Fig. 1C). It was decreased by the shade treatment for most of the plant development. The total duration of rosette expansion was unaffected by the reduction in light intensity (ANOVA, F(1,20) = 1·64, P = 0·229; Fig. 1A); it was 37·5 d in the higher light treatment and 38·8 d in the reduced light condition.
Fig. 1.

Changes with time of (A) rosette area (sum of the areas of all rosette leaves), (B) absolute rosette area expansion rate, (C) relative rosette area expansion rate, (D) the number of leaves initiated and (E) the number of leaves emerged on plants grown under light (8·5 mol m−2 d−1, open symbols) and shade (2·2 mol m−2 d−1, closed symbols). A sigmoid curve was fitted to the rosette area data as described in Materials and methods. Means with 95 % intervals of confidence are given, n = 10 for all except (D) in which each point represents the dissection of five plants. The data presented are from expt 2.
Reductions in light intensity affected the dynamics of leaf production
The reduction in the final rosette area was partly due to a reduction in final leaf number, which was halved by the shading treatment (Fig. 1D and E). On a dynamic basis, reduction in leaf number could be attributed to a reduction in both the rate at which leaves were initiated on the apex (reduced from 1·32 to 0·75 leaves d−1 by the reduced light intensity; Fig. 1D) and the duration of the phase of leaf initiation (reduced by approx. 7 d; Fig. 1D). Light intensity similarly affected the leaf emergence rate (the rate of appearance of leaves visible to the naked eye), which was considerably reduced by shading as was the duration of the phase of leaf emergence (Fig. 1E).
Reductions in light intensity affected the dynamics of individual leaf expansion
The reduction in the final rosette area was also caused by reductions in final individual leaf area (Fig. 2A). Like that of rosette expansion, when individual leaf area expansion is plotted on a linear scale it forms a sigmoidal shaped curve (Fig. 2A). The shade treatment imposed clearly alters the form of this curve and reduces the final leaf area (Fig. 2A). The maximal absolute leaf expansion rate was reduced by the shade treatment and shifted to a few days later (Fig. 2B). Relative leaf expansion rate was high and quasi-stable at the beginning of leaf expansion and then declined continuously until the end of expansion (Fig. 2C). This high relative leaf expansion rate value was reduced and extended by a few days by the shade treatment (Fig. 2C). Unlike absolute leaf expansion rate, relative leaf expansion rate in shaded plants was reduced only during a first part of leaf development but recovered afterwards and was even higher than in control plants during a second part of leaf development. Overall, the duration of leaf expansion was increased by the shade treatment and the fact that the maximum relative and absolute expansion rates peaked later suggests that the increase in duration of leaf expansion occurred throughout leaf development.
Fig. 2.
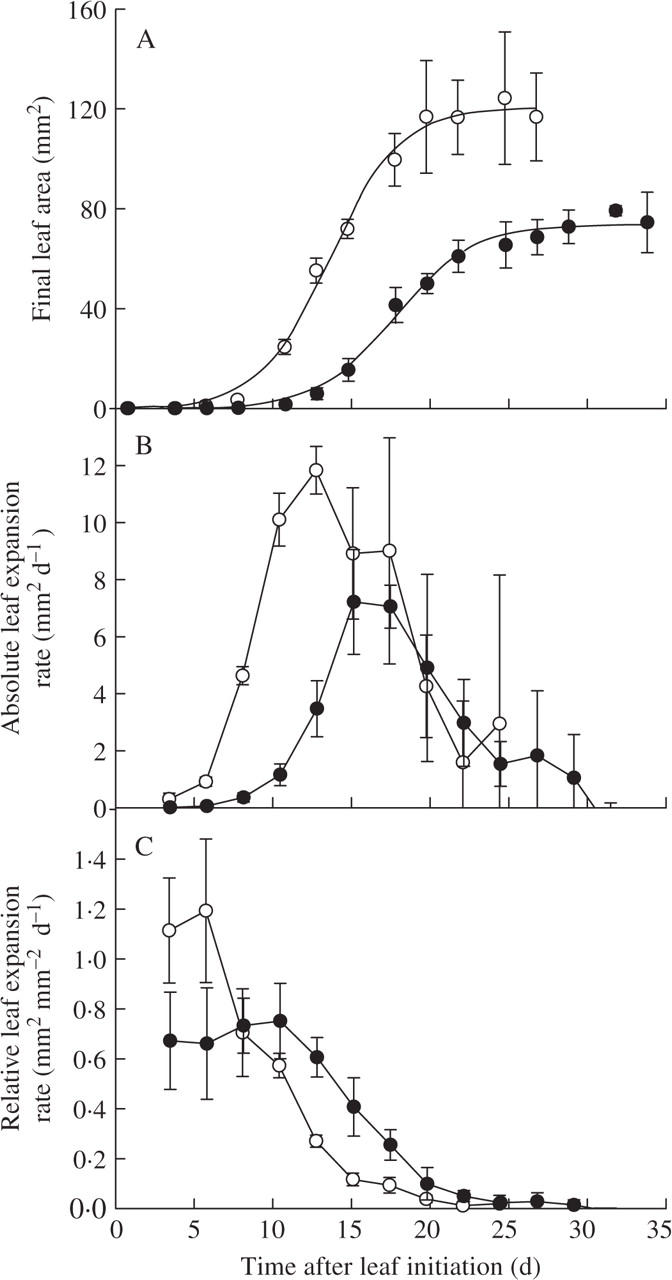
Changes with time of (A) leaf 6 area, (B) absolute leaf 6 expansion rate, and (C) relative leaf 6 expansion rate of plants grown under light (8·4 mol m−2 d−1, open symbols) or shade treatment (2·5 mol m−2 d−1, closed symbols) in expt 3. Means with 95 % intervals of confidence are given, each point represents the measurement of five leaf areas.
Reductions in light intensity affected all the leaves of the rosette in the same fashion
The changes in the kinematics of leaf 6 were typical of those changes invoked by the shade treatment in all leaves of the rosette profile (Fig. 3). Leaves of plants grown under shade treatments were reduced in area (Fig. 3A) and this was accompanied by a decrease in maximal absolute leaf expansion rate (Fig. 3B) and an increase in the duration of individual leaf expansion (Fig. 3C). In general, shading considerably affected the profiles of final leaf area variation of plants. In the control light conditions, leaf size increased with increasing leaf number until a maximal size was reached two-thirds up the plant. After this maximal size, the final few leaves were reduced in size. As a consequence, the leaf with the largest leaf area was leaf number 12 when 18 leaves were formed (Fig. 3A). In contrast, in shade conditions, leaf size increased with increasing leaf number until the last leaf. In this case, the leaf with the largest leaf area was the last formed, here leaf number 8 (Fig. 3A). A similar pattern was also observed for maximal absolute leaf expansion rate. Maximal absolute leaf expansion rate was the same for the first two leaves, then increased with increasing leaf number until a maximum and then decreased again (except for the shade treatments). Whereas the duration of leaf expansion was similar for the first three leaves, it was higher for leaves after the 3rd leaf but did not differ significantly among them.
Fig. 3.
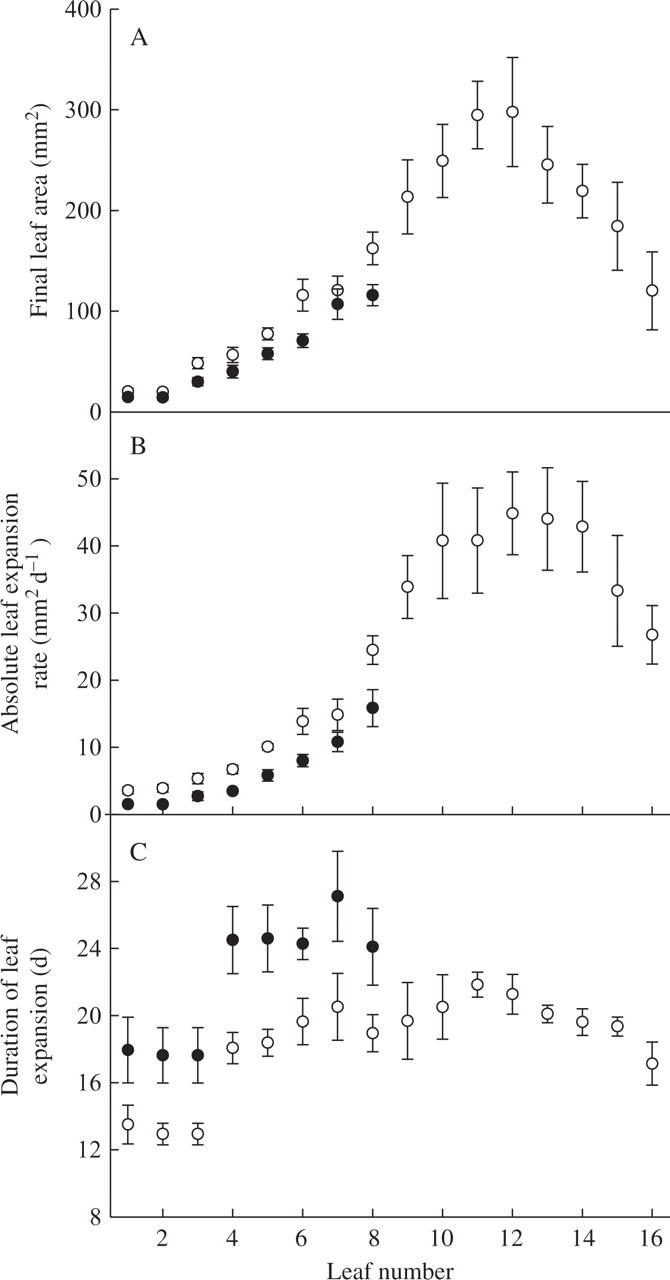
The profiles of (A) final leaf area, (B) maximum absolute leaf expansion rate and (C) the duration of leaf expansion of each leaf of plants grown under light (9·4 mol m−2 d−1, open symbols) or shade treatment (2·7 mol m−2 d−1, closed symbols) in expt 1. Means with 95 % intervals of confidence are given (n = 10).
Shading affected epidermal cell development and specific leaf weight
The reduction in light intensity reduced epidermal cell number by a factor of 5 (Fig. 4A). Specific leaf weight was also reduced (Fig. 4A, insert). In contrast, mean epidermal final cell area was increased by the shade treatments (not shown). However, the absolute and relative cell expansion rates were increased by the shade treatment, resulting in larger final epidermal cell area of plants grown under the shade treatment. As a consequence, distributions of epidermal cell area in the leaves are presented as box plots and the increase in epidermal cell size caused by the shade treatment is clearly visible (Fig. 4B).
Fig. 4.
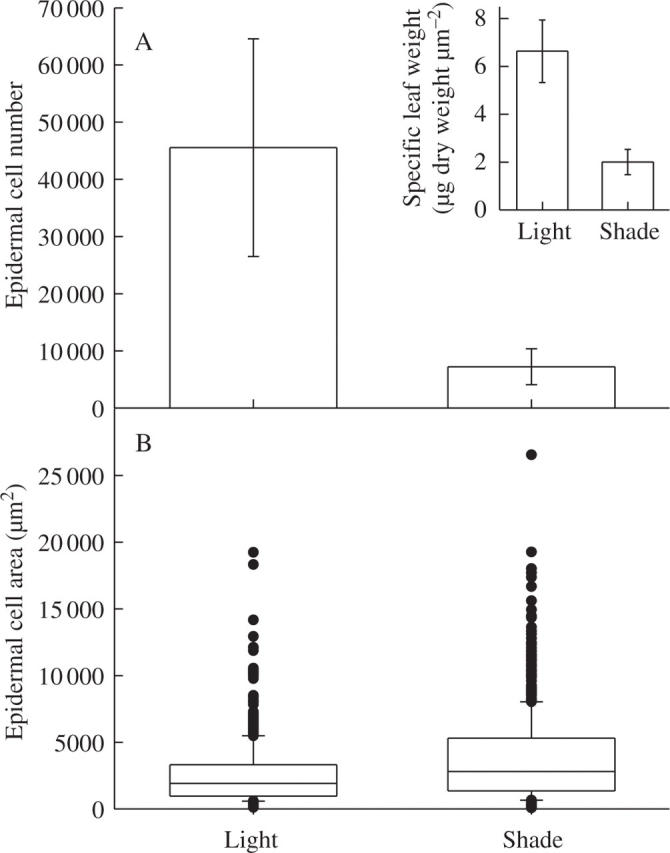
The effect of shading on leaf 6 epidermal cells of plants grown under light (8·4 mol m−2 d−1) or shade treatment (2·5 mol m−2 d−1) in expt 3. (A) Mean epidermal cell number with 95 % intervals of confidence, n = 5. (B) Box plots of epidermal cell size, the upper and lower dimensions of the boxes representing the third and first quartiles, the medians indicated by bars inside the boxes and the circles representing outlying values (below the 10th and above the 90th centile) (n = 600). Inset, specific leaf weight of leaf 6 of plants grown during expt 3, means with 95 % intervals of confidence are given (n = 5).
Analysing the dynamics of epidermal cell area expansion showed that ‘early on in leaf development’ median cell size was greater in those plants grown in the light than shade (Fig. 5A). However, the absolute and relative cell expansion rates were increased rapidly by the shade treatment with the epidermal cell size being greater in the leaves of plants grown under the shade treatment (Fig. 5B and C). In addition to expanding more rapidly, epidermal cells of plants grown under the shade treatment continued their expansion for longer (Fig. 5).
Fig. 5.
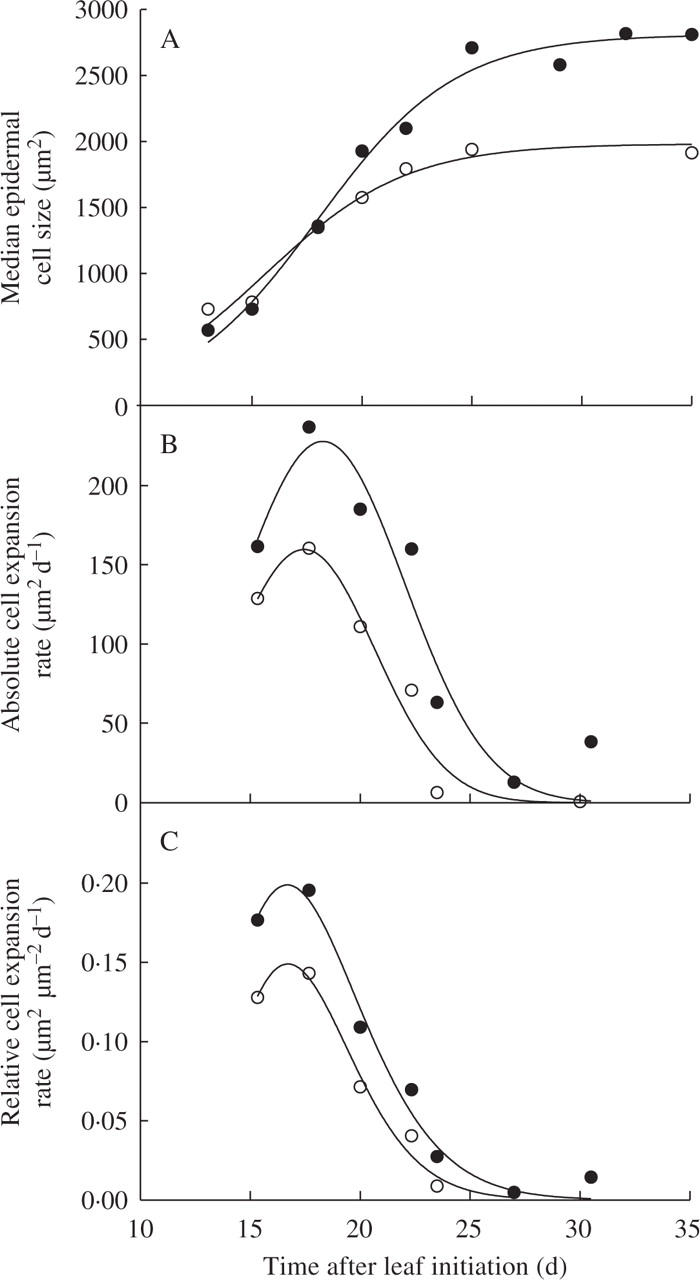
Changes with time of (A) median epidermal cell size, (B) mean absolute epidermal cell expansion rate, and (C) mean relative epidermal cell expansion rate of plants grown under light (8·4 mol m−2 d−1, open symbols) or shade treatment (2·5 mol m−2 d−1, closed symbols) in expt 3.
DISCUSSION
Shading caused a reduction in leaf number without affecting the duration of rosette area expansion
Shading dramatically reduced rosette leaf number at bolting, by reducing both the rate of leaf initiation and the duration in which leaves were initiated on the apex. A reduction in leaf initiation or emergence rate in response to neutral shading has been described in other species (e.g. Newton, 1963). However, in A. thaliana accessions, this response has been shown to be quite variable, leaf number is decreased, maintained or increased depending on the genotype (Pigliucci and Kolodynska, 2002). Here, the reduction in leaf number and the duration of leaf initiation resulted in the acceleration of the time to flowering (of approx. 3 d) which is in agreement with the common descriptions of shade adaptative responses (e.g. Botto and Smith, 2002).
The shade-induced changes in the initiation of leaves also resulted in severe alterations in rosette area expansion: rosette area (total area of rosette leaves) was reduced by 5, absolute rosette expansion rate was reduced by a factor of 9 and relative rosette expansion was reduced during most of plant development. Interestingly, the duration of rosette expansion was unaffected by the shade treatment despite the fact that there were less leaves present in the rosette. A similar phenomenon has been reported in sunflower in which a mild water stress, despite causing a reduction in leaf number, did not affect the time between seedling germination and the end of whole plant leaf expansion (Rawson and Turner, 1982) or between plant emergence and inflorescence primordium initiation (Yegappan et al., 1980).
Shading has opposite effects on the rate and duration of individual leaf expansion
As outlined in the Introduction, there is controversy concerning the effect of shading on the dynamics of leaf expansion; however, with careful control of environmental treatments the effects of shading on individual A. thaliana leaf expansion were clear and reproducible. The final individual leaf area was consistently reduced by the reduction in incident light intensity in three independent experiments. This was associated with reductions in the relative and absolute expansion rates. As in sunflower leaves, absolute leaf expansion rate was reduced during the whole expansion period, whereas relative leaf expansion rate was only reduced during a first phase of leaf development (Granier and Tardieu, 1999a). In contrast, the duration of expansion was increased for each individual leaf and this could facilitate the attainment of a larger leaf area than would be possible otherwise. A reduction in leaf expansion rates under shading has been reported in other dicotyledonous leaves, whereas the increase in duration of expansion has only been observed under certain light intensity treatments (Rawson and Dunstone, 1986; Granier and Tardieu, 1999a). The changes in the dynamics of individual leaf expansion, the decrease in expansion rate and the increase in expansion duration observed in the present study, contribute to the dramatic reduction in maximal absolute expansion rate and the maintenance of the duration of expansion at the scale of the rosette.
Shading has opposite effects on the rate and duration of cell division in leaves
The effect of shading on the dynamics of epidermal cell production was not measured in the present study. However, it was possible to simulate the kinetics of relative cell division rate from the data (Fig. 6). The simulation of relative leaf expansion rate (RER) was made by using the mean RER over the phase when the rate appeared to be maximal and stable for the initial values. The decline in RER was described by a single two-parameter exponential decay curve. The curve of relative cell expansion rate (RCR) forms a peak shape (Granier and Tardieu, 1999b; Granier et al., 2000); therefore, a log-normal three-parameter curve was fitted to describe these data. The time course of relative cell division rate (RDR) was deduced from the curves of relative leaf expansion rate and relative cell expansion rate by Green's equation, RDR = RER – RCR (Green, 1976). The simulation of RDR suggests that the initial values of RDR were reduced by shading and that the duration of the phase of maximal RDR was increased (by approx. 5 d) as well as the whole duration of the phase of cell division (Fig. 6). The increased duration of the phase of cell division was not sufficient to compensate for the decrease in cell division rate, thus final cell number was decreased by shading. Reductions in light intensity have long been known to reduce cell number, and similar results on the dynamics of cell production were reported by Wilson (1966).
Fig. 6.
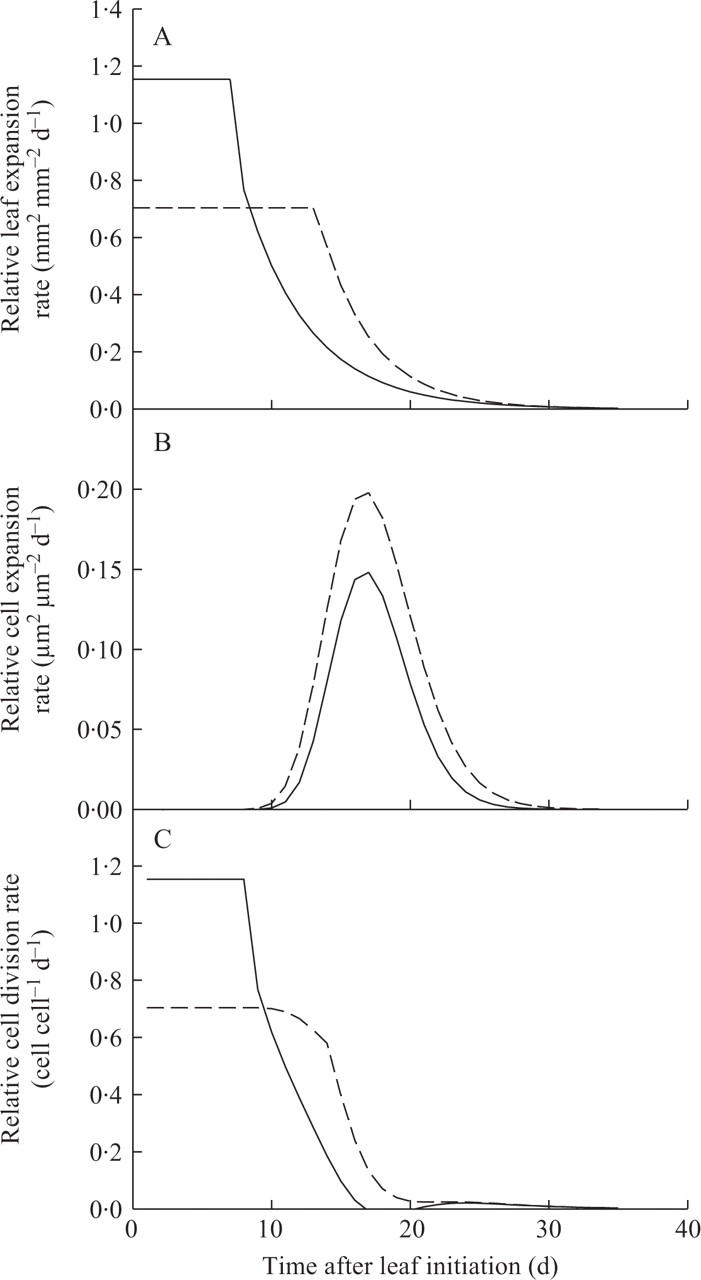
Simulations of changes with time of (A) leaf 6 relative expansion rate (RER), (B) leaf 6 relative cell expansion rate (RCR), and (C) calculated leaf 6 relative cell division rate (RDR) of plants grown under light (8·4 mol m−2 d−1, solid lines) or shade treatment (2·5 mol m−2 d−1, dotted lines) in expt 3. The lines represent simulated data for (A) RER (made by using the mean RER over the initial maximal phase, the decline in RER was described by y = ae−bx), (B) RCR (made by using the curve y = ae[–0·5{ln[(x/x0)/b]}]2) and (C) RDR (made by subtracting RCR from RER).
Shading has opposite effects on cell number and cell size
The shading treatment used in this study induced a reduction in epidermal cell number, which was accompanied by an increase in cell size. A reduction in epidermal cell number by shading has been reported in other species, e.g. Dengler (1980) and Granier and Tardieu (1999a) on sunflower leaves, and Wilson (1966) and Newton (1963) on leaves of Cucumis sativus. In contrast, the increase in cell size could be species-specific as cell size is not affected in Cucumis sativus (Wilson, 1966) or it could depend on the severity of the treatment imposed, e.g. cell size is not affected when sunflower leaves are grown at a light intensity that reduces leaf area by 50 % (Dengler, 1980; Granier and Tardieu, 1999a) but it is increased by more severe shading treatments that reduce leaf area by more than 80 % (Granier and Tardieu, 1999a). These changes at the cellular level are reflected in the changes of specific leaf weight (SLW), which was reduced by the shade treatment. This is in agreement with the effects of shading on sunflower and Sinapis arvensis which show decreased SLW in response to shading (Dengler, 1980; Steinger et al., 2003). Furthermore, this is in concurrence with the observation that in A. thaliana shading is generally characterized by a reduction in the number of layers of palisade cells (Kim et al., 2005), which could be expected to be accompanied by a reduction in SLW. Also, the increase in epidermal cell size reported here could also contribute to the reduction in SLW. In a collection of 40 accessions, Pigliucci and Kolodynska (2002) reported a decrease in SLW induced by low light treatment for 39 of them, suggesting that this behaviour is in fact quasi-systematic in A. thaliana.
How do differences in cell number and cell size contribute to the control of leaf size under shading?
Theories of leaf size control have been debated for many years (e.g. Fleming, 2002; Tsukaya, 2003). According to the classical cell theory, a cell is the basic unit of a multicellular organism and is therefore the unit of organogenesis. Evidence for this theory is often based upon the positive relationship between cell number and final organ size (e.g. Granier et al., 2000; Cookson et al., 2005). According to the organismal theory, genetic information specifies the form of leaves independent of sizes and shapes of cells; thus leaf size control is at the scale of the whole organ. Evidence for this theory is often based on the observation that organ size and/or shape can be maintained to some degree when cell division is blocked or decreased in plant organs (e.g. Haber and Foard, 1963; Hemerly et al., 1995). To reconcile the two aforementioned theories and integrate them with additional observations the neo cell theory has been proposed in which there is a ‘compensatory system’ of leaf size control (Tsukaya, 2002). Neo cell theory links the cellular and organismal theories so that the cell is the unit of organogenesis and that each cell is controlled by factors (from individual cells or cell populations) that govern the morphogenesis of the organ of which it is a part (Tsukaya, 2002). The present results are in agreement with this theory. The decrease in cell number caused by shading is partly but not totally compensated for by an increase in cell size resulting in a smaller leaf size. However, the present results also suggest that another level of plant organization has to be considered in the control of organ size; the whole plant itself, as all the changes observed at the cellular and organ level are related to the maintenance of the duration of rosette expansion in the shading treatment.
Is the increase in duration of individual leaf expansion a benefit in terms of carbon gain?
At the scale of the individual leaf, the period of leaf heterotrophy and the cell division period have been shown to coincide (Larson and Dickson, 1973; Turgeon and Webb, 1973; Turgeon, 1989). As the duration of cell division is increased by the shading treatment, the present results could suggest that A. thaliana leaves grown under the shading treatment are a carbon-sink for a longer time than those grown under the higher light intensity. After this heterotrophy period, cell division ceases, cells expand, the leaf actively photosynthesises and eventually becomes a source of carbon and developmental cues for the rest of the plant. After a certain time leaf senescence occurs; leaf yellowing was delayed by the shading treatment used in the present study (data not shown).
At the scale of the whole plant, carbon gain is determined by the photosynthetic rate, the total leaf area and the leaf lifespan. Both photosynthesis per unit leaf area and leaf area were reduced by the shading treatment, by 50 % and 80 %, respectively. This would have a dramatic effect on carbon gain at the whole plant level. The leaf lifespan was not directly measured in the present study but there is some evidence that it is extended by shading in many species (as reviewed by Hikosaka, 2005) and by the delayed yellowing of leaves in the present experiments (data not shown). So to some extent, the increase in duration of leaf expansion and in leaf lifespan could provide a sort of compensation for the decrease in photosynthesis and leaf area.
CONCLUSION
Reductions in light intensity are known to affect plant development, e.g. by altering morphogenesis, cell division, leaf expansion and flowering time. However, as far as is known this is the first simultaneous analysis of the effects of reductions in light intensity on the dynamics of plant growth at the cellular, leaf and whole plant levels. This has allowed an integrated view to be taken of these changes which appear to be mainly controlled by a whole plant control system as the duration of rosette area expansion was maintained (despite a considerable reduction in leaf number and plant growth rates). The molecular and biochemical bases of co-ordination between the three levels of growth organization: cell/organ/plant is not known but could be related to the carbon control of cell division and expansion in young leaves (Dale, 1976). Regulation by whole plant signals is also suggested by the observations that the light-controlled histological differentation of sun or shade leaves and stomatal index are sensed by mature leaves (Lake et al., 2001; Yano and Terashima, 2001).
Acknowledgments
This work was funded by the European Community Human Potential Program (HPRN-CT-2002-00267) as part of the DAGOLIGN (Development and Growth of Leaves: Identification of Genetic Networks) Research Training Network. We thank A. Christophe and D. Combes for determining the light quality and M. Dauzat for help with the photosynthetic rate measurements.
LITERATURE CITED
- Aguirrezabal LAN, Tardieu F. 1996. An architectural analysis of the elongation of field-grown sunflower root systems: elements for modelling the effects of temperature and intercepted radiation. Journal of Experimental Botany 47: 411–420. [Google Scholar]
- Ben Haj Salah H, Tardieu F. 1995. Temperature affects leaf expansion rate of maize without change in spatial distribution of cell length. Analysis of the coordination between cell division and cell expansion. Plant Physiology 109: 861–870. [DOI] [PMC free article] [PubMed] [Google Scholar]
- Ben Haj Salah H, Tardieu F. 1996. Quantitative analysis of the combined effects of temperature, evaporative demand and light on leaf elongation rate in well-watered field and laboratory-grown maize plants. Journal of Experimental Botany 47: 1689–1698. [Google Scholar]
- Botto JF, Smith H. 2002. Differential genetic variation in adaptive strategies to a common environmental signal in Arabidopsis accessions: phytochrome-mediated shade avoidance. Plant, Cell and Environment 25: 53–63. [Google Scholar]
- Casal JJ. 2000. Phytochromes, cryptochromes, phototropin: photoreceptor interactions in plants. Photochemical and Photobiological Sciences 71: 1–11. [DOI] [PubMed] [Google Scholar]
- Chen M, Chory J, Fankhauser C. 2004. Light signal transduction in higher plants. Annual Review of Genetics 38: 87–117. [DOI] [PubMed] [Google Scholar]
- Chory J. 1997. Light modulation of vegetative development. Plant Cell 9: 1225–1234. [DOI] [PMC free article] [PubMed] [Google Scholar]
- Cookson SJ, Van Lijsebettens M, Granier C. 2005. Correlation between leaf growth variables suggest intrinsic and early controls of leaf size in Arabidopsis thaliana. Plant, Cell and Environment 28: 1355–1366. [Google Scholar]
- Dale JE. 1976. Cell division in leaves. In: Yeoman MM, ed. Cell division in higher plants. London: Academic Press, 315–45.
- Dengler NG. 1980. Comparative histological basis of sun and shade leaf dimorphism in Helianthus annuus. Canadian Journal of Botany 58: 717–730. [Google Scholar]
- Fleming AJ. 2002. The mechanism of leaf morphogenesis. Planta 216: 17–22. [DOI] [PubMed] [Google Scholar]
- Franklin KA, Whitelam GC. 2005. Phytochromes and shade-avoidance responses in plants. Annals of Botany 96: 169–175. [DOI] [PMC free article] [PubMed] [Google Scholar]
- Freixes S, Thibaud MC, Tardieu F, Muller B. 2002. Root elongation and branching is related to local hexose concentration in Arabidopsis thaliana seedlings. Plant, Cell and Environment 25: 1357–1366. [Google Scholar]
- Gautier H, Mech R, Prusinkiewicz P, Varlet-Grancher C. 2000. 3D architectural modelling of aerial photomorphogenesis in white clover (Trifolium repens L.) using 1-systems. Annals of Botany 85: 359–370. [Google Scholar]
- Granier C, Tardieu F. 1998. Is thermal time adequate for expressing the effects of temperature on sunflower leaf development? Plant, Cell and Environment 21: 695–703. [Google Scholar]
- Granier C, Tardieu F. 1999a. Leaf expansion and cell division are affected by reducing absorbed light before but not after the decline in cell division rate in sunflower leaves. Plant, Cell and Environment 22: 1365–1376. [Google Scholar]
- Granier C, Tardieu F. 1999b. Water deficit and spatial pattern of leaf development. Variability in responses can be simulated using a simple model of leaf development. Plant Physiology 119: 609–620. [DOI] [PMC free article] [PubMed] [Google Scholar]
- Granier C, Turc O, Tardieu F. 2000. Co-ordination of cell division and tissue expansion in sunflower, tobacco and pea leaves. Dependence or independence of both processes? Journal of Plant Growth Regulation 19: 45–54. [DOI] [PubMed] [Google Scholar]
- Granier C, Massonnet C, Turc O, Muller B, Chenu K, Tardieu F. 2002. Individual leaf development in Arabidopsis thaliana: a stable thermal-time-based programme. Annals of Botany 89: 595–604. [DOI] [PMC free article] [PubMed] [Google Scholar]
- Green P. 1976. Growth and cell pattern formation on an axis: critique of concepts, terminology and modes of study. Botanical Gazette 137: 187–202. [Google Scholar]
- Haber AH, Foard DE. 1963. Nonessentiality of concurrent cell divisions for degree of polarization of leaf growth. II. Evidence from untreated plants and from chemically induced changes of the degree of polarization. American Journal of Botany 50: 937–944. [Google Scholar]
- Hemerly A, de Almeida Engler J, Bergounioux C, Van Montagu M, Engler G, Inzé D Ferreira P. 1995. Dominant negative mutants of the Cdc2 kinase uncouple cell division from iterative plant development. EMBO Journal 14: 3925–3936. [DOI] [PMC free article] [PubMed] [Google Scholar]
- Hikosaka K. 2005. Leaf canopy as a dynamic system: ecophysiology and optimality in leaf turnover. Annals of Botany 95: 521–533. [DOI] [PMC free article] [PubMed] [Google Scholar]
- Hoagland DR, Arnon DI. 1950. The water culture method for growing plants without soil. Califorian Agricultural Experimental Station Circular No. 347: 1–32.
- Kim GT, Yano S, Kozuka T, Tsukaya H. 2005. Photomorphogenesis of leaves: shade-avoidance and differentiation of sun and shade leaves. Photochemical and Photobiological Sciences 4: 770–774. [DOI] [PubMed] [Google Scholar]
- Kozuka T, Horiguchi G, Kim GT, Ohgishi M, Sakai T, Tsukaya H. 2005. The different growth responses of the Arabidopsis thaliana leaf blade and the petiole during shade avoidance are regulated by photoreceptors and sugar. Plant and Cell Physiology 46: 213–223. [DOI] [PubMed] [Google Scholar]
- Lafarge T, Tardieu F. 2002. A model co-ordinating the elongation of all leaves of a sorghum cultivar was applied to both Mediterranean and Sahelian conditions. Journal of Experimental Botany 53: 715–725. [DOI] [PubMed] [Google Scholar]
- Lafarge T, de Raïssac M, Tardieu F. 1998. Elongation rate of sorghum leaves has a common response to meristem temperature in diverse African and European conditions. Field Crops Research 58: 69–79. [Google Scholar]
- Lake J, Beerling DJ, Woodward FI, Quick WP. 2001. Environmental control of stomatal density. Nature 411: 154–155. [DOI] [PubMed] [Google Scholar]
- Larson PR, Dickson RE. 1973. Distribution of imported C in developing leaves of eastern cottonwood according to phyllotaxy. Planta 111: 95–112. [DOI] [PubMed] [Google Scholar]
- Lee DW, Oberbauer SF, Johnson P, Krishnapilay B, Mansor M, Mohamad H, et al. 2000. Effects of irradiance and spectral quality on leaf structure and function in seedlings of two Southeast Asian Hopea (Dipterocarpaceae) species. American Journal of Botany 87: 447–455. [PubMed] [Google Scholar]
- Lichtenthaler HK. 1983. Differences in morphology and chemical composition of leaves grown at different light intensities and qualities. In: Baker NR, Davies WJ, Ong CK, eds. Control of leaf growth. Cambridge: Cambridge University Press, 201–221.
- Muller B, Stosser M, Tardieu F. 1998. Spatial distributions of tissue expansion and cell division rates are related to PPFD and to sugar content in the growing zone of maize roots. Plant, Cell and Environment 21: 149–158. [Google Scholar]
- Newton P. 1963. Studies on the expansion of the leaf surface. II. The influence of light intensity and daylength. Journal of Experimental Botany 14: 458–482. [Google Scholar]
- Pigliucci M, Kolodynska A. 2002. Phenotypic plasticity to light intensity in Arabidopsis thaliana: invariance of reaction norms and phenotypic integration. Evolutionary Ecology 16: 27–42. [Google Scholar]
- Rawson HM, Dunstone RL. 1986. Simple relationships describing the responses of leaf growth to temperature and radiation in sunflower. Australian Journal of Plant Physiology 13: 321–327. [Google Scholar]
- Rawson HM, Turner NC. 1982. Recovery from water stress in five sunflower (Helianthus annuus L.) cultivars. I. Effects of the timing of water application on leaf area and seed production. Australian Journal of Plant Physiology 9: 437–448. [Google Scholar]
- Schnyder H, Nelson CJ. 1988. Diurnal distribution of tall fescue leaf blades. I. Spatial distribution of growth, deposition of water, and assimilate import in the elongation zone. Plant Physiology 86: 1070–1076. [DOI] [PMC free article] [PubMed] [Google Scholar]
- Setter TL, Flannigan BA, Melkonian J. 2001. Loss of kernel set due to water deficit and shade in maize: Carbohydrate supplies, abscisic acid, and cytokinins. Crop Sciences 41: 1530–1540. [Google Scholar]
- Steinger T, Roy BA, Stanton ML. 2003. Evolution in stressful environments. II. Adaptive value and costs of plasticity in response to low light in Sinapis arvensis. Journal of Evolutionary Biology 16: 313–323. [DOI] [PubMed] [Google Scholar]
- Torres M, Frutos G. 1989. Analysis of germination curves of aged fennel seeds by mathematical models. Environmental and Experimental Botany 29: 409–415. [Google Scholar]
- Turgeon R. 1989. The sink-source transition in leaves. Annual Review of Plant Physiology and Plant Molecular Biology 40: 119–138. [Google Scholar]
- Turgeon R, Webb JA. 1973. Leaf development and phloem transport in Cucurbita pepo: transition from import to export. Planta 113: 179–191. [DOI] [PubMed] [Google Scholar]
- Tsukaya H. 2002. Interpretation of mutants in leaf morphology: genetic evidence for a compensatory system in leaf morphogenesis that provides a new link between cell and organismal theories. International Review of Cytology 217: 1–39. [DOI] [PubMed] [Google Scholar]
- Tsukaya H. 2003. Organ shape and size: a lesson from studies of leaf morphogenesis. Current Opinion in Plant Biology 6: 57–62. [DOI] [PubMed] [Google Scholar]
- Volenec JJ, Nelson CJ. 1982. Diurnal leaf elongation of contrasting tall fescue genotypes. Crop Science 22: 531–535. [Google Scholar]
- Wilson GL. 1966. Studies on the expansion of the leaf surface. V. Cell division and expansion in a developing leaf as influenced by light and upper leaves. Journal of Experimental Botany 17: 440–451. [Google Scholar]
- Yano S, Terashima I. 2001. Separate localization of light signal perception for sun and shade type chloroplast and palisade tissue differentation in Chenopodium album L. Plant and Cell Physiology 42: 1303–1310. [DOI] [PubMed] [Google Scholar]
- Yano S, Terashima I. 2004. Developmental process of sun and shade leaves in Chenopodium album L. Plant, Cell and Environment 27: 781–793. [Google Scholar]
- Yegappan TM, Paton DM, Gates CT, Müller WJ. 1980. Water stress in sunflower (Helianthus annuus L.). 1. Effect on plant development. Annals of Botany 46: 61–70. [Google Scholar]