Abstract
• Background and Aims Influences of rising global CO2 concentration and temperature on plant growth and ecosystem function have become major concerns, but how photosynthesis changes with CO2 and temperature in the field is poorly understood. Therefore, studies were made of the effect of elevated CO2 on temperature dependence of photosynthetic rates in rice (Oryza sativa) grown in a paddy field, in relation to seasons in two years.
• Methods Photosynthetic rates were determined monthly for rice grown under free-air CO2 enrichment (FACE) compared to the normal atmosphere (570 vs 370 µmol mol−1). Temperature dependence of the maximum rate of RuBP (ribulose-1,5-bisphosphate) carboxylation (Vcmax) and the maximum rate of electron transport (Jmax) were analysed with the Arrhenius equation. The photosynthesis–temperature response was reconstructed to determine the optimal temperature (Topt) that maximizes the photosynthetic rate.
• Key Results and Conclusions There was both an increase in the absolute value of the light-saturated photosynthetic rate at growth CO2 (Pgrowth) and an increase in Topt for Pgrowth caused by elevated CO2 in FACE conditions. Seasonal decrease in Pgrowth was associated with a decrease in nitrogen content per unit leaf area (Narea) and thus in the maximum rate of electron transport (Jmax) and the maximum rate of RuBP carboxylation (Vcmax). At ambient CO2, Topt increased with increasing growth temperature due mainly to increasing activation energy of Vcmax. At elevated CO2, Topt did not show a clear seasonal trend. Temperature dependence of photosynthesis was changed by seasonal climate and plant nitrogen status, which differed between ambient and elevated CO2.
Keywords: Temperature dependence, photosynthesis, optimal temperature, activation energy, limiting step, temperature acclimation, free-air CO2 enrichment (FACE), seasonal change, rice, Oryza sativa
INTRODUCTION
Global atmospheric CO2 concentration has risen from approx. 280 µmol mol−1 in pre-industrial times to approx. 370 µmol mol−1 now and may reach 570 µmol mol−1 by 2050. Most global climate models predict that global surface temperature will increase by 3 °C, associated with increasing greenhouse gas emissions (IPCC, 2001). Influences of increasing CO2 and temperature on plant growth and ecosystem function have become a major area of concern in recent decades (Mitchell et al., 1995; Norby and Luo, 2004).
Photosynthesis, a key determinant of the rate of plant growth, is influenced by both CO2 and temperature. Photosynthetic rates increase with a short-term increase in CO2 concentration and are related parabolically to leaf temperature (von Caemmerer, 2000). These responses are mechanistically described by the biochemical model of photosynthesis (Farquhar et al., 1980). The model has two major parameters, the potential rate of electron transport (Jmax) and the maximum rate of RuBP (ribulose-1,5-bisphosphate) carboxylation (Vcmax).
The model of Farquhar et al. (1980) has contributed substantially to modelling gas exchange rates of plants and terrestrial ecosystems under changing environments. However, many modelling studies have ignored the effects of growth conditions on photosynthetic characteristics (long-term response). Photosynthesis often shows down-regulation under a long-term increase in CO2 concentration (CO2 acclimation; Sage, 1994; Ziska et al., 1996; Seneweera et al., 2002; Ainsworth et al., 2003; Chen et al., 2005). In many species, a long-term increase in temperature leads to an increase in the optimal temperature for maximal photosynthetic rate (temperature acclimation; Slatyer et al., 1977; Berry and Björkman, 1980; Badger et al., 1982; Ferrar et al., 1989; Hikosaka et al., 1999; Hikosaka et al., 2006). Some recent studies have investigated responses in Vcmax and Jmax to growth temperature (Hikosaka et al., 1999; Bunce, 2000; Hikosaka, 2005; Yamori et al., 2005) and to seasonal environment (Medlyn et al., 2002a; Han et al., 2004; Onoda et al., 2005b). However, no study, as far as we know, has investigated seasonal change in temperature dependence of Vcmax and Jmax under elevated CO2 concentrations. We have investigated the effects on photosynthetic rate and seasonal acclimation of rice leaves grown in the field under current and increased CO2 concentrations.
Field-grown plants were exposed to natural diurnal, seasonal and year-to-year fluctuations in leaf temperature in a free-air CO2 enrichment (FACE) system that raises atmospheric CO2 concentration in the field with minimal artefacts (Long et al., 2004). Seasonal changes in photosynthetic characteristics were measured for two seasons. Temperature dependence of photosynthetic rates were analysed based on the model of Farquhar et al. (1980). Questions addressed here are: (1) does temperature dependence of photosynthesis change seasonally and, if so, how different is it between ambient and elevated CO2? (2) What biochemical mechanisms are involved in the change in temperature dependence of photosynthesis? (3) Does growth temperature explain the seasonal change in the photosynthetic characteristics?
MATERIALS AND METHODS
The rice field was located at Shizukuishi in northern Honshu, Japan (39°38′N, 140°57′E, 200 m a.s.l.). Mean annual temperature and precipitation in 1976–2004 were 9·3 °C and 1540 mm, respectively. Elevated atmospheric CO2 concentration (Ca) was created with a FACE system (Okada et al., 2001), consisting of octagonal 12-m diameter CO2 emission structures (‘rings’) established within the paddy. The target Ca at the centre of the rings was 200 µmol mol−1 above ambient CO2. The experiment was conducted over two years (2003 and 2004). The seasonal averages of Ca in the ambient CO2 plots and in the elevated CO2 plots were 384 ± 14 and 606 ± 29 µmol mol−1 in 2003, and 366 ± 12 and 548 ± 28 µmol mol−1 in 2004, respectively. Two ambient CO2 (X and Z) and two elevated CO2 plots (B and D) were used (for description of these plots see Okada et al., 2001). Mean temperature and photosynthetic photon flux (PPF) during the experiment are shown in Table 1.
Table 1.
Climate conditions and leaf characteristics (order and age) for the photosynthetic measurements
| Year | Measurement date | Tg (°C) | PPF (mol m−2 d−1) | Leaf order | Mean leaf age (d) |
|---|---|---|---|---|---|
| 2003 | 18–24 June | 17·7 | 34·9 | 8th | 13 |
| 15–25 July | 18·5 | 25·3 | 11th | 18 | |
| 20–30 August | 20·9 | 23·7 | 14th | 17 | |
| 11–15 September | 19·1 | 22·0 | 15th | 40 | |
| 2004 | 23–28 June | 18·1 | 36·9 | 9th | 15 |
| 21–26 July | 21·7 | 22·6 | 12th | 14 | |
| 21–23 August | 21·9 | 31·3 | 13th | 16 | |
| 14–18 September | 19·7 | 24·9 | 14th | 31 |
Tg and PPF are the mean daily growth temperature and mean daily photosynthetic photon flux, respectively, in the 2 weeks prior to measurements. Leaf order was numbered from the first leaf after germination.
Rice (Oryza sativa L. ‘Akitakomachi’) plants were grown following the agronomic techniques typical of the local area (Kobayashi et al., 2001; Anten et al., 2003; Kim et al., 2003). On 21 May 2003 and 20 May 2004, 25 d after emergence, seedlings were transplanted into paddies. Seedlings raised in a greenhouse under ambient CO2 were planted in the ambient CO2 plots, and those raised in another greenhouse under elevated CO2 were planted in the elevated CO2 plots. Distances between plants (‘hills’) and rows were 17·5 and 30 cm, respectively (equivalent to 19·1 hills m−2). The amounts of fertilizers added were: 8 g N m−2 (25 % ammonium sulfate and 75 % LP-70) on 16 May in both 2003 and 2004, 30 g P2O5 m−2 on 24 April 2003 and 19 April 2004, 15 g K2O m−2 on 25 April 2003 and 19 April 2004, respectively.
Photosynthetic measurements were made on the most recently fully expanded leaves in the experimental periods (leaf order and leaf age after emergence are given in Table 1). Photosynthetic rates were measured using an open gas exchange system (Model LI-6400, LiCor Inc., Lincoln, NE, USA), with an LED light source (LI-6400-02B, LiCor) and a dual Peltier device to regulate the PPF and temperature in the chamber (3 × 2 cm2).
Measurements were replicated using at least three leaves in each plot. CO2 response curves of photosynthesis were determined at approx. 20, 25, 30 and 35 °C leaf temperature at PPF >1800 µmol m−2 s−1. The vapour pressure deficit (VPD) was kept at <1·5 kPa for 15–30 °C, and 1·5–2·5 kPa for 35 °C. Leaves were allowed to equilibrate for 5–10 min at each new temperature before measurement. For each CO2 response curve, photosynthesis was first measured at the growth CO2 concentration (ambient CO2, 370 µmol mol−1 or elevated CO2, 570 µmol mol−1; Pgrowth), and then the Ca was increased in eight steps from 50 to 1500 µmol mol−1. In moving to a new CO2 concentration, sufficient time was given (>5 min) to allow a steady-state to be attained prior to measurement of the photosynthetic rate. Immediately after gas exchange measurements were completed, the leaf was detached and 3-cm-long segments were excised (excluding the tip and base) and their width measured for calculation of area with an absolute digimatic caliper (Mitutoyo, CD-S15C, Kanagawa, Japan). The dry mass of leaf segments was determined after oven-drying at 70 °C for >72 h, and then the nitrogen content was determined using an NC analyser (Sumigraph NC-80,Shimadzu, Kyoto, Japan).
Models
The photosynthesis curve plotted against intercellular CO2 concentration (A–Ci curve) was analysed to determine the maximum rate of RuBP carboxylation (Vcmax) and the maximum rate of electron transport (Jmax) using the biochemical model of photosynthesis (Farquhar et al., 1980). When ribulose-1,5-bisphosphate (RuBP) is saturated, the photosynthetic rate is determined by:
 |
(1) |
where Pc is the photosynthetic rate limited by the Rubisco activity, Ci is the concentration of CO2 at intercellular space, Γ* is the CO2 compensation point in the absence of day respiration (Rd), Kc and Ko are Michaelis constants of RuBP carboxylase for CO2 and O2, respectively, and O is the O2 concentration. When RuBP regeneration limits photosynthesis, the photosynthetic rate is expressed as:
 |
(2) |
where Pr is the photosynthetic rate limited by RuBP regeneration. The photosynthetic rate is the minimum of Pc and Pr.
The temperature dependence of kinetic parameters is described by the Arrhenius equation (Harley and Tenhunen, 1991; Bernacchi et al., 2001):
 |
(3) |
where fis the value of a parameter. f(25) is f at 25 °C, Ea is the activation energy, R is the gas constant (8·314 J mol−1 K−1) and Tk is leaf temperature in K.
We calculated values of Kc using eqn (3), where Kc at 25 °C and Ea of Kc were assumed to be 404·9 µmol mol−1 and 79·43 kJ mol−1, respectively. Similarly, Ko and Γ* values were calculated assuming that Ko and Γ* at 25 °C were 278·4 mmol mol−1 and 42·8 µmol mol−1, and Ea of Ko and Ea of Γ* were 36·38 kJ mol−1 and 37·83 kJ mol−1, respectively (Bernacchi et al., 2001). Using the calculated Kc, Ko and Γ* values, eqn (1) was fitted to the Ci-response curves of photosynthesis at a lower range of CO2 (Ci < 300 µmol mol−1). Rd was assumed to be 0·02 of Vcmax (von Caemmerer, 2000). Jmax was calculated by fitting eqn (2) to a higher range of CO2 (Ci > 600 µmol mol−1). Ea of Vcmax and of Jmax were obtained from pooled data for each plot as a regression coefficient (eqn 3). Curve fitting was performed with Kaleida graph (Synergy Software, Reading, PA, USA).
Statistical analysis
Data are presented as means ± s.e. Statistical tests were performed using SPSS 7·5·1 statistical software (SPSS Inc., Chicago, IL, USA). ANOVA (split-plot) was conducted to test the effects of year (main plot), CO2 (subplot), months (sub-subplot) and their interactions on photosynthetic characteristics. Student's t-test was used for the effect of the CO2 treatments.
RESULTS
The mean daily temperature (Tg) and mean daily PPF during a 2-week period prior to each measurement (Table 1) are considered as the ‘growth environment’ for the leaves; they varied seasonally. Tg was highest in August and lowest in June in both 2003 and 2004. When compared for the same month, Tg was slightly higher in 2004. PPF was highest in June and lowest in September in 2003 and in July in 2004.
Effects of elevated CO2 and seasonal environment on photosynthetic characteristics
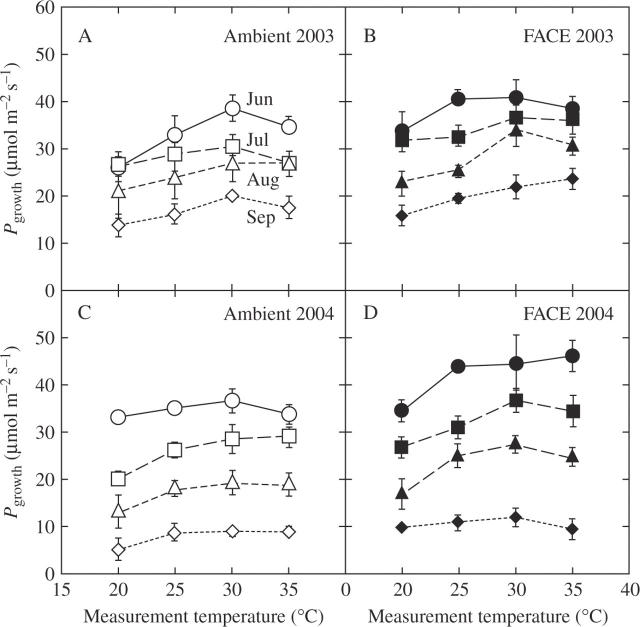
Seasonal changes in temperature dependence of the light-saturated photosynthetic rates per unit leaf area (Pgrowth) determined at the growth CO2 concentration (Fig. 1) tended to increase to a maximum with increasing leaf temperature, and then either remained constant or decreased with further increase in leaf temperature. At any given temperature and month, Pgrowth was higher in leaves grown at elevated CO2. Pgrowth decreased as the growing season progressed (Table 2).
Fig. 1.
Temperature dependence of the light-saturated rate of photosynthesis (Pgrowth) for rice (Oryza sativa) grown at (A, C) ambient CO2 (370 µmol mol−1, open symbols) and (B, D) at elevated CO2 (570 µmol mol−1, closed symbols) in 2003 (A, B) and 2004 (C, D). Measurements were made in June (circles), July (squares), August (triangles) and September (diamonds). Data from two plots are pooled and presented as mean ± s.e. (n = 6).
Table 2.
Summary of analysis of variance (ANOVA, presented as F-values) for the effects of month, CO2, year, and their interactions on the photosynthetic rate at 25 °C under growth CO2 concentration (Pgrowth25), leaf nitrogen content (Narea), stomatal conductance at 25°C (gs), intercellular CO2 concentration at 25 °C (Ci), the maximum rate of electron transport at 25 °C (Jmax25), the maximum rate of RuBP carboxylation at 25 °C (Vcmax25), the Jmax to Vcmax ratio at 25 °C (J/V), activation energy of Jmax (Eaj), activation energy of Vcmax (Eav), and optimum temperature of photosynthesis predicted by the model (Topt)
| Source of variation | d.f. | Pgrowth25 | Narea | gs | Ci | Jmax25 | Vcmax25 | J/V | Eaj | Eav | Topt |
|---|---|---|---|---|---|---|---|---|---|---|---|
| Year | 1 | 10·11 | 0·23 | 19·92* | 39·51* | 22·58* | 14·45 | 7·06 | 0·22 | 2·03 | 13·44 |
| Main plot error | 2 | 11·74 | 2·75 | 6·56 | 1·48 | 2·67 | 7·10 | 0·59 | 1·08 | 3·08 | 1·44 |
| CO2 | 1 | 462·73** | 4·88 | 25·45* | 1215·25*** | 3·19 | 26·71* | 3·72 | 11·16 | 4·01 | 78·87* |
| CO2 × Year | 1 | 17·19 | 0·41 | 12·83 | 5·44 | 0·19 | 7·61 | 1·88 | 0·46 | 5·11 | 4·16 |
| Subplot error | 2 | 0·10 | 2·28 | 0·18 | 1·72 | 0·83 | 0·49 | 1·25 | 0·97 | 0·73 | 0·80 |
| Month | 3 | 216·26*** | 175·72*** | 4·09* | 19·87*** | 229·24*** | 307·07*** | 22·33*** | 0·83 | 6·41** | 3·74* |
| Month × CO2 | 3 | 3·50* | 6·72** | 0·54 | 1·61 | 1·93 | 2·89 | 0·23 | 0·65 | 0·28 | 1·34 |
| Month × Year | 3 | 11·01*** | 18·63*** | 4·64* | 3·21 | 6·56** | 7·91** | 2·22 | 1·79 | 5·10* | 5·66* |
| CO2 × Month × Year | 3 | 1·03 | 0·26 | 0·68 | 0·59 | 0·86 | 1·88 | 0·41 | 7·71** | 10·33** | 5·27* |
| Sub-subplot error | 12 |
Pgrowth25, Narea, gs and Ci are measured values. Jmax25, Vcmax25, J/V, Eaj, Eav and Topt are calculated values. Significance levels: ***, P < 0·001; **, P < 0·01; *, P < 0·05.
Stomatal conductance (gs), determined at 25 °C, was lower in leaves grown at elevated CO2 (Tables 2, 3). It differed significantly between months, although no seasonal trend was observed. The average intercellular CO2 concentration (Ci) at 25 °C was 79·9 % of Ca at ambient CO2 and 80·7 % of Ca at elevated CO2, and increased during the growing season in both ambient and elevated CO2 (Tables 2, 3). Leaf nitrogen content per unit area (Narea) was not affected by CO2 during growth, but declined during the growing season irrespective of CO2 treatment (Tables 2, 3).
Table 3.
Stomatal conductance for water vapour (gs) and intercellular CO2 concentration (Ci) at 25 °C under growth CO2 concentration, and leaf nitrogen content per unit area (Narea) for rice grown at ambient CO2 (370 µmol mol−1) and at elevated CO2 (570 µmol mol−1)
|
gs (mol m−2 s−1) |
Ci (µmol mol−1) |
Narea (g m−2) |
|||||
|---|---|---|---|---|---|---|---|
| Year | Measurement date | Ambient | FACE | Ambient | FACE | Ambient | FACE |
| 2003 | 18–24 June | 0·23 ± 0·05 | 0·23 ± 0·07 | 268 ± 16 | 435 ± 30*** | 1·91 ± 0·26 | 1·95 ± 0·17 |
| 15–25 July | 0·27 ± 0·09 | 0·16 ± 0·03* | 283 ± 13 | 420 ± 15*** | 1·89 ± 0·19 | 1·78 ± 0·14 | |
| 20–30 August | 0·28 ± 0·07 | 0·18 ± 0·03** | 282 ± 12 | 441 ± 20*** | 2·12 ± 0·18 | 1·73 ± 0·14** | |
| 11–15 September | 0·27 ± 0·09 | 0·20 ± 0·07 | 298 ± 17 | 449 ± 30*** | 1·33 ± 0·07 | 1·25 ± 0·12 | |
| 2004 | 23–28 June | 0·34 ± 0·05 | 0·32 ± 0·04 | 292 ± 3 | 464 ± 9*** | 2·17 ± 0·17 | 2·18 ± 0·11 |
| 21–26 July | 0·32 ± 0·06 | 0·30 ± 0·04 | 293 ± 12 | 458 ± 18*** | 1·95 ± 0·23 | 1·94 ± 0·08 | |
| 21–23 August | 0·41 ± 0·07 | 0·44 ± 0·10 | 318 ± 4 | 499 ± 10*** | 1·88 ± 0·10 | 1·60 ± 0·15** | |
| 14–18 September | 0·25 ± 0·03 | 0·20 ± 0·03* | 329 ± 6 | 509 ± 11*** | 0·97 ± 0·08 | 0·96 ± 0·06 | |
Means ± s.e. (n = 6) are shown. Asterisks indicate significant differences between CO2 treatments: ***, P < 0·0001; **, P < 0·01; *, P < 0·05.
Jmax and Vcmax determined at 25 °C (Jmax25 and Vcmax25, respectively) decreased during the season (Fig. 2A–D). Since the decrease in Vcmax25 was greater than that in Jmax25, the Jmax/Vcmax ratio increased (Fig. 2E, F). There was a significant effect of CO2 on Vcmax25 (Table 2), but was not on Jmax25. Vcmax25 tended to be lower at elevated CO2 (Fig. 2C, D).
Fig. 2.
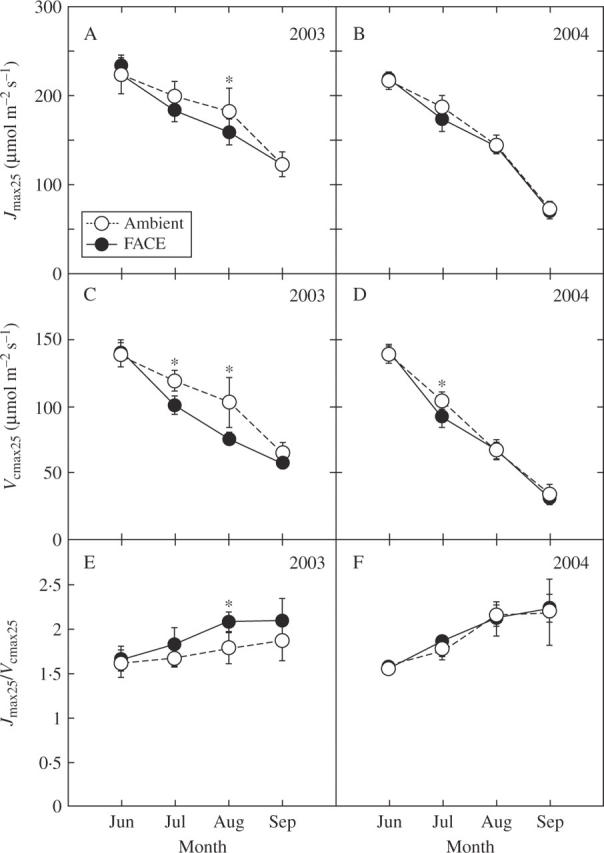
Seasonal change in (A, B) the maximum rate of electron transport (Jmax25), (C, D) the maximum rate of caboxylation (Vcmax25), and (E, F) the Jmax25/Vcmax25 ratio at 25 °C for rice (Oryza sativa) grown at ambient CO2 (370 µmol mol−1, open symbols) and at elevated CO2 (570 µmol mol−1, closed symbols) in 2003 (A, C, E) and 2004 (B, D, F). Data from two plots are pooled and shown as mean ± s.e. (n = 6). Asterisks indicate significant differences between CO2 treatments at P < 0·05.
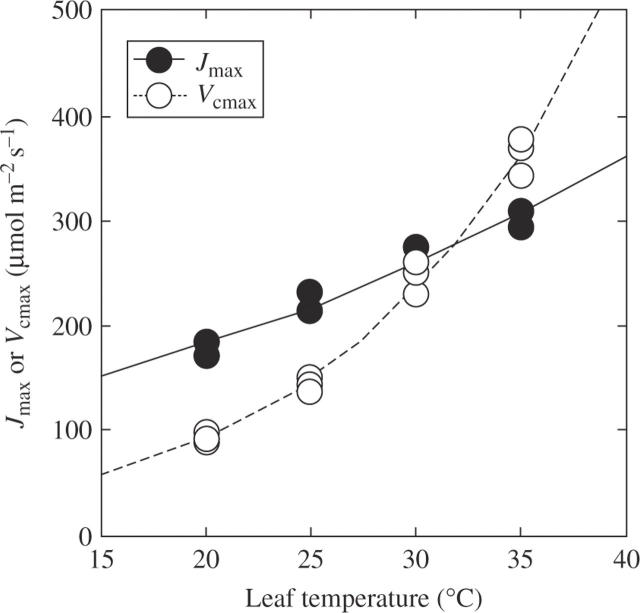
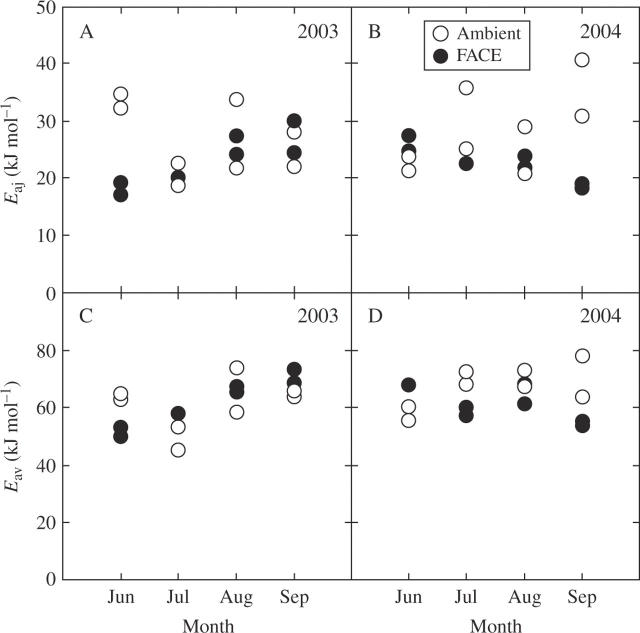
Jmax and Vcmax increased exponentially with leaf temperature: an example is shown in Fig. 3, with the curve fitted using the Arrhenius equation. The activation energy (Ea) is a measure of temperature dependence of photosynthetic rate. Since deactivation at high temperatures was not observed for either Jmax or Vcmax, we did not use a model characterized by an optimum (peak) (Medlyn et al., 2002a, b). ANOVA suggested that the activation energy of Jmax (Eaj) was not different between leaves grown in different CO2 concentrations (Table 2). However, the seasonal change in Eaj was not consistent across years and CO2 conditions (Fig. 4). For example, at elevated CO2, Eaj increased seasonally in 2003 (P = 0·004, Fig. 4A), while it decreased in 2004 (P = 0·003, Fig. 4B). Eav was not affected by growth CO2 but was significantly different among months (Table 2, Fig. 4C, D).
Fig. 3.
An example of the temperature dependence of the maximum rate of electron transport (Jmax) and the maximum rate of caboxylation (Vcmax) of rice (Oryza sativa) grown at elevated CO2 (570 µmol mol−1) in June 2004. Data are fitted with the Arrhenius equation (eqn. 3). Activation energy of Jmax (Eaj) was 19·42 kJ mol−1 and activation energy of Vcmax (Eav) was 52·93 kJ mol−1.
Fig. 4.
(A, B) Seasonal change in the activation energy of Jmax (Eaj), and (C, D) activation energy of Vcmax (Eav) for rice grown at ambient CO2 (370 µmol mol−1) and at elevated CO2 (570 µmol mol−1) in 2003 (A, C) and 2004 (B, D). One point denotes one plot.
Modelling of temperature dependence of photosynthetic rate at growth CO2 conditions
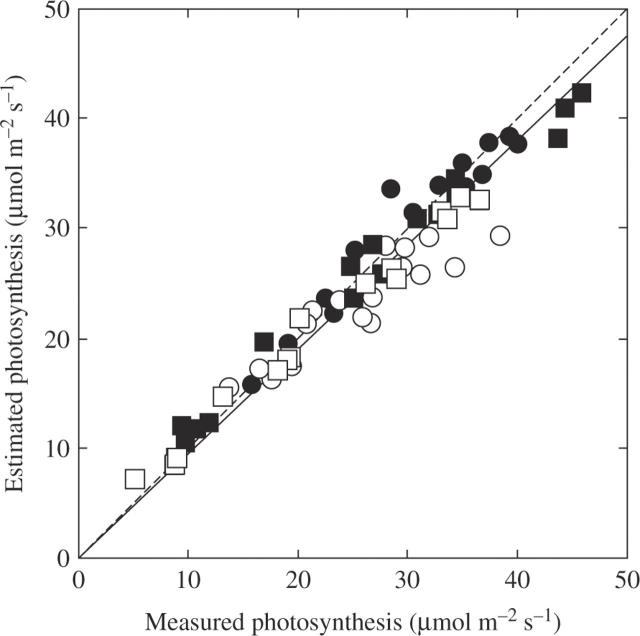
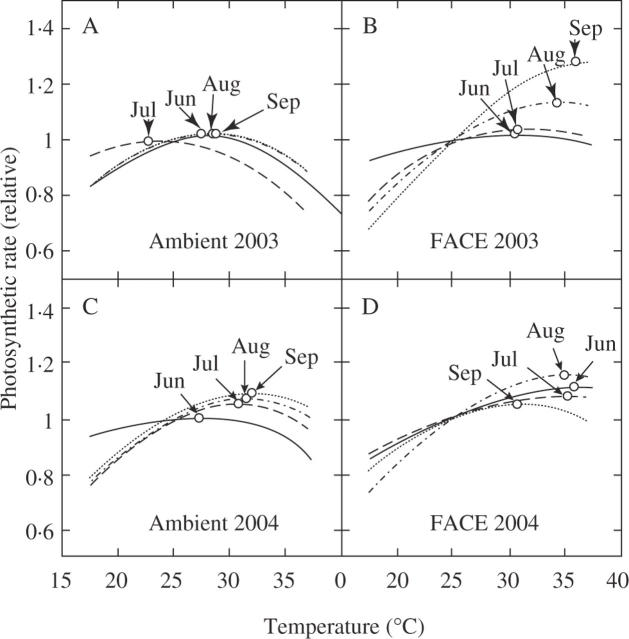
Using the above parameters Ci, Jmax, Vcmax, Eaj and Eav, we reconstructed the temperature dependence of photosynthetic rate at the CO2 concentrations during leaf growth. There was a strong correlation between measured and estimated rates of photosynthesis (y = 0·95x; r = 0·97, P < 0·0001) with the regression was very close to the 1 : 1 line (Fig. 5). This indicates that the present photosynthesis model gave a fairly good quantitative description of the effect of years and CO2 on growth. At ambient CO2, photosynthesis at optimal temperature was limited by Pc in both years, while at elevated CO2 photosynthesis at optimal temperature was limited by Pr in earlier stages (June, July and August), and by Pc in the latest stage (September; data not shown). Temperature dependence of (relative) photosynthetic rate differed between ambient and elevated CO2 (Fig. 6). The optimal temperature of photosynthesis (Topt, the value where the photosynthetic rate was maximum) was significantly higher at elevated CO2 (Table 2): it ranged from 22 to 34·5 °C with an average value of 28·9 °C at ambient CO2, and from 29·5 to 37 °C with an average value of 33·5 °C at elevated CO2. Temperature dependence of photosynthesis also showed a large seasonal change. There was a significant effect of month on Topt (Table 2).
Fig. 5.
Comparison between measured and estimated photosynthesis of plants grown at ambient CO2 (370 µmol mol−1, open symbols) and at elevated CO2 (570 µmol mol−1, closed symbols) in 2003 (circles) and 2004 (squares). The solid line is the regression y = 0·95x (r = 0·97, P < 0·0001). The broken line indicates equivalence between measured and estimated photosynthesis.
Fig. 6.
Modelled temperature dependence of photosynthesis at (A, C) ambient CO2 (370 µmol mol−1), and (B, D) elevated CO2 (570 µmol mol−1)in 2003 (A, B) and 2004 (C, D) growing seasons (June, July, August and September). Values are normalized to 1 at 25 °C. Circles indicate the maximum photosynthesis.
Relationship between growth temperature (Tg) and photosynthetic characteristics
There was no significant difference in Eav between leaves grown at the two CO2 concentrations (Table 2). Eav was positively correlated with Tg across both CO2 concentrations (Fig. 7A, P = 0·025). However, Eaj was not correlated with Tg (data not shown). There was a significant correlation between Topt and Tg at ambient CO2 (P = 0·018), but not at elevated CO2 (P = 0·122; Fig. 7B).
Fig. 7.
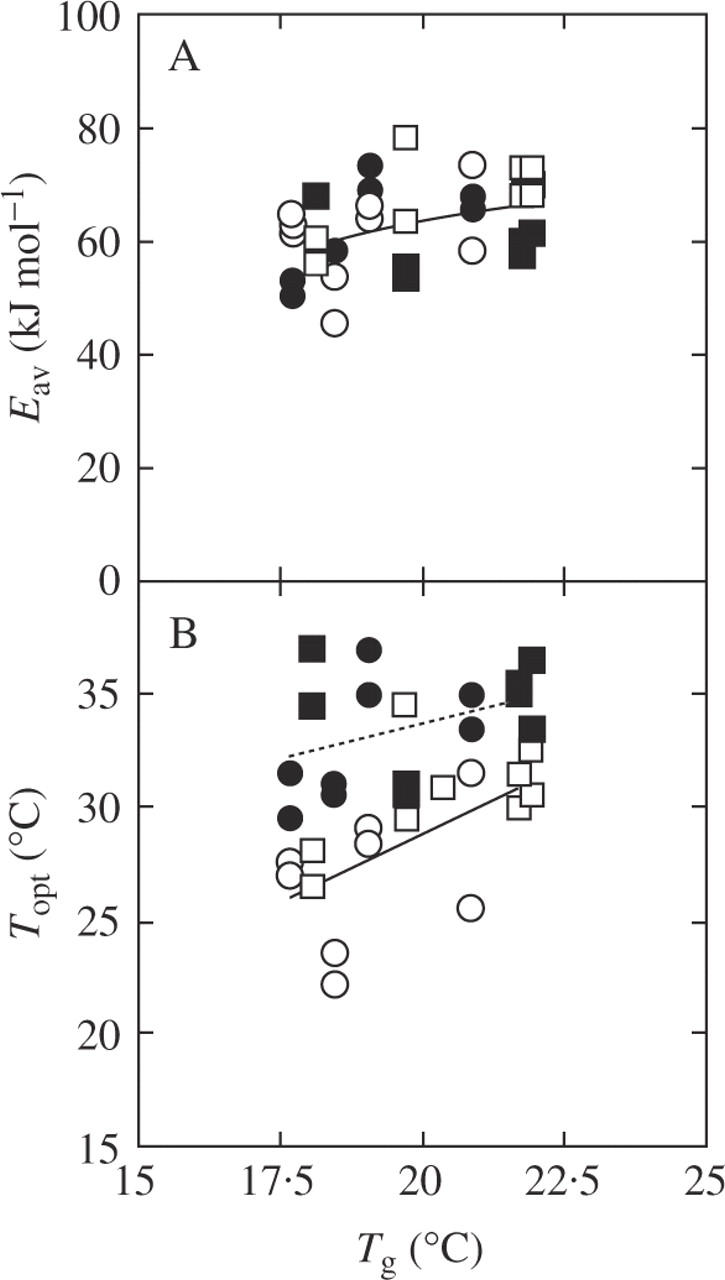
Relationship between growth temperature (Tg, the mean daily temperature in the 2 weeks prior to measurements) and photosynthetic characteristics: (A) activation energy of Vcmax (Eav) and (B) the optimal temperature of photosynthesis at growth CO2 (Topt). Plants were grown at ambient CO2 (370 µmol mol−1, open symbols) and at elevated CO2 (570 µmol mol−1, closed symbols) in 2003 (circles) and 2004 (squares). Regression lines: (A) y = 23·96 + 1·98x (r = 0·40, P = 0·025) and (B) y = 4·86 + 1·21x (r = 0·58 P = 0·018, ambient), and y = 20·92 + 0·64x (r = 0·40, P = 0·122, FACE). One point denotes one plot.
DISCUSSION
The biochemical model of photosynthesis developed by Farquhar et al. (1980) is useful for predicting carbon exchange by plants under global environmental change because it represents a mechanism for the effects of elevated CO2 on photosynthetic rates. The model is also useful for analysing temperature dependence of photosynthesis. As photosynthesis–temperature curves are parabolic with a broad peak, many data points are needed to obtain the optimal temperature (e.g. Cunningham and Read, 2002). However, as most of the parameters in the model of Farquhar et al. (1980) follow the Arrhenius equation, it is possible to describe photosynthetic response to temperature with a relatively small number of data points. The similarity between measured and estimated values (Fig. 5) suggests that the model gave a fairly good quantitative description of photosynthetic rates. Several studies have shown changes in temperature dependence of model parameters (such as Eav and Eaj) under a seasonal environment (Medlyn et al., 2002a; Han et al., 2004), but information is still insufficient when large acclimational change and interspecific differences are considered (Leuning, 2002; Medlyn et al., 2002b). The present study is the first report showing a seasonal change in temperature dependence of photosynthetic parameters at elevated CO2.
Absolute photosynthetic rate (Pgrowth)
Elevated CO2 significantly increased Pgrowth (Fig. 1). This is simply ascribed to higher Ci (Table 3). However, a slight but significant decrease in Vcmax25 at elevated CO2 (Fig. 2, Table 2) partly offset the effect of increased Ci. This down-regulation may be caused by sugar accumulation (Rey and Jarvis, 1998; Seneweera et al., 2002; Rogers et al., 2004) or by accelerated leaf senescence with advanced plant development (Rogers et al., 1996; Ludewing and Sonnewald, 2000; von Caemmerer et al., 2001; Seneweera et al., 2002).
At both CO2 concentrations, Pgrowth25 (Pgrowth at 25 °C) decreased as the plants grew (Fig. 1), consistent with previous studies for rice (Hasegawa et al., 1996 for ambient CO2; Seneweera et al., 2002). This is attributed to the seasonal decrease in Jmax and Vcmax (Fig. 2), which is associated with the reduction in Narea (Table 3). Seasonal reduction in Narea may be related to plant ontogeny rather than environmental change. As plant mass increases, nutrient supply from the soil may become relatively insufficient, leading to a nitrogen deficiency in the plant body. In the later stages of the life cycle, reallocation of nitrogen to reproductive organs may also decrease nitrogen in vegetative parts. Mae and Ohira (1981) showed that about half of the nitrogen in vegetative organs was retranslocated to reproductive organs in rice.
Temperature dependence of photosynthesis
The optimal temperature of the photosynthetic rate determined by the model (Topt) was higher at elevated than at ambient CO2 (Figs 6, 7B). In earlier stages (June, July and August), this is attributed to the difference in the limiting step of photosynthesis: photosynthesis at Topt was limited by Pc at ambient CO2 and by Pr at elevated CO2 (data not shown). In many species, Pc has a lower optimal temperature than Pr (Kirschbaum and Farquhar, 1984; Hikosaka, 1997; Hikosaka et al., 1999; Onoda et al., 2005b). This is because the increase in the carboxylation rate with increasing temperature is partly offset by the increase in photorespiration rate (Kirschbaum and Farquhar, 1984). In September, on the other hand, photosynthesis at Topt was limited by Pc at both CO2 concentrations. The increase in Topt at elevated CO2 is thus attributed to the effect of Ci on temperature dependence of Pc, which is directly influenced by the balance between carboxylation and photorespiration. Increasing CO2 concentration decreases the contribution of photorespiration, which makes photosynthesis more temperature-dependent and increases the optimal temperature (Kirschbaum and Farquhar, 1984; Long, 1991).
Topt showed a significant difference between months (Table 2). This may be partly explained by the increase in growth temperature at ambient CO2 (Fig. 7B). Since Pc limited photosynthesis at ambient CO2, the change in Topt was attributable to the change in Eav. According to the model, an increase in Eav by 10 kJ mol−1 leads to an increase in the optimal temperature of Pc by 5·4 °C (Hikosaka et al., 2006). Eav actually increased with growth temperature (Fig. 7A), which was consistent with other studies (Hikosaka et al., 1999; Onoda et al., 2005b; Yamori et al., 2005). The increase in Eav with increasing growth temperature is a common response in C3 species (Hikosaka et al., 2006).
In contrast, at elevated CO2, Topt showed neither a clear seasonal trend nor a dependence on Tg (Fig. 7B). This is because Eaj did not change with time (Table 2). In many species the temperature dependence of Jmax changes with growth temperature (Armond et al., 1978; Badger et al., 1982; Hikosaka et al., 1999; Ziska, 2001; Yamasaki et al., 2002), but in some species it does not (Sage et al., 1995). The difference in Tg of less than 5 °C in our study might have been too small to detect a significant change in Eaj, or alternatively Eaj of rice was not affected by growth temperature. On the other hand, different seasonal trends in the dependence of Eaj between ambient and elevated CO2 and between the two years (Fig. 4) suggest that factors other than temperature are involved in the change in Eaj.
At elevated CO2 the limiting step of photosynthesis changed between the early (June, July and August) and the late stage (September), caused by a higher Jmax/Vcmax ratio in September. We found a positive correlation between the Jmax/Vcmax ratio and Tg (data not shown). However, this result is inconsistent with earlier studies: in some species the Jmax/Vcmax ratio increased at low temperature (Hikosaka et al., 1999; Hikosaka, 2005; Onoda et al., 2005a; Yamori et al., 2005) but in others it did not with growth temperature (Bunce, 2000; Hikosaka and Hirose, 2001; Medlyn et al., 2002a; Onoda et al., 2005b). For rice grown under controlled conditions, the Jmax/Vcmax ratio was higher at low temperatures (Makino et al., 1994). The inconsistency between earlier studies and ours may be caused by an alteration of the Jmax/Vcmax ratio due to factor(s) other than Tg. Seneweera et al. (2002) found that flag leaves of rice had a lower Vcmax per unit Rubisco than earlier leaves. A decrease in internal conductance of CO2 diffusion may be involved in the seasonal change in the Jmax/Vcmax ratio (von Caemmerer, 2000; Onoda et al., 2005b).
CONCLUSIONS
There was an increase in the absolute value of Pgrowth and in the optimal temperature of the Pgrowth–temperature curve caused by elevated CO2 concentration during growth and seasonal environment. Seasonal decrease in Pgrowth was associated with decrease in nitrogen status with plant growth, which decreased Narea and thus Jmax and Vcmax. The seasonal change in the Topt differed between the two CO2 concentrations. At ambient CO2, Topt increased with increasing growth temperature due mainly to increasing activation energy of Vcmax. At elevated CO2, Topt did not show clear seasonal changes. This was partly caused by the seasonal increase in the Jmax/Vcmax ratio. Thus, the temperature dependence of photosynthesis was influenced by seasonal environment and reduction in nitrogen with plant growth, which was different between ambient and elevated CO2.
Acknowledgments
We thank Yusuke Onoda for advice with the photosynthetic measurements, and Aki Shigeno and Michio Oguro for their technical assistance with the experiment. We also acknowledge the technical assistance of Hiroyuki Shimono, Hirofumi Nakamura and Keiko Iwabuchi (National Agricultural Research Organization). This study was conducted in part under the Global Environment Research Coordination System funded by the Ministry of the Environment, Japan. This work was also supported by a Grant-in-aid from the Japan Ministry of Education, Culture, Sports, Science and Technology.
LITERATURE CITED
- Ainsworth EA, Davey PA, Hymus GJ, Osborne CP, Rogers A, Blum H, Nösberger J, Long SP. 2003. Is stimulation of leaf photosynthesis by elevated carbon dioxide concentration maintained in the long term? A test with Lolium perenne grown for 10 years at two nitrogen fertilization levels under free air CO2 enrichment (FACE). Plant, Cell and Environment 26: 705–714. [Google Scholar]
- Anten NPR, Hirose T, Onoda Y, Kinugasa T, Kim HY, Okada M, Kobayashi K. 2003. Elevated CO2 and nitrogen availability have interactive effects on canopy carbon gain in rice. New Phytologist 161: 459–472. [DOI] [PubMed] [Google Scholar]
- Armond PA, Schreiber U, Björkman O. 1978. Photosynthetic acclimation to temperature in the desert shrub, Larrea divaricata. Plant Physiology 61: 411–415. [DOI] [PMC free article] [PubMed] [Google Scholar]
- Badger M, Björkman O, Armond P. 1982. An analysis of photosynthetic response and adaptation to temperature in higher plants; temperature acclimation in the desert evergreen Nerium oleander L. Plant, Cell and Environment 5: 85–99. [Google Scholar]
- Bernacchi CJ, Singsaas EL, Pimentel C, Portis JrAR, Long SP. 2001. Improved temperature response functions for models of Rubisco-limited photosynthesis. Plant, Cell and Environment 24: 253–259. [Google Scholar]
- Berry JA, Björkman O. 1980. Photosynthetic response and adaptation to temperature in higher plant. Annual Review of Plant Physiology 31: 491–543. [Google Scholar]
- Bunce JA. 2000. Acclimation of photosynthesis to temperature in eight cool and warm climate herbaceous C3 species: temperature dependence of parameters of a biochemical photosynthesis model. Photosynthesis Research 63: 59–67. [DOI] [PubMed] [Google Scholar]
- von Caemmerer S. 2000. Biochemical models of leaf photosynthesis. Canberra: CSIRO Publishing.
- von Caemmerer S, Ghannoum O, Conroy JP, Clark H, Newton PCD. 2001. Photosynthetic responses of temperate species to free air CO2 enrichment (FACE) in a grazed New Zealand pasture. Australian Journal of Plant Physiology 28: 439–450. [Google Scholar]
- Chen GY, Yong ZH, Liao Y, Zhang DY, Chen Y, Zhang HB, Chen J, Zhu JG, Xu DQ. 2005. Photosynthetic acclimation in rice leaves to free-air CO2 enrichment related to both ribulose-1,5-bisphosphate carboxylation limitation and ribulose-1,5-bisphosphate regeneration limitation. Plant and Cell Physiology 46: 1036–1045. [DOI] [PubMed] [Google Scholar]
- Cunningham SC, Read J. 2002. Comparison of temperate and tropical rainforest tree species: photosynthetic responses to growth temperature. Oecologia 133: 112–119. [DOI] [PubMed] [Google Scholar]
- Farquhar G, von Caemmerer S, Berry JA. 1980. A biochemical model of photosynthetic CO2 assimilation in leaves of C3 species. Planta 149: 78–90. [DOI] [PubMed] [Google Scholar]
- Ferrar P, Slatyer R, Vranjic J. 1989. Photosynthetic temperature acclimation in Eucalypus species from diverse habitats, and a comparison with Nerium oleander. Agricultural and Forest Meteorology 16: 199–217. [Google Scholar]
- Han Q, Kawasaki T, Nakano T, Chiba Y. 2004. Spatial and seasonal variability of temperature responses of biochemical photosynthesis parameters and leaf nitrogen content within a Pinus densiflora crown. Tree Physiology 24: 737–744. [DOI] [PubMed] [Google Scholar]
- Harley PC, Tenhunen JD. 1991. Modeling the photosynthetic response of C3 leaves to environmental factors. In: Boote KJ, Loomis RS, eds. Modeling crop photosynthesis—from biochemistry to canopy. Madison: Crop Science Society of America, Inc. and American Society of Agronomy, Inc. 17–39.
- Hasegawa T, Horie T. 1996. Rice leaf photosynthesis as a function of nitrogen content and crop developmental stage. Japanese Journal of Crop Science 65: 553–554. [Google Scholar]
- Hikosaka K. 1997. Modeling optimal temperature acclimation of the photosynthetic apparatus in C3 plants with respect to nitrogen use. Annals of Botany 80: 721–730. [Google Scholar]
- Hikosaka K. 2005. Nitrogen partitioning in the photosynthetic apparatus of Plantago asiatica leaves grown at different temperature and light conditions: similarities and differences between temperature and light acclimation. Plant and Cell Physiology 46: 1283–1290. [DOI] [PubMed] [Google Scholar]
- Hikosaka K, Hirose T. 2001. Temperature acclimation of the photosynthetic apparatus in an evergreen shrub, Nerium oleander. In: Proceedings of 12th International Congress on Photosynthesi. Melbourne: CSRIO Publishing.
- Hikosaka K, Murakami A, Hirose T. 1999. Balancing carboxylation and regeneration of ribulose-1,5-bisphosphate in leaf photosynthesis: temperature acclimation of an evergreen tree, Quercus myrsinaefolia. Plant, Cell and Environment 22: 841–849. [Google Scholar]
- Hikosaka K, Ishikawa K, Borjigidai A, Muller O, Onoda Y. 2006. Temperature acclimation of photosynthesis: mechanisms involved in the changes in temperature dependence of photosynthetic rates. Journal of Experimental Botany 57: 291–302. [DOI] [PubMed] [Google Scholar]
- IPCC. 2001. Climate change 2001: Synthesis Report (Watson RT and the Core Writing Team eds.) Intergovernmental Panel on Climate Change. Geneva, Switzerland: IPCC.
- Kim HY, Lieffering M, Kobayashi K, Okada M, Miura S. 2003. Seasonal changes in the effects of elevated CO2 on rice at three levels of nitrogen supply: a free air CO2 enrichment (FACE) experiment. Global Change Biology 9: 826–837. [Google Scholar]
- Kirschbaum MUF, Farquhar G. 1984. Temperature dependence of whole-leaf photosynthesis in Eucalyptus pauciflora Sieb. ex Spreng. Agricultural and Forest Meteorology 11: 519–538. [Google Scholar]
- Kobayashi K, Lieffering M, Kim HY. 2001. Growth and yield of paddy rice under Free-Air CO2 Enrichment. In: Shiyomi M, Koizumi H, eds. The structure and function in agroecosystem design and management. Boca Raton: CRC Press, 371–395.
- Leuning R. 2002. Temperature dependence of two parameters in a photosynthesis model. Plant, Cell and Environment 25: 1205–1210. [Google Scholar]
- Long SP. 1991. Modification of the response of photosynthetic productivity to rising temperature by atmospheric CO2 concentration: has its importance been underestimated? Plant, Cell and Environment 14: 729–739. [Google Scholar]
- Long SP, Ainsworth EA, Rogers A, Ort DR. 2004. Rising atmospheric carbon dioxide: plants FACE the future. Annual Review of Plant Biology 55: 591–628. [DOI] [PubMed] [Google Scholar]
- Ludewig F, Sonnewald U. 2000. High CO2-mediated down-regulation of photosynthetic gene transcripts is caused by accelerated leaf senescence rather than sugar accumulation. FEBS Letters 479: 19–24. [DOI] [PubMed] [Google Scholar]
- Mae T, Ohira K. 1981. The remobilization of nitrogen related to leaf growth and senescence in rice plants (Oryza sativa L.). Plant and Cell Physiology 22: 1067–1074. [Google Scholar]
- Makino A, Nakano H, Mae T. 1994. Effects of growth temperature on the responses of ribulose-1, 5-biophosphate carboxylase, electron transport components, and sucrose synthesis enzymes to leaf nitrogen in rice, and their relationships to photosynthesis. Plant Physiology 105: 1231–1238. [DOI] [PMC free article] [PubMed] [Google Scholar]
- Medlyn BE, Loustau D, Delzon S. 2002a. Temperature response of parameters of a biochemically based model of photosynthesis. I. Seasonal changes in mature maritime pine (Pinus pinaster Ait.). Plant, Cell and Environment 25: 1155–1165. [Google Scholar]
- Medlyn BE, Dreyer E, Ellsworth D, Forstreuter M, Harley PC, Kirschbaum MUF, et al. 2002b. Temperature response of parameters of a biochemically based model of photosynthesis. II. A review of experimental data. Plant, Cell and Environment 25: 1167–1179. [Google Scholar]
- Mitchell RAC, Lawlor DW, Mitchell VJ, Gibbard CL, White EM, Porter JR. 1995. Effects of elevated CO2 concentration and increased temperature on winter wheat: test of ARCWHEAT1 simulation model. Plant, Cell and Environment 18: 736–748. [Google Scholar]
- Norby RJ, Luo YQ. 2004. Evaluating ecosystem responses to rising atmospheric CO2 and global warming in a multi-factor world. New Phytologist 162: 281–293. [Google Scholar]
- Okada M, Lieffering M, Nakamura H, Yoshimoto M, Kim HY, Kobayashi K. 2001. Free-air CO2 enrichment (FACE) with pure CO2 injection: rice FACE system design and performance. New Phytologist 150: 251–260. [Google Scholar]
- Onoda Y, Hikosaka K, Hirose T. 2005a. Seasonal change in the balance between capacities of RuBP carboxylation and RuBP regeneration affects CO2 response of photosynthesis in Polygonum cuspidatum. Journal of Experimental Botany 56: 755–763. [DOI] [PubMed] [Google Scholar]
- Onoda Y, Hikosaka K, Hirose T. 2005b. The balance between capacities of RuBP carboxylation and RuBP regeneration: a mechanism underlying the interspecific variation in acclimation of photosynthesis to seasonal change in temperature. Functional Plant Biology 32: 903–910. [DOI] [PubMed] [Google Scholar]
- Rey A, Jarvis PG. 1998. Long-term photosynthetic acclimation to increased atmospheric CO2 concentration in young birch (Betula pendula) trees. Tree Physiology 18: 441–450. [DOI] [PubMed] [Google Scholar]
- Rogers A, Allen DJ, Davey PA, Morgan PB, Ainsworth EA, Bernnachi CJ, et al. 2004. Leaf photosynthesis and carbohydrate dynamics of soybeans grown though out their life-cycle under free-air carbon dioxide enrichment. Plant, Cell and Environment 27: 449–458. [Google Scholar]
- Rogers GS, Milham PJ, Gillings M, Conroy JP. 1996. Sink strength may be the key to growth and nitrogen responses in N-deficient wheat at elevated CO2. Australian Journal of Plant Physiology 23: 253–264. [Google Scholar]
- Sage RF. 1994. Acclimation of photosynthesis to increasing atmospheric CO2: the gas exchange perspective. Photosynthesis Research 39: 351–368. [DOI] [PubMed] [Google Scholar]
- Sage RF, Santrucek J, Grise DJ. 1995. Temperature effects on the photosynthetic response of C3 plants to long-term CO2 enrichment. Vegetatio 121: 67–77. [Google Scholar]
- Seneweera SP, Conroy JP, Ishimaru K, Ghannoum O, Okada M, Lieffering M, Kim HY, Kobayashi K. 2002. Changes in source-sink relations during development influence photosynthetic acclimation of rice to free air CO2 enrichment (FACE). Functional Plant Biology 29: 945–953. [DOI] [PubMed] [Google Scholar]
- Slatyer R. 1977. Altitudinal variation in the photosynthetic characteristics of snow gum, Eucalyptus Pauciflora Sieb. ex Spreng. IV. Temperature response of four populations grown at different temperature. Agricultural and Forest Meteorology 4: 583–594. [Google Scholar]
- Yamasaki T, Yamakawa T, Yamane Y, Koike H, Satoh K, Katoh S. 2002. Temperature acclimation of photosynthesis and related changes in photosystem II electron transport in winter wheat. Plant Physiology 128: 1087–1097. [DOI] [PMC free article] [PubMed] [Google Scholar]
- Yamori W, Noguchi K, Terashima I. 2005. Temperature acclimation of photosynthesis in spinach leaves: analyses of photosynthetic components and temperature dependencies of photosynthetic partial reactions. Plant, Cell and Environment 28: 536–547. [Google Scholar]
- Ziska LH. 2001. Growth temperature can alter the temperature dependent stimulation of photosynthesis by elevated carbon dioxide in Abutilon theophrasti. Physiologia Plantarum 111: 322–328. [DOI] [PubMed] [Google Scholar]
- Ziska LH, Weerakoon W, Namuco OS, Pamplona R. 1996. The influence of nitrogen on the elevated CO2 response in field-grown rice. Australian Journal of Plant Physiology 23: 45–52. [Google Scholar]


