Abstract
The testis consists of two types of tissues, the interstitial tissue and the seminiferous tubule, which have different functions and are assumed to have different nutritional metabolism. The localization of enzymes of the mitochondrial fatty acid β-oxidation system in the testis was investigated to obtain a better understanding of nutrient metabolism in the testis. Adult rat testis tissues were subjected to immunoblot analysis for quantitation of the amounts of enzyme proteins, to DNA microarray analysis for gene expression, and to immunofluorescence and immunoelectron microscopy for localization. Quantitative analysis by immunoblot and DNA microarray revealed that enzymes occur abundantly in Leydig cells in the interstitial tissue but much less so in the seminiferous tubules. Immunohistochemistry revealed that Leydig cells in the interstitial tissue and Sertoli cells in the seminiferous tubules contain a full set of mitochondrial fatty acid β-oxidation enzymes in relatively plentiful amounts among the cells in the testis, but that this is not so in spermatogenic cells. This characteristic localization of the mitochondrial fatty acid β-oxidation system in the testis needs further elucidation in terms of a possible role for it in the nutritional metabolism of spermatogenesis. (J Histochem Cytochem 58:195–206, 2010)
Keywords: testis, mitochondria, fatty acid β-oxidation, immunohistochemistry, electron microscopy, Leydig cell, Sertoli cell, seminiferous epithelium
Fatty acids constitute the major fuel source in animal bodies and are stored as triacylglycerols. They are metabolized by the mitochondrial fatty acid β-oxidation system and extra-mitochondrial fatty acid oxidation systems of peroxisomal β-oxidation and microsomal ω-oxidation (reviewed in Reddy and Hashimoto 2001). Under normal physiological conditions, mitochondrial fatty acid β-oxidation is the dominant metabolic pathway in fatty acid oxidation (reviewed in Hashimoto et al. 1999; Reddy and Hashimoto 2001).
The testis consists of two types of tissues, the interstitial tissue and the seminiferous tubule; the major components of the former are testosterone-secreting Leydig cells, and of the latter the seminiferous epithelium, in which spermatogenesis occurs (Bloom and Fawcett 1975). Leydig cells are known to be able to utilize glucose and a ketone body to maintain their steroidogenesis (Amrolia et al. 1988); however, their relationship to fatty acid β-oxidation is not clear. The presence of peroxisomes (Reddy and Svoboda 1972a,b) containing peroxisomal fatty acid β-oxidation enzymes (Nemali et al. 1988) has been examined in Leydig cells in the interstitial tissue of the testis. In contrast, almost nothing is known on a mitochondrial fatty acid β-oxidation system in Leydig cells, although they contain abundant mitochondria (Mori and Christensen 1980). The seminiferous epithelium consists of two types of cells, Sertoli cells and spermatogenic cells (i.e., spermatogonia, spermatocytes, and spermatids), both of which are known to be necessary for spermatogenesis (Cooke and Saunders 2002), and in which significant interactions between Sertoli cells and spermatogenic cells are known to occur (Mruk and Cheng 2004). The energy needed for proliferation and differentiation of spermatogenic cells is thought to be provided mainly by glucose and the products of glycolysis, pyruvate and lactate (Grootegoed et al. 1984; Boussouar and Benahmed 2004). The latter two have been suggested to be provided by Sertoli cells (Robinson and Fritz 1981). In contrast to glucose metabolism in seminiferous epithelium, fatty acids as another major source of energy production have not received much attention since the first report of fatty acid oxidation in spermatogenic cells (Jutte et al. 1981).
Knowledge of the distribution of the individual mitochondrial fatty acid β-oxidation enzymes is quite limited, even though fatty acid β-oxidation should play important roles in energy production in the body. Mitochondria are cell organellae known to be distributed in all types of cells and tissues (De Duve 1984). The contribution of mitochondria to substrate oxidation in intact cells and tissues is generally considered to depend on their ability to oxidize fatty acids and on their relative abundance. The amounts of mitochondrial fatty acid β-oxidation enzymes have been shown to be almost the same in the organs hitherto examined: the liver, the kidney, and the heart (Cook et al. 2000). The process of mitochondrial fatty acid β-oxidation dealt with in the present study is as follows. After fatty acyl-CoAs, activated forms of fatty acids, are translocated into the mitochondrial matrix, they are first oxidized by two inner membrane–associated enzymes, very long chain acyl-CoA dehydrogenase (VLCAD) (Izai et al. 1992) and enoyl-CoA hydratase/3-hydroxyacyl-CoA dehydrogenase/3-ketoacyl-CoA thiolase trifunctional protein (TFP) (Uchida et al. 1992). The carbon chain–shortened fatty acyl-CoAs are then completely β-oxidized by the second mitochondrial enzyme system located in the mitochondrial matrix, called the classical pathway, to acetyl-CoA (Hashimoto et al. 1999). This metabolic system in mitochondria is composed of enzymes catalyzing four steps of reaction by acyl-CoA dehydrogenases, enoyl-CoA hydratase (MH), 3-hydroxyacyl-CoA dehydrogenase (HADH), and 3-ketoacyl-CoA thiolase (MTL1) (Ikeda et al. 1985; Reddy and Hashimoto 2001). In the first step, isozymes of the acyl-CoA dehydrogenases have different substrate specificities for long, medium, and short carbon chain lengths of the substrates [long-chain acyl-CoA dehydrogenase (LCAD), medium-chain acyl-CoA dehydrogenase (MCAD), and short-chain acyl-CoA dehydrogenase (SCAD)].
While studying the nutritional environment in the testis, we attempted also to examine the difference in the distribution of mitochondrial fatty acid β-oxidation enzymes in the two testicular tissues, the interstitial tissues and the seminiferous tubules. In the preliminary study, a distinctive difference in the relative contents of several enzymes between the interstitial tissues and the seminiferous tubules in the testis was noticed. This observation prompted us to examine the localization of the individual enzymes of mitochondrial fatty acid β-oxidation in the testis by immunohistochemistry.
Materials and Methods
Animals
Testicular tissues of male Wistar rats, postnatal week 12, were used. Animal care and experiments were done according to Fujita Health University School of Medicine Animal Care Committee recommendations. Animals were sacrificed under deep anesthesia with sodium pentobarbital to obtain tissues for use in biochemical experiments. Perfusion fixation of animals for histological experiments was done also under deep anesthesia with sodium pentobarbital.
Separation of Testicular Tissues
Rat testis tissues were cut into small pieces of 5 mm with scissors, and the loops of seminiferous tubules and the interstitial tissues were picked up using tweezers from testicular tissues under a dissecting microscope (Reddy and Svoboda 1972a,b; Watanabe et al. 1984). The interstitial tissues and seminiferous tubules after separation were subjected to light microscopy and slab gel electrophoresis to determine the effectiveness of the separation. For light microscopy, they were doubly fixed with buffered 2.5% glutaraldehyde and 1% osmium tetroxide. After dehydration with graded ethanol series and acetone, they were embedded in an epoxy resin. One-μm sections were stained with 1% toluidine-blue solution and photomicrographed. The procedure for slab gel electrophoresis is described below.
Antibodies
The source of primary polyclonal antibodies raised in rabbits against the purified protein preparations used in this study were previously described (Aoyama et al. 1998; Hashimoto et al. 1999; Cook et al. 2000), except that for citrate synthase (CS). For raising CS antibody, rabbits were immunized with commercial bovine heart CS (Boeringer Manheim GmbH; Manheim, Germany) using a procedure described in Usuda et al. (1986), and the IgG fraction of the serum was obtained (Usuda et al. 1986). The antibody was characterized by immunotitration and immunoblot analysis. Immunotitration was made by immunoprecipitation on a partially purified CS preparation from rat liver tissues (Moriyama and Srere 1971). Various amounts of antibody were added to a fixed amount of CS enzyme preparation. An aliquot of supernatant was used for assay of enzyme activity of CS (Srere 1969). For the labeling of Sertoli cells, a commercial monoclonal antibody for tyrosinated α-tubulin was employed (Sigma; St Louis, MO).
Slab Gel Electrophoresis
Tissues were homogenized in 0.25 M sucrose, 50 mM potassium phosphate, pH 7.5, 1 mM EDTA, 1 mM benzamidine, 4 μg/ml leupeptin, 4 μg/ml pepstatin, and 4 μg/ml E-64. The homogenate was mixed with an equal amount of a sample buffer containing 5% sodium dodecyl sulfate (SDS) and boiled for 5 min. The samples were subjected to 10% SDS-slab gel electrophoresis (Laemmli 1970). Protein concentration of the homogenate was measured using a modification by Markwell et al. (1981) of the original Lowry method (Lowry et al. 1951) with bovine serum albumin as a standard.
Immunoblot Analysis and Its Quantitation
Following slab gel electrophoresis, transfer blotting of proteins was done onto nitrocellulose membranes (Towbin et al. 1979). After blocking with 5% bovine serum albumin, they were treated with the primary antibodies and then with alkaline phosphatase–labeled goat anti-rabbit IgG for color development with bromochloro-indolyl phosphate/nitroblue tetrazolium. Signal images were scanned into a microcomputer, and signal intensities were measured with National Institutes of Health Image software. The intensity of the total density of the area was measured as the product of the area (pixels) and the density (256 gradings/pixel). The immunoblots for the interstitial tissues and seminiferous tubules were done with amounts of homogenates whose signal densities fell in the range shown with the liver homogenates.
Immunofluorescence Microscopy
Tissues were processed as reported previously (Usuda et al. 1991a). Tissues were fixed with 4% paraformaldehyde in 100 mM sodium phosphate, pH 7.4, by perfusion through the left heart ventricle for 15 min and by immersion for 3 hr at 4C. After washing with 100 mM lysine in 100 mM sodium phosphate, pH 7.4, and 150 mM sodium chloride to quench free aldehyde groups for 3 hr, they were immersed in graded sucrose solutions: 10%, 15%, and 20% for 10 hr each and frozen in a mixture of dry ice and N-hexane. Sections of 10-μm thickness were cut on a cryostat microtome (Leica Microsystems; Wetzlar, Germany) and collected on aminosilane-coated glass slides. After permeabilization with 0.1% Triton X-100 in 100 mM sodium phosphate, pH 7.4, and 150 mM sodium chloride, specimens were treated with Image-iT Signal Enhancer (Invitrogen, Inc.; Eugene, OR). They were then labeled with primary antibodies (10 μg/ml IgG) and detected with Alexa Fluor 488–labeled goat anti-rabbit IgG and Alexa Fluor 546–labeled goat anti-mouse IgG (Invitrogen, Inc.). For showing the specificity of the antibody, controls of light microscopic immunohistochemistry are presented with the antibody preabsorbed with purified enzyme by a procedure reported as described (Uchida et al. 1992) and non-immune IgG fraction of the rabbit serum. Some of the specimens were stained with 0.5 μg/ml 4′,6-diamino-2-phenylindole (DAPI) (Invitrogen, Inc.) in 20 mM sodium phosphate, pH 7.4, 150 mM sodium chloride for 5 min for visualizing nuclei. Specimens were observed with an Axiovert 200M microscope equipped with an ApoTome (Carl Zeiss Co. Ltd.; Jena, Germany) and a differential interference contrast (DIC) microscope with a 20× plan/apo objective lens, and photomicrographed with an AxioCam CCD camera, or with a confocal laser scanning microscope (CLSM) LSM510 with a 63× plan/apo objective lens (Carl Zeiss Co. Ltd.). Image acquisition was done with software, AxioVision ver. 4.6.3 for the AxioVert microscope, and LSM510 ver. 3.2 for LSM images (Carl Zeiss Co. Ltd.). Image processing was done with software, AxioVision ver. 4.6.3 and LSM Image Browser ver. 3.5.0 (Carl Zeiss Co. Ltd.).
Immunoelectron Microscopy
Immunoelectron microscopy was done as reported previously (Usuda et al. 1991b; Miyanari et al. 2007). Rats were fixed by perfusion from left ventricles for 15 min with 4% paraformaldehyde/0.2% glutaraldehyde in 100 mM sodium phosphate, pH 7.4, at 4C and by immersion for 3 hr. After washing with 100 mM lysine in 100 mM sodium phosphate, pH 7.4, and 150 mM sodium chloride, they were dehydrated in a graded series of cold ethanol. The tissues were embedded in Lowicryl K4M (Polyscience; Warrington, PA) by polymerization by ultraviolet irradiation at −20C. Ultrathin sections of 0.1 μm were cut on an ultramicrotome and collected on nickel grids with polyvinyl formal membrane. They were stained with polyclonal antibodies (100 μg/ml IgG) at 4C for 12 hr and a solution of 10-nm gold particles conjugated with goat anti-rabbit IgG (British Biocell International; South Wales, UK) at room temperature for 2 hr. Specimens were observed with a JEM1010 electron microscope (JEOL; Tokyo, Japan) at an accelerating voltage of 80 kV after staining with uranyl acetate and lead citrate. Image acquisition was done with a Gatan BioScan Model 792 CCD camera and Digital Micrograph ver. 3.9.3 software (Gatan; Pleasanton, CA).
Morphometric Analysis of Labeling Density
Morphometric analyses of the labeling density (Bendayan and Reddy 1982) were performed on 1300 electron micrographs to obtain the immunolabel concentration (Nemali et al. 1988) to show relative amounts of enzymes in cells, and the labeling density to show the background staining. The volume density of mitochondria was calculated in relation to cytoplasmic volume in every type of testicular cell, and the labeling density was expressed as the number of gold particles/μm2 of the volume of mitochondria. Immunolabel concentration was expressed per unit of volume by multiplying mitochondrial volume density by labeling density of the mitochondria. The labeling density of each compartment of Leydig cells was compared with that of mitochondria to evaluate the background staining. The areas of cellular compartments on digital images were measured with Image Pro Plus software (ver. 5.0.2.9) (Media Cybernetics; Bethesda, MD).
Stages of the Seminiferous Epithelium
The cycle of the seminiferous epithelium was divided into 14 stages as stages I-XIV, following a description in the previous literature (Leblond and Clermont 1952). Light microscopy to determine the stages was done mostly by immunofluorescence microscopy and DIC observation, based on cellular association in the seminiferous epithelium, the flagella in the lumen of the tubules, the location of the heads of spermatids stained with DAPI, the thickness of the seminiferous epithelium, and the staining patterns of Sertoli cells for tyrosinated α-tubulin (Wenz and Hess 1998). The 14 stages were combined into five stage groups (groups 1–5) based on the staining patterns of microtubules in the Sertoli cells (Wenz and Hess 1998). In electron microscopic analysis, stages were examined based on the location of ellipsoid-shaped nuclei of spermatids around Sertoli cells, the layers of spermatids with various shapes of acrosomes, and the remaining cytoplasm around the flagella of spermatids.
DNA Microarray Experiments
DNA microarray analysis was done as previously described (Hayashi et al. 2007). Total RNA was extracted from tissues using QuickGene (Fujifilm; Tokyo, Japan) and was quantified spectrophotometrically at 260 nm. The quality of RNA was checked on a Bioanalyzer 2100 system (Agilent Technologies; Waldbronn, Germany). Five hundred-ng aliquots of each or pooled RNA samples under the respective conditions were labeled using an Agilent low RNA input fluorescent linear amplification kit. After checking the labeling efficiency, 1-pg aliquots of Cy5-labeled cRNA of seminiferous tubules or interstitial tissue of testis from four animals and the mixture of Cy3-labeled cRNA of liver tissues from four animals were hybridized to Agilent whole-genome rat oligo microarrays. Hybridization was done at 65C for 17 hr by four aliquots of one cRNA of testicular tissues from one animal and a mixture of cRNA of liver from four animals. After the washing step, the microarray slides were analyzed using an Agilent microarray scanner. Data were analyzed using Agilent feature extraction software ver. 9.5. Relative expressions of fatty acid β-oxidation enzymes were expressed as the average of values from testicular tissues of four animals.
Statistical Analysis
The results are expressed as means ± standard deviation, and the differences were compared by Student's t-test. A difference of p<0.05 was considered to be significant.
Results
Characterization of CS Antibody
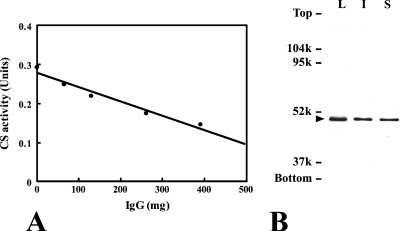
Immunotitration indicated that the antibody reacted proportionally with the enzyme in the preparation of rat liver CS (Figure 1A). Immunoblot analysis showed only one signal for preparations of rat liver, the interstitial tissue, and seminiferous tubules, with mobility of 49 kDa (Figure 1B), which corresponds to the size of a monomer of CS (Moriyama and Srere 1971). These data suggested the monospecificity of the antibody preparation.
Figure 1.
Titration of citrate synthase (CS) with the antibody (A). Immunoblot analysis of the rat liver (L) with 4 μg of protein, the interstitial tissue (I) with 1 μg of protein, and seminiferous tubules (S) with 1 μg of protein (B). Note the single bands (arrowhead) in three types of homogenates at the same mobility.
Immunofluorescent Microscopy at Low-power Magnification
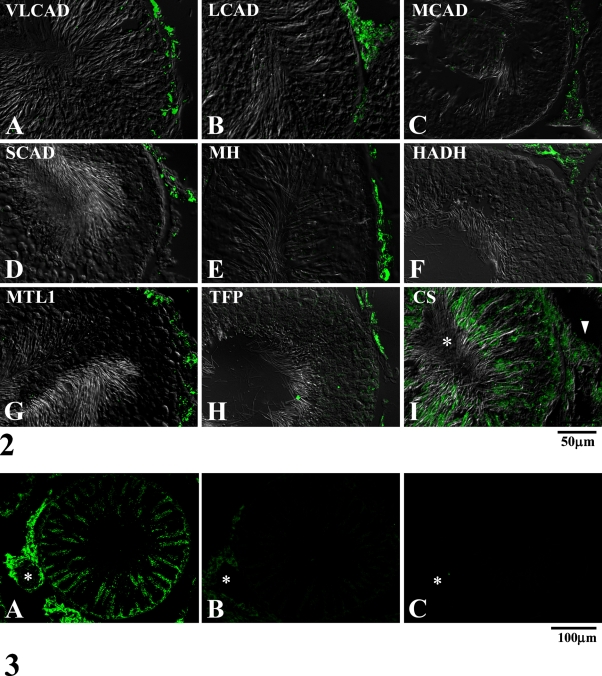
Figures 2A–2I show the distribution of the mitochondrial fatty acid β-oxidation enzymes in the two tissues of the testis, the interstitial tissues and the seminiferous tubules, and of CS as a TCA cycle enzyme. The staining pattern was granular, and the distribution of the staining depended on the type of enzyme examined. All of the mitochondrial fatty acid β-oxidation enzymes were located mainly in the interstitial tissues, and the staining of the seminiferous tubules was distinctively weaker than that of the interstitial tissues under low-power magnification (Figures 2A–2H), showing that they are present in low amounts. When the seminiferous tubule is observed without DIC microscopy, the reaction product for a seminiferous epithelium is relatively weak; however, granular stainings are regularly arranged (Figure 3A). CS, employed as a marker for mitochondria, was equally localized in these two tissues (Figure 2I), showing that mitochondria are equally distributed in the two tissues. Immunofluorescent stainings of rat testis with the antibody preabsorbed with the immunogen and with the IgG fraction of non-immune rabbit serum were consistently negative. These control stainings are exemplified by MTL1 (Figures 3A–3C).
Figure 2.
Immunofluorescent micrographs of adult rat testis observed at low-power magnification stained for mitochondrial fatty acid β-oxidation enzymes (A–H) and CS (I), with the seminiferous epithelium at stage VII, together with differential interference contrast observation. Arrowhead, interstitial tissue; asterisk, seminiferous tubule. Note that the seminiferous epithelium is negative for the staining for mitochondrial fatty acid β-oxidation enzymes, whereas the interstitial tissue is positive for all of them. Both the interstitial tissues and seminiferous epithelial cells are positive for CS. VLCAD, very long chain acyl-CoA dehydrogenase; LCAD, long-chain acyl-CoA dehydrogenase; MCAD, medium-chain acyl-CoA dehydrogenase; SCAD, short-chain acyl-CoA dehydrogenase; MH, enoyl-CoA hydratase; HADH, 3-hydroxyacyl-CoA dehydrogenase; MTL1, 3-ketoacyl-CoA thiolase; TFP, trifunctional protein.
Figure 3.
Immunofluorescent micrographs of adult rat testis observed at low-power magnification for showing control stainings. Tissue sections were stained with the antibody for a mitochondrial fatty acid β-oxidation enzyme, MTL1 (A), the same antibody preabsorbed with purified enzyme of MTL1 (B), and IgG fraction of non-immune serum (C). Asterisk, small artery in the interstitial tissue. Note that the staining of Leydig cells in the interstitial tissue is relatively more intense than that of the seminiferous epithelium. Note also that preabsorption of the antibody with MTL1 enzyme markedly diminished the staining.
Separation of Testicular Tissues and Distribution of Fatty Acid β-Oxidation Enzymes by Immunoblot Analysis and by DNA Microarray
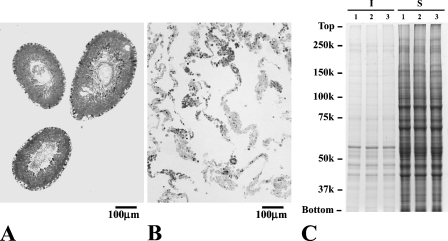
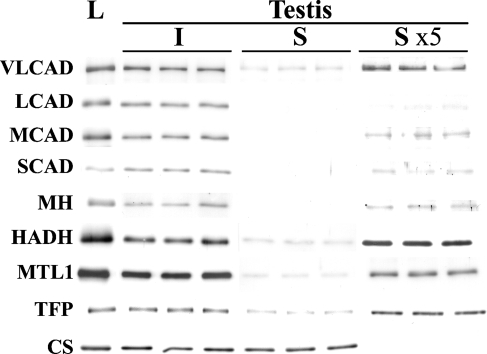
The two preparations, the interstitial tissues and the seminiferous tubules, were quite different tissues by light microscopic observation. The preparations of the seminiferous tubules were practically devoid of interstitial tissues (Figures 4A and 4B). Electrophoresis of the two types of tissue from three animals showed the two preparations to consist of different peptides (Figure 4C). Light microscopy and electrophoresis showed a very small amount of mixing of the two tissues, if present. Figure 5 summarizes the results of immunoblot analysis of mitochondrial fatty acid β-oxidation enzymes. The interstitial tissue and the seminiferous tubules from three rats were run together with three pooled liver samples. All antibodies were nearly monospecific for rat liver tissues. A single band was observed for most of the enzymes, except for TFP. The antibody detected α- and β-subunits of TFP, the former carrying the sites of enoyl-CoA hydratase/3-hydroxyacyl-CoA dehydrogenase activities, and the latter carrying the 3-ketoacyl-CoA thiolase site (Uchida et al. 1992). All of the enzymes of a mitochondrial fatty acid β-oxidation system were detected in the two testicular tissues when the same amount of the two samples was employed for analysis, but the signals for some enzymes were too faint for proper quantitative determination. A 5-fold amount of samples of seminiferous tubules was therefore employed in the analysis. The relative amounts of enzymes were quantified from the sizes and intensities of signals (Table 1). All enzymes in the interstitial tissues were 0.5- to 1.5-fold those in liver tissues, with the exception of TFP, which showed 4.6-fold the amount in liver tissues. Amounts in the seminiferous tubules were far less than those in the liver tissues, less than 0.21-fold, with the exception of TFP, which showed 1.4-fold the amount in liver tissues. The relative contents of mitochondrial fatty acid β-oxidation enzymes were 0.229–0.088 for the first-step enzymes VLCAD, LCAD, MCAD, and SCAD; 0.252 for the second-step enzyme, MH; 0.123 for the third-step enzyme, HADH; and 0.003 and 0.364 for the fourth-step enzymes MTL1 and TFP. The interstitial tissues contained mitochondrial fatty acid β-oxidation enzymes in amounts comparable to those of liver tissues, whereas the seminiferous tubules contained far less, with the exception of TFP. When the amounts were compared between the interstitial tissues and the seminiferous tubules, the amounts of all mitochondrial fatty acid β-oxidation enzymes were far less in the seminiferous tubules. The distribution of CS, examined as a control, showed similar values for both the interstitial tissues and the seminiferous tubules. Relative values of gene expression of fatty acid β-oxidation enzymes in testicular tissues compared between the interstitial tissues and seminiferous tubules were also examined (Table 1). The values in seminiferous tubules were one tenth those of the interstitial tissues, indicating that the magnitude of gene expression of each fatty acid β-oxidation enzyme in the seminiferous tubules is far smaller than that in the interstitial tissues.
Figure 4.
Analysis of the separation of testicular tissues. Light micrographs of the seminiferous tubules (A) and the interstitial tissue (B), and electrophorogram of their polypeptides (C). Three samples prepared separately from three animals were subjected to electrophoresis with 10 μg of protein for interstitial tissues (I), and with 80 μg of protein for seminiferous tubules (S). The positions of the standard proteins are indicated. Note that the separated interstitial tissue is devoid of seminiferous tubules, and vice versa, and that seminiferous tubules and interstitial tissues show quite different polypeptide profiles.
Figure 5.
Immunoblot analysis of the interstitial tissues and seminiferous tubules of the testis. The separated preparations of the interstitial tissues (I) and the seminiferous tubules (S) with 1 μg of protein were analyzed with pooled liver from three rats (L) with 1 μg of protein. The lanes marked S ×5 show blots with five times the amount of protein (5 μg). Note that all of the mitochondrial fatty acid β-oxidation enzymes are abundantly present in the interstitial tissue, whereas the signals in the seminiferous tubule are very faint, when compared with the liver tissues. In contrast, CS is present in both the interstitial tissue and the seminiferous tubule in amounts similar to those in liver tissue. (See Figure 2 legend for abbreviations.)
Table 1.
Contents of mitochondrial fatty acid β-oxidation enzymes and their gene expressions in the separated preparations of interstitial tissues and seminiferous tubules of the testis
| Liver | Interstitial tissues | Seminiferous tubules | Ratio S/I | DNA microarray S/I | ||
|---|---|---|---|---|---|---|
| VLCAD | * | 1.0 | 0.679 ± 0.058 | 0.155 ± 0.011 | 0.229 | 0.182 |
| LCAD | * | 1.0 | 0.897 ± 0.064 | 0.007 ± 0.005 | 0.007 | 0.103 |
| MCAD | * | 1.0 | 0.598 ± 0.034 | 0.049 ± 0.012 | 0.081 | 0.079 |
| SCAD | * | 1.0 | 1.320 ± 0.171 | 0.116 ± 0.089 | 0.088 | 0.087 |
| MH | * | 1.0 | 0.514 ± 0.116 | 0.129 ± 0.030 | 0.252 | 0.092 |
| HADH | * | 1.0 | 0.941 ± 0.090 | 0.124 ± 0.027 | 0.132 | 0.050 |
| MTL1 | * | 1.0 | 1.451 ± 0.242 | 0.048 ± 0.022 | 0.033 | 0.055 |
| TFP | * | 1.0 | 4.490 ± 0.329 | 1.636 ± 0.136 | 0.364 | 0.400 |
| CS | n.s. | 1.0 | 2.652 ± 0.080 | 2.878 ± 0.395 | 1.085 | 1.419 |
The quantity of each enzyme in the interstitial tissues and seminiferous tubules of the testis relative to the liver tissues was estimated on the immunoblots (see Figure 5). The relative value of the signals for testicular tissues against those for liver tissues is expressed as the average ± SD. The ratio S/I expresses the ratio of the amount of an enzyme in the seminiferous tubules to that in the interstitial tissues. Asterisk, the values for the interstitial tissues and the seminiferous tubules are significantly different, p<0.05; n.s., values are not significantly different. The intensity of gene expression of each enzyme of mitochondrial β-oxidation in the interstitial tissues and seminiferous tubules was analyzed by DNA microarray. The ratio S/I expresses the gene expression of the amount of an enzyme in the seminiferous tubules to that in the interstitial tissues. Note that the relative amounts and gene expressions of fatty acid β-oxidation enzymes in the seminiferous tubules against the interstitial tissues are about 1/10. VLCAD, very long chain acyl-CoA dehydrogenase; LCAD, long-chain acyl-CoA dehydrogenase; MCAD, medium-chain acyl-CoA dehydrogenase; SCAD, short-chain acyl-CoA dehydrogenase; MH, enoyl-CoA hydratase; HADH, 3-hydroxyacyl-CoA dehydrogenase; MTL1, 3-ketoacyl-CoA thiolase; TFP, trifunctional protein; CS, citrate synthase.
Immunofluorescence Microscopy at High-power Magnification by CLSM
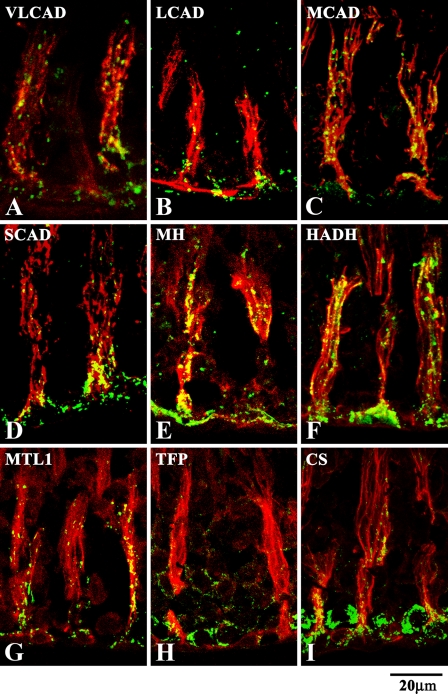
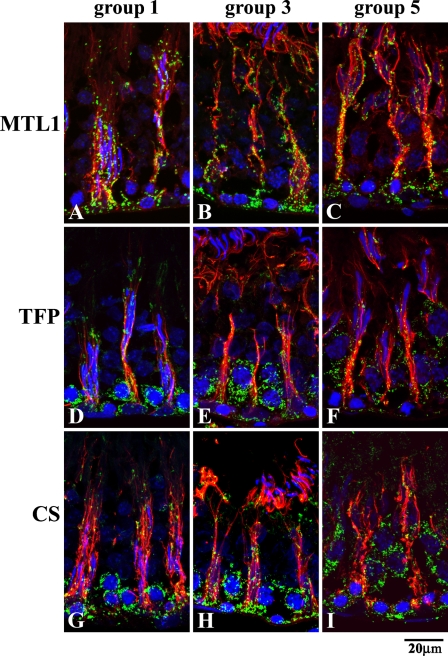
Detailed microscopic examination of the seminiferous epithelium was made with regard to the type of mitochondrial fatty acid β-oxidation enzymes (Figure 6) and the cycle of the seminiferous epithelium (Figure 7). Granular staining of Sertoli cells was obtained for all types of mitochondrial fatty acid β-oxidation enzymes (Figures 6A–6H). Spermatogenic cells were not labeled with these antibodies, except for TFP, for which a distinctive staining in spermatogenic cells, especially in spermatocytes, was observed (Figure 6H). In the seminiferous epithelium stained for CS to show the presence of mitochondria, both Sertoli cells and spermatogenic cells were clearly labeled (Figure 6I). The differences in the localization of MTL1, TFP, and CS at various stages of the maturation of the seminiferous epithelium are shown in Figures 7A–7I. Observation of the seminiferous epithelium was done based on its cycle, stages I-XIV described as groups 1–5, to see whether any change in the localization of mitochondrial fatty acid β-oxidation enzymes occurs. Micrographs of MTL1, as a representative of mitochondrial fatty acid β-oxidation enzymes, for which only Sertoli cells were positive in the seminiferous epithelium, are presented in Figures 7A–7C. The types of cells positive for the staining did not change in the cycle of the seminiferous epithelium (Figures 7A–7I). Micrographs of TFP, a mitochondrial fatty acid β-oxidation enzyme, for which both Sertoli cells and spermatogenic cells were positive in the seminiferous epithelium, are presented in Figures 7D–7F. Micrographs of CS, a TCA cycle enzyme, for which both Sertoli cells and spermatogenic cells were positive in the seminiferous epithelium, are presented in Figures 7G–7I. The types of cells showing localization of mitochondrial fatty acid β-oxidation enzymes are consistently the same, irrespective of stage.
Figure 6.
Immunofluorescent micrographs of seminiferous tubules observed at high-power magnification, at stage V–VI, stained for mitochondrial fatty acid β-oxidation enzymes , VLCAD (A), LCAD (B), MCAD (C), SCAD (D), MH (E), HADH (F), MTL1 (G), TFP (H), and CS (I) as a marker for mitochondria (green) and tyrosinated α-tubulin (red) as a marker for Sertoli cells. Note that Sertoli cells in the seminiferous epithelium are positive for the staining for mitochondrial fatty acid β-oxidation enzymes, whereas spermatogenic cells are negative, except that both Sertoli cells and spermatogenic cells are positive for TFP. Both Sertoli cells and spermatogenic cells are positive for CS. (See Figure 2 legend for abbreviations.)
Figure 7.
Immunofluorescent micrographs of seminiferous tubules observed at high-power magnification, stained for mitochondrial fatty acid β-oxidation enzymes, MTL1 (A–C) and TFP (D–F), and CS (G–I) as a marker for mitochondria (green), tyrosinated α-tubulin (red) as a marker for Sertoli cells, and 4′,6-diamino-2-phenylindole for nuclear staining, at various stages expressed as three groups (1, 3, and 5), to show the difference in the localization of enzymes among the stages. Note that the staining patterns are the same among all the groups.
Immunoelectron Microscopy
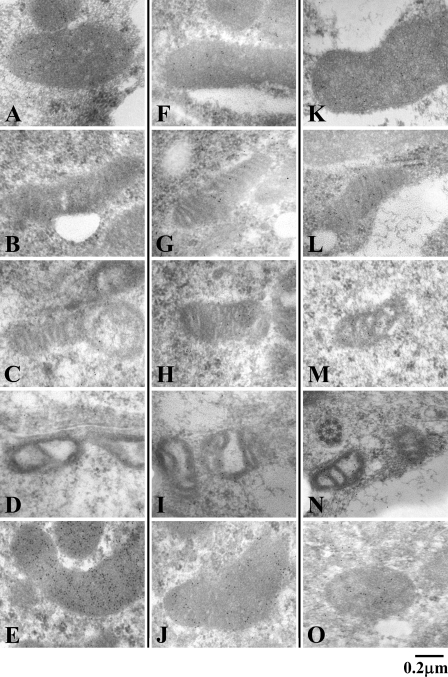
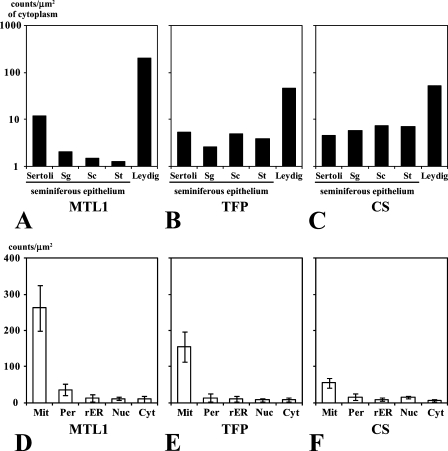
Antibodies to MTL1, TFP, and CS were employed in the light microscopic observation, in which the labeling of mitochondria by gold particles was clearly visualized. Staining intensities of mitochondrial fatty acid β-oxidation enzymes varied with the antibodies employed in the analysis and the cell type. Mitochondria in Leydig cells and Sertoli cells were positively stained for MTL1, but those in spermatogenic cells were relatively weakly labeled (Figures 8A–8E). In contrast, mitochondria in all types of seminiferous epithelial cells and Leydig cells were positively stained for TFP, although the staining intensity was low (Figures 8F–8J). Similarly, mitochondria of all types of seminiferous epithelial cells and Leydig cells were positively stained for CS (Figures 8K–8O). The immunolabel concentration for MTL1 in Leydig cells was higher than in cells of seminiferous tubules (Figure 9A). Higher immunolabel concentration for MTL1 in Sertoli cells than in other types of cells of seminiferous epithelium was noticed. The immunolabel concentrations for TFP and CS were also higher in Leydig cells than in cells of seminiferous tubules (Figures 9B and 9C). The labeling densities of mitochondria for MTL1, TFP, and CS were higher than those in other cellular compartments in Leydig cells (Figures 9D–9F). Low labeling densities of peroxisomes, which are known to contain a peroxisomal fatty acid β-oxidation system (Nemali et al. 1988), were noticed. Low labeling densities of compartments other than mitochondria show the specificity of the immunolabeling.
Figure 8.
Immunoelectron micrographs of mitochondria in the cells of the seminiferous epithelium at stage V–VI. Sertoli cell (A,F,K), type B spermatogonium (B,G,L), primary spermatocyte (C,H,M), spermatid (D,I,N), and Leydig cell (E,J,O), stained for MTL1 (A–E), TFP (F–J), and CS (K–O). Note that mitochondria of Sertoli cells and Leydig cells are strongly positive for the staining for MTL1, TFP, and CS; in contrast, the staining intensity of spermatogenic cells varies among the three enzymes.
Figure 9.
Quantitation of immunocytochemically visualized MTL1, TFP, and CS in every type of cell in rat testis, Leydig cells (Leydig) in the interstitial tissues, Sertoli cells (Sertoli), and germ cells (Sg, type B spermatogonium; Sc, primary spermatocyte; St, spermatid) in the seminiferous epithelium. Relative amounts of enzymes in these cells were evaluated by the immunolabel concentrations (A–C). The background staining was evaluated by the labeling densities of gold particles for mitochondria (Mit), peroxisomes (Per), rough-surfaced endoplasmic reticulum (rER), nuclei (Nuc), and cytoplasmic matrix (Cyt) of Leydig cells (D–F). Error bars indicate mean ± SD. Note that the immunolabel concentrations of three types of enzymes for Leydig cells are higher than those for cells in the seminiferous epithelium. Note also that the labeling densities of peroxisomes and the other cellular compartments were distinctively lower than those of mitochondria, irrespective of enzymes. These differences were statistically significant.
Discussion
In the present study, the localization of the individual enzymes of the mitochondrial fatty acid β-oxidation system in the testis was described. In addition to the immunohistochemical localization of these enzymes to the interstitial tissues and their near total absence in the seminiferous tubules, quantitative immunoblot analysis also showed most of them to be much less in the seminiferous tubules than in the interstitial tissues. The abundance of each enzyme in the interstitial tissues was roughly comparable to that in the liver, the kidney, and the heart (Cook et al. 2000). The extraordinarily small amounts of most mitochondrial fatty acid β-oxidation enzymes, especially LCAD and SCAD, in the seminiferous tubules may suggest that the reaction catalyzed by these enzymes is very limited in the seminiferous tubules, and that this is a characteristic feature of this tissue. A previous study (Cook et al. 2000) reported that the individual mitochondrial fatty acid β-oxidation enzymes are coordinately expressed, the ratios of the individual enzymes being similar in liver, kidney, and heart, providing a proper control of the metabolic flow in this system. However, we found the seminiferous tubule to have different ratios of enzyme contents. The seminiferous tubules would thus appear to be the first example of a tissue whose amounts of individual mitochondrial fatty acid β-oxidation enzymes are highly limited.
Light and electron microscopic immunohistochemistry demonstrated the presence of the full set of mitochondrial fatty acid β-oxidation enzymes in Leydig cells in the interstitial tissues and in Sertoli cells in the seminiferous epithelium, whereas most of these enzymes were either absent or present only in small amounts in spermatogenic cells. Although their ultrastructures are different, mitochondria are ubiquitous cell organellae in all types of cells and tissues, including all types of cells in the testis (Brokelmann 1963; Mori and Christensen 1980). Mitochondria are thus present in Leydig cells in the interstitial tissue and in all types of cells in seminiferous epithelium. Together with the functional difference of these cells, i.e., germinal cells for spermatogenesis, Leydig cells for producing testosterone, and Sertoli cells for supporting functions related to spermatogenesis, the different amounts of fatty acid β-oxidation enzymes in the mitochondria suggest functional differences among the mitochondria themselves, and such differences have not been investigated hitherto with regard to nutrient metabolism. The distribution of the enzymes as presented in the present study may indicate that mitochondria in various cell types differ not only in morphology but also in function. Energy metabolism in the seminiferous tubule has been considered to have features quite its own, in that the most important energy metabolite used in the spermatogenic cells is lactate produced by Sertoli cells from glucose (Boussouar and Benahmed 2004). The presence of a mitochondrial fatty acid β-oxidation system, together with previous reports on the existence of factors that transport fatty acids: fatty acid binding protein (Kingma et al. 1998), fatty acid transporter (Gillot et al. 2005), carnitine palmitoyl transferase 1 (McGarry 2001), and peroxisome proliferator-activated receptor α (Braissant et al. 1996), which regulates the transcription of genes of fatty acid β-oxidation enzymes in Sertoli cells, may indicate that such a metabolic system is indeed present in the Sertoli cells.
Nothing has been reported about the relationship between this metabolic system and diseases of the testis with regard to mitochondrial fatty acid β-oxidation, although it is known that defective metabolism in the peroxisomal fatty acid β-oxidation system results in male infertility (Berger and Gartner 2006; Huyghe et al. 2006). To determine the role of the mitochondrial fatty acid β-oxidation system in reproduction, further study is needed to clarify its role in the testis, which will involve analysis of isolated Leydig cells, Sertoli cells, or spermatogenic cells, together with research into the blood–testis barrier to show what types of nutrients including fatty acids can be transported through it.
Acknowledgments
This research was partially supported by Grants-in-aid for Young Scientists, number 19791129 (to MF) and number 20791286 (to KA), and a Matching Fund Subsidy for Private Universities (to NU) from the Ministry of Education, Culture, Sports, Science and Technology of Japan.
The authors are grateful to Dr. Takashi Hashimoto, Professor Emeritus of Shinshu University and Visiting Professor of Fujita Health University, for his valuable support throughout the course of the research.
This article is distributed under the terms of a License to Publish Agreement (http://www.jhc.org/misc/ltopub.shtml). JHC deposits all of its published articles into the U.S. National Institutes of Health (http://www.nih.gov/) and PubMed Central (http://www.pubmedcentral.nih.gov/) repositories for public release twelve months after publication.
References
- Amrolia P, Sullivan MHF, Garside D, Baldwin SA, Cooke BA (1988) An investigation of glucose uptake in relation to steroidogenesis in rat testis and tumour Leydig cells. Biochem J 249:925–928 [DOI] [PMC free article] [PubMed] [Google Scholar]
- Aoyama T, Peters JM, Iritani N, Nakajima T, Furihata K, Hashimoto T, Gonzalez FJ (1998) Altered constitutive expression of fatty acid-metabolizing enzymes in mice lacking the peroxisome proliferator-activated receptor α (PPARα). J Biol Chem 273:5678–5684 [DOI] [PubMed] [Google Scholar]
- Bendayan M, Reddy JK (1982) Immunocytochemical localization of catalase and heat-labile enoyl-CoA hydratase in the livers of normal and peroxisome proliferator-treated rats. Lab Invest 47:364–369 [PubMed] [Google Scholar]
- Berger J, Gartner J (2006) X-linked adrenoleukodystrophy: clinical, biochemical and pathogenetic aspects. Biochim Biophys Acta 1763:1721–1732 [DOI] [PubMed] [Google Scholar]
- Bloom W, Fawcett D (1975) A Textbook of Histology, 10th ed. Philadelphia, WB Saunders Company
- Boussouar F, Benahmed M (2004) Lactate and energy metabolism in male germ cells. Trends Endocrinol Metab 15:345–350 [DOI] [PubMed] [Google Scholar]
- Braissant O, Foufelle F, Scotto C, Dauca M, Wahli W (1996) Differential expression of peroxisome proliferator-activated receptors (PPARs): tissue distribution of PPAR-α, -β, and -γ in the adult rat. Endocrinology 137:354–366 [DOI] [PubMed] [Google Scholar]
- Brokelmann J (1963) Fine structure of germ cells and Sertoli cells during the cycle of the seminiferous epithelium in the rat. Z Zellforsch Mikrosk Anat 59:820–850 [PubMed] [Google Scholar]
- Cook WS, Yeldandi AV, Rao MS, Hashimoto T, Reddy JK (2000) Less extrahepatic induction of fatty acid β-oxidation enzymes by PPAR α. Biochem Biophys Res Commun 278:250–257 [DOI] [PubMed] [Google Scholar]
- Cooke HJ, Saunders PT (2002) Mouse models of male infertility. Nat Rev Genet 3:790–801 [DOI] [PubMed] [Google Scholar]
- De Duve C (1984) The mitochondria: respiration and aerobic energy retrieval. In A Guided Tour of the Living Cell. New York, Scientific American, 148–166
- Gillot I, Jehl-Pietri C, Gounon P, Luquet S, Rassoulzadegan M, Grimaldi P, Vidal F (2005) Germ cells and fatty acids induce translocation of CD36 scavenger receptor to the plasma membrane of Sertoli cells. J Cell Sci 118:3027–3035 [DOI] [PubMed] [Google Scholar]
- Grootegoed JA, Jansen R, van der Molen HJ (1984) Spermatogenic cells in the germinal epithelium utilize α-ketoisocaproate and lactate, produced by Sertoli cells from leucine and glucose. Ann N Y Acad Sci 438:557–560 [DOI] [PubMed] [Google Scholar]
- Hashimoto T, Fujita T, Usuda N, Cook W, Qi C, Peters JM, Gonzalez FJ, et al. (1999) Peroxisomal and mitochondrial fatty acid β-oxidation in mice nullizygous for both peroxisome proliferator-activated receptor α and peroxisomal fatty acyl-CoA oxidase. Genotype correlation with fatty liver phenotype. J Biol Chem 274:19228–19236 [DOI] [PubMed] [Google Scholar]
- Hayashi Y, Iida S, Sato Y, Nakaya A, Sawada A, Kaji N, Kamiya H, et al. (2007) DNA microarray analysis of type 2 diabetes-related genes co-regulated between white blood cells and livers of diabetic Otsuka Long-Evans Tokushima Fatty (OLETF) rats. Biol Pharm Bull 30:763–771 [DOI] [PubMed] [Google Scholar]
- Huyghe S, Schmalbruch H, De Gendt K, Verhoeven G, Guillou F, Van Veldhoven PP, Baes M (2006) Peroxisomal multifunctional protein 2 is essential for lipid homeostasis in Sertoli cells and male fertility in mice. Endocrinology 147:2228–2236 [DOI] [PubMed] [Google Scholar]
- Ikeda Y, Okamura-Ikeda K, Tanaka K (1985) Purification and characterization of short-chain, medium-chain, and long-chain acyl-CoA dehydrogenases from rat liver mitochondria. Isolation of the holo- and apoenzymes and conversion of the apoenzyme to the holoenzyme. J Biol Chem 260:1311–1325 [PubMed] [Google Scholar]
- Izai K, Uchida Y, Orii T, Yamamoto S, Hashimoto T (1992) Novel fatty acid β-oxidation enzymes in rat liver mitochondria. I. Purification and properties of very-long-chain acyl-coenzyme A dehydrogenase. J Biol Chem 267:1027–1033 [PubMed] [Google Scholar]
- Jutte NH, Grootegoed JA, Rommerts FF, van der Molen HJ (1981) Exogenous lactate is essential for metabolic activities in isolated rat spermatocytes and spermatids. J Reprod Fertil 62:399–405 [DOI] [PubMed] [Google Scholar]
- Kingma PB, Bok D, Ong DE (1998) Bovine epidermal fatty acid-binding protein: determination of ligand specificity and cellular localization in retina and testis. Biochemistry 37:3250–3257 [DOI] [PubMed] [Google Scholar]
- Laemmli UK (1970) Cleavage of structural proteins during the assembly of the head of bacteriophage T4. Nature 227:680–685 [DOI] [PubMed] [Google Scholar]
- Leblond CP, Clermont Y (1952) Definition of the stages of the cycle of the seminiferous epithelium in the rat. Ann N Y Acad Sci 55:548–573 [DOI] [PubMed] [Google Scholar]
- Lowry OH, Rosebrough NJ, Farr AL, Randall RJ (1951) Protein measurement with the Folin phenol reagent. J Biol Chem 193:265–275 [PubMed] [Google Scholar]
- Markwell MA, Haas SM, Tolbert NE, Bieber LL (1981) Protein determination in membrane and lipoprotein samples: manual and automated procedures. Methods Enzymol 72:296–303 [DOI] [PubMed] [Google Scholar]
- McGarry JD (2001) Travels with carnitine palmitoyltransferase I: from liver to germ cell with stops in between. Biochem Soc Trans 29:241–245 [DOI] [PubMed] [Google Scholar]
- Miyanari Y, Atsuzawa K, Usuda N, Watashi K, Hishiki T, Zayas M, Bartenschlager R, et al. (2007) The lipid droplet is an important organelle for hepatitis C virus production. Nat Cell Biol 9:1089–1097 [DOI] [PubMed] [Google Scholar]
- Mori H, Christensen AK (1980) Morphometric analysis of Leydig cells in the normal rat testis. J Cell Biol 84:340–354 [DOI] [PMC free article] [PubMed] [Google Scholar]
- Moriyama T, Srere PA (1971) Purification of rat heart and rat liver citrate synthases. J Biol Chem 246:3217–3223 [PubMed] [Google Scholar]
- Mruk DD, Cheng CY (2004) Sertoli-Sertoli and Sertoli-germ cell interactions and their significance in germ cell movement in the seminiferous epithelium during spermatogenesis. Endocr Rev 25:747–806 [DOI] [PubMed] [Google Scholar]
- Nemali MR, Usuda N, Reddy MK, Oyasu K, Hashimoto T, Osumi T, Rao MS, et al. (1988) Comparison of constitutive and inducible levels of expression of peroxisomal beta-oxidation and catalase genes in liver and extrahepatic tissues of rat. Cancer Res 48:5316–5324 [PubMed] [Google Scholar]
- Reddy J, Svoboda D (1972a) Microbodies (peroxisomes) identification in interstitial cells of the testis. J Histochem Cytochem 20:140–142 [DOI] [PubMed] [Google Scholar]
- Reddy J, Svoboda D (1972b) Microbodies (peroxisomes) in the interstitial cells of rodent testes. Lab Invest 26:657–665 [PubMed] [Google Scholar]
- Reddy JK, Hashimoto T (2001) Peroxisomal β-oxidation and peroxisome proliferator-activated receptor α: an adaptive metabolic system. Annu Rev Nutr 21:193–230 [DOI] [PubMed] [Google Scholar]
- Robinson R, Fritz IB (1981) Metabolism of glucose by Sertoli cells in culture. Biol Reprod 24:1032–1041 [DOI] [PubMed] [Google Scholar]
- Srere PA (1969) Citrate synthase. Methods Enzymol 13:3–11 [Google Scholar]
- Towbin H, Staehelin T, Gordon J (1979) Electrophoretic transfer of proteins from polyacrylamide gels to nitrocellulose sheets: procedure and some applications. Proc Natl Acad Sci USA 76:4350–4354 [DOI] [PMC free article] [PubMed] [Google Scholar]
- Uchida Y, Izai K, Orii T, Hashimoto T (1992) Novel fatty acid β-oxidation enzymes in rat liver mitochondria. II. Purification and properties of enoyl-coenzyme A (CoA) hydratase/3-hydroxyacyl-CoA dehydrogenase/3-ketoacyl-CoA thiolase trifunctional protein. J Biol Chem 267:1034–1041 [PubMed] [Google Scholar]
- Usuda N, Kong Y, Hagiwara M, Uchida C, Terasawa M, Nagata T, Hidaka H (1991a) Differential localization of protein kinase C isozymes in retinal neurons. J Cell Biol 112:1241–1247 [DOI] [PMC free article] [PubMed] [Google Scholar]
- Usuda N, Yokota S, Hashimoto T, Nagata T (1986) Immunocytochemical localization of D-amino acid oxidase in the central clear matrix of rat kidney peroxisomes. J Histochem Cytochem 34:1709–1718 [DOI] [PubMed] [Google Scholar]
- Usuda N, Yokota S, Ichikawa R, Hashimoto T, Nagata T (1991b) Immunoelectron microscopic study of a new D-amino acid oxidase-immunoreactive subcompartment in rat liver peroxisomes. J Histochem Cytochem 39:95–102 [DOI] [PubMed] [Google Scholar]
- Watanabe TK, Hansen LJ, Reddy NK, Kanwar YS, Reddy JK (1984) Differentiation of pancreatic acinar carcinoma cells cultured on rat testicular seminiferous tubular basement membranes. Cancer Res 44:5361–5368 [PubMed] [Google Scholar]
- Wenz JR, Hess RA (1998) Characterization of stage-specific tyrosinated α-tubulin immunoperoxidase staining patterns in Sertoli cells of rat seminiferous tubules by light microscopic image analysis. Tissue Cell 30:492–501 [DOI] [PubMed] [Google Scholar]


