Abstract
Second-harmonic generation (SHG) imaging is combined with coherent anti-Stokes Raman scattering (CARS) microscopy to follow the process of optical clearing in human skin ex vivo using dimethyl sulfoxide (DMSO) as the optical clearing agent. SHG imaging revealed that DMSO introduces morphological changes to the collagen I matrix. By carefully measuring the dynamic tissue attenuation of the coherent nonlinear signal, using CARS reference signals during the clearing process, it is found that DMSO reduces the overall SHG response from dermal collagen. Evidence is provided for a role of DMSO in compromising the structure of collagen fibers, associated with a reduction of the tissue’s scattering properties.
1. Introduction
Tissue turbidity, caused by scattering and absorption of light, is a limiting factor in optical biomedical imaging. It is directly responsible for the compromised light penetration in tissues and for loss of image contrast at greater depths [1]. Not surprisingly, the temporary reduction of scattering observed after tissue immersion in select nonreactive chemical agents has drawn the attention of biomedical microscopists. Hydroxy-terminated organic compounds such as sugars and alcohols and aprotic solvents such as dimethyl sulfoxide (DMSO) have been shown to act as optical clearing agents (OCAs) when applied to the tissue, enabling the acquisition of high contrast images at depths several times higher than seen in untreated tissue [2–4]. OCAs have been successfully employed in optical coherence tomography [5,6], linear and nonlinear fluorescence microscopy [7,8], and second-harmonic generation (SHG) microscopy [9,10] to improve image quality at greater depths in tissue, and skin tissue in particular.
Despite the useful application of the optical clearing effect, the clearing mechanism itself is not fully understood. Studies have shown that agents such as glycerol and DMSO introduce partial dehydration of the skin by replacing tissue water [6,8,11]. These findings suggest that a better refractive index matching between tissue components and their immediate solvent surrounding may provide an explanation of the clearing effect. Nonetheless, no clear correlation was found between tissue scattering reduction and the refractive index or osmolality of a particular OCA [12].
This lack of correlation provides support for models that include nonspecific interactions between the OCA and tissue components. In particular, it has been shown that glycerol reversibly alters collagen I fiber structure in skin tissues in situ [13]. Based on changes in the SHG signal of collagen, glycerol was shown to dissociate collagen fiber bundles into a sparser network of apparent fibrils. In vitro studies of collagen gels have furthermore demonstrated a strong correlation between collagen fibril solubility and the optical clearing potential of several chemical agents [14]. Indeed, changes in the structural organization of collagen, which constitutes 77% of dry weight of the dermis, are expected to significantly alter the scattering properties of the tissue [15]. While it is evident that OCAs such as glycerol interact with tissue collagen, it is still unclear on what level dermal collagen structure is affected and how these structural changes contribute to a reduction in scattering. Electron microscopy and x-ray analysis suggest that glycerinated collagen fibers are decomposed into microfibrils by dilating the interfibrillar space [16]. In situ optical imaging studies show a significant drop in the SHG response from tissue collagen when treated with glycerol, which indicates that the structural rearrangement also reduces the second-order nonlinearity of collagen [9,13]. However, a quantitative analysis of the loss of SHG was complicated by changing tissue scattering properties during the optical clearing process and the remaining uncertainty about the microscopic origin of the second-order response. This lack of quantitative assessment has prevented a direct correlation between the temporary reduction of tissue scattering and the OCA-induced changes in tissue collagen as seen with SHG.
One of the complications with quantitatively determining fibrillar collagen SHG response in tissues is the strong dependence of the signal intensity on scattering. SHG originates from the focal volume and produces coherent radiation in both the forward and backward directions, contingent on the packing and orientation of the collagen fibrils. In tissues, postgeneration scattering of SHG light brings about a redistribution of the forward and backward propagating portions, leading to detectable signals in the epidetection channel. Hence, both forward- and backward-detected SHG signal levels are significantly influenced by the tissue scattering properties [17,18], which makes the collagen SHG particularly difficult to interpret quantitatively in dynamic optical clearing studies.
In this study, we combine SHG imaging of dermal collagen with simultaneous coherent anti-Stokes Raman scattering (CARS) measurements of the local OCA concentration. This multimodal approach allows us to correlate the changing SHG pattern to two previously elusive parameters: the dynamic tissue attenuation as experienced by the propagating coherent signal and the actual concentration of the OCA in the focal volume. An attractive feature of our approach is that the CARS signal originates from the same focal volume as the SHG signal. Contrary to SHG from collagen, the CARS signal from a homogeneously distributed chemical species generates a coherent signal that is almost exclusively forward directed [19]. Hence, this well-defined CARS signal is an excellent reporter of the influence of postgeneration scattering effects on the SHG signal. In addition, by tuning into the vibrational resonance of the OCA, the CARS signal can be quantitatively related to the actual concentration of the agent in focus at any time during the clearing process.
Here we have chosen to follow changes in the structural organization of collagen during the clearing process induced by DMSO in human skin ex vivo. Like glycerol, DMSO exhibits a high optical clearing potential [12,20]. In addition, DMSO can be easily identified vibrationally through its strong symmetric CH3 stretching vibration, which shows only moderate overlap with the vibrational response of the native tissue components. It is our aim to correlate the changes in collagen organization to the actual concentration of DMSO in focus, and to determine how the collagen SHG signal changes when corrected for tissue scattering. It is expected that the scattering-free SHG signatures will reveal important information on the nature of structural changes of fibrillar collagen as induced by DMSO.
2. Materials and Methods
A. Materials
Cryopreserved, dermatomed human cadaver skin was obtained from Science Care Inc. (Phoenix, Ariz.). Each 1 mm thick sample had an intact stratum corneum and epidermis. A small (~1 × 1 cm) piece of skin was rinsed with phosphate buffered saline and placed dermal-side down on a glass coverslip. In our studies, we use an inverted microscope to examine the skin dermis directly through the coverslip. Strips of 0.12 mm double-sided adhesive sheet (Grace Bio-Labs, Bend, Ore.) were used to clamp the skin between two coverslips and stabilize the skin while allowing DMSO (Sigma-Aldrich St. Louis, Mo.) to diffuse passively through the side of the sample.
B. Nonlinear Multimodal Imaging
The pump and Stokes beams required for the CARS process were derived from a synchronously pumped optical parametric oscillator system. The 1064 nm, 7 ps pulses of a 76 MHz mode-locked Nd:vanadate laser source (High-Q, Hohenems, Austria) provided the Stokes radiation. A portion of the same 1064 nm source was used to pump an optical parametric oscillator (Levante, Berlin, Germany), tunable in the 760–960 nm range, which delivered the pump beam for the CARS process. The frequency difference between the pump and the Stokes radiation was set to 2913 cm−1, corresponding to the symmetric CH3 vibration of DMSO. For the reported experiments, the pump beam is set to 812.2 nm, resulting in the generation of CARS signal at 656 nm. In addition, the 812.2 nm radiation also served as the driving beam for the SHG process. The collinearly overlapped pump and Stokes beams were passed through a laser scanner (Fluoview 300, Olympus, Center Valley, Pa.) and focused with a 20× UPLAPO objective (Olympus) into the sample. The average power at the sample was ~10 mW for the Stokes beam and 20 mW for the pump beam.
The inverted microscope (IX 71, Olympus) is equipped with four photomultiplier tubes (PMTs). In the forward direction, the SHG, CARS, and transmitted pump light are captured by a condenser lens (0.55 NA) and directed to a 760 nm long-wave pass dichroic mirror (z760xrdc, Chroma, Rockingham, Vt.). The transmitted light was detected by a fiber coupled PMT, whereas the reflected light was passed on to a dichoric mirror (FM02, Thorlabs, Newton, N.J.) for separating the SHG and forward (F-) CARS signals. The CARS detector consists of two 650 ± 40 nm bandpass filters (HQ650/40, Chroma) and a red-sensitive PMT, while the SHG detector includes a set of two 400 ± 40 nm bandpass filters and an PMT photodetector. In the backward (epi-) direction, E-CARS radiation was reflected off a 760 nm long-pass dichroic mirror, passed through a 650 ± 40 nm bandpass filter, and sent onto a PMT. All nonlinear signals were detected by red-sensitive PMTs (R3896, Hamamatsu, Hamamatsu City, Japan).
C. Optical Clearing Experiments
In this work, we have used pure 14 M DMSO as the clearing agent. We have chosen to work with undiluted DMSO in order to examine the effects of higher concentrations of the OCA on the tissue. Note that upon application of the DMSO on the skin, the clearing agent will be immediately diluted by the tissue water of the hydrated sample. One of the purposes of this study is to resolve the local DMSO concentration over a wide range (in volume %) and to correlate the OCA density with the structural rearrangements of the collagen fibrous network. Because the experiments are performed on tissue ex vivo, the process of tissue rehydration as seen in skin in vivo is absent in our study. Hence, in our studies we are primarily concerned with the details of DMSO-induced optical clearing and not with the reversible process associated with rehydration of the tissue.
DMSO was applied in portions of ~100 μL. Within a minute after application of DMSO, images (1.5 s per frame) were taken every 15 s from an area of interest ~1 mm from the cross-sectional tissue cut, on the application side of the tissue. Measurements were taken over a 3 h period. For each time point, an average of two images was taken. The focal plane was adjusted to a depth of ~25 μm into the dermis. While moderate CARS signals from tissue lipids were detected at 2913 cm−1, such contributions were easily separated from the much stronger CARS response of DMSO, especially at higher concentrations of the OCA.
Once collected, images were processed using ImageJ for quantitative analysis. The total CARS and SHG signals were corrected for background contributions and integrated over a spatial area of interest of at least 100 × 100 μm2.
D. Raman Spectroscopy
A 10 mW beam of 532 nm light from a frequency-doubled Nd:vanadate laser (Verdi, Coherent, Santa Clara, Calif.) was directed into the backport of the microscope frame and focused with the same objective used in the nonlinear studies. Raman scattered light was collected in the epigeometry, filtered with a 532 nm holographic notch filter (Kaiser, Ann Arbor, Mich.), and detected with a spectrometer (Spectra-Pro-150, Acton Research Corporation, Acton, Mass.) equipped with a cooled CCD camera (Princeton Instruments, Trenton, N.J.).
3. Results and Discussion
A. CARS as a Probe for DMSO Concentration
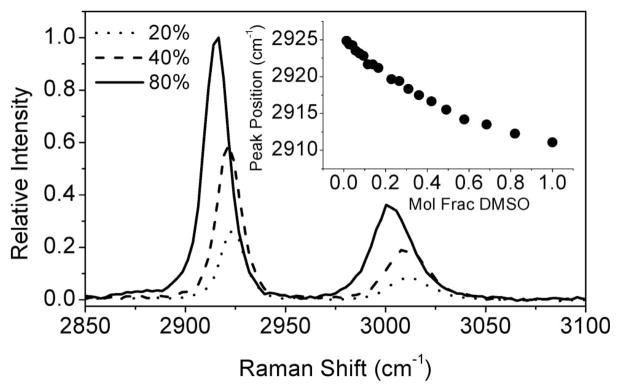
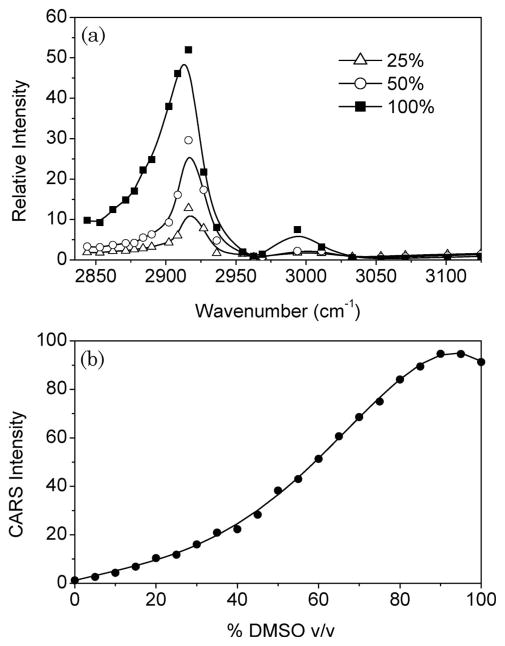
The CARS signal strength of the CH3 mode of DMSO provides, in principle, a handle for determining the concentration of our OCA in skin tissue. However, even in the absence of tissue scattering, the CARS signal intensity is not linearly proportional to the CH3-mode density. First, the CARS signal is dependent on the square modulus of the sum of the CH3-vibrational signal and the intrinsic electronic nonresonant background. The quadratic dependence and the entwining of resonant and nonresonant contributions complicates a straightforward assessment of the DMSO concentration. Second, when DMSO diffuses through the tissue matrix it is consequently diluted by the tissue water. The CH3-mode frequency is sensitive to the immediate molecular environment formed by the polar water molecules [21]. At higher water concentrations, the CH3 mode shifts to higher frequencies, as illustrated by Fig. 1. These changes are also reflected in the CARS spectra of DMSO–water mixtures depicted in Fig. 2(a).
Fig. 1.
Raman spectra of DMSO:water mixtures for different volume fractions of DMSO. The inset shows the shift of the center frequency of the CH3 symmetric stretch vibration for different mole fractions of DMSO in water.
Fig. 2.
CARS of DMSO for different volume fractions in water. (a) CARS spectra for different v/v% of DMSO in water. (b) Relative CARS intensity at 2913 cm−1 for increasing volume fractions of DMSO in water.
To reliably extract the DMSO concentration from the observed CARS signal, the above-mentioned effects have to be accounted for. We accomplish this by calibrating the CARS intensity measured at 2913 cm−1 as a function of DMSO concentration in water. The results are shown in Fig. 2(b). At low concentrations, an approximate quadratic dependence is observed. At higher concentrations, the shifting CH3-mode frequency leads to a reduction of the CARS signal, producing a maximum CARS signal at 92 volume % of DMSO and a subsequent CARS signal decline at higher concentrations. Below 92 v/v%, however, the observed CARS signal is uniquely related to a single DMSO concentration.
We will use the calibration curve in Fig. 2(b) to deduce the DMSO concentration from CARS tissue measurements. First, we will assume that the CH3 vibration is predominantly affected by the water concentration and that spectral shifts induced by other tissue components are negligible. This assumption is reasonable, given the high concentration of water in the tissue and the relative insensitivity of the CH3 vibration to apolar tissue components. Second, in nonscattering samples, the CARS signal at 2913 cm−1 can be directly related to the DMSO concentration through the calibration curve in Fig. 2(b).
A direct comparison is enabled when the CARS signal of a sample of unknown DMSO concentration is related to the signal obtained from two reference samples under the same imaging condition. Our reference samples are a 0 v/v% and a 50 v/v% aqueous DMSO solution. However, a direct comparison with the reference signal is compromised by the presence of scattering in the sample. In order to use our calibration curve, the effect of scattering on the CARS signal has to be factored out first, as discussed in the next section.
B. CARS as a Probe for Tissue Scattering
The total CARS signal from DMSO in a tissue sample is determined by both the DMSO concentration and the scattering properties of the tissue. During a tissue clearing experiment, both the DMSO concentration and the scattering properties of the tissue will change. Hence, a proper method of separating these two effects is required for a quantitative analysis of the tissue clearing process.
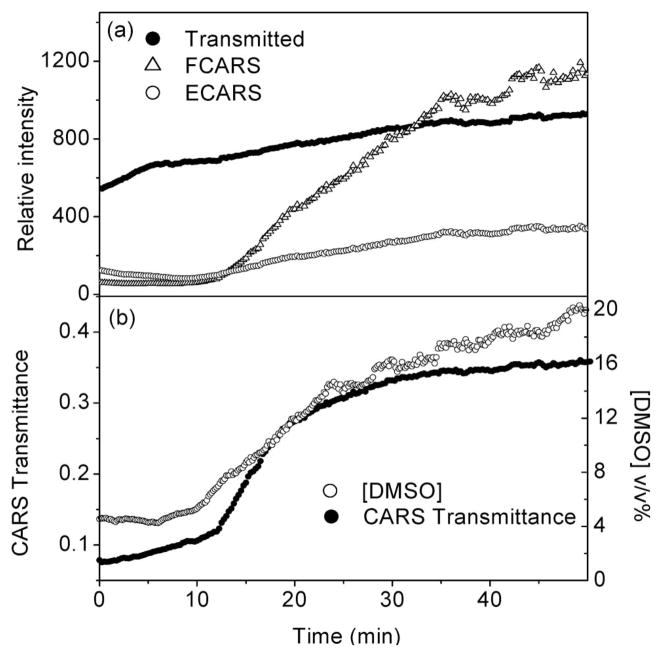
Figure 3 shows a typical evolution of the CARS signal as a function of time during DMSO-induced clearing of the skin. The clearing of the tissue is evident from the enhanced transmission of the incident pump light. As expected, the F-CARS signal grows as a result of the increasing DMSO concentration and the reduced scattering of the tissue. The total detected F-CARS light can be approximated as
Fig. 3.
CARS signal at 2913 cm−1 during skin optical clearing with DMSO. (a) F-CARS and E-CARS signals as a function of time after application of the clearing agent. The transmitted pump light (812.2 nm) is also shown. (b) Extracted transmittance of CARS radiation in the tissue and local concentration of the clearing agent during the optical clearing process.
| (1) |
where Sas(c) is the total CARS signal generated in the focal volume as a consequence of DMSO concentration c, gas is the time-dependent tissue attenuation coefficient at the anti-Stokes wavelength, and L is the total propagation length of the signal through the tissue. The efficiency of the collection optics and the detector is captured by the parameter fF. Note that both Sas(c) and gas are changing during the optical clearing process. In the E-CARS channel, an initial decrease is seen, followed by a steady rise of the CARS signal. This observation is consistent with the notion that E-CARS signal results from forward generated CARS signal that is subsequently backscattered in the epidirection [22]. The E-CARS signal can be modeled as
| (2) |
with fE the fraction of the backward-scattered light captured by the lens and the epidetector. From Eq. (2) it is evident that a reduction in gas is thus accompanied by a reduction of the E-CARS signal. The subsequent increase of the E-CARS signal is explained by the increasing contribution of S(c) relative to the changes in tissue scattering. The balancing between Sas(c) and tissue transmittance e−gasL determines the overall trend of the time-dependent E-CARS signal.
While both the F-CARS and E-CARS signals depend on the DMSO concentration c in focus, the ratio is independent of concentration. The tissue transmittance depends in the following way on the epi-to-forward CARS ratio:
| (3) |
The factor fF/fE can be determined from control experiments using the constant nonresonant CARS signal from the glass substrate as a reference, with and without a slab of scattering tissue. Note that this ratio is sensitive to the alignment of the microscope and needs to be determined prior to every skin optical clearing experiment. In Fig. 3(b) the extracted transmittance for the CARS radiation is plotted as a function of time. The observed trend is reminiscent of the transmission changes of the 812 nm pump light but differs in magnitude. By combining Eqs. (2) and (3), and by using the calibration curve in Fig. 2(b), the time-dependent DMSO concentration in the focal volume can be retrieved. The result is included in Fig. 3(b). This procedure thus allows a quantitative separation of the concentration and the attenuation variables. Note that our DMSO detection sensitivity in the dermis, compromised by resonant and non-resonant tissue components, is about 4%, which explains the offset of the concentration curve in Fig. 3(b).
C. Correlation between Scattering of CARS and SHG Contributions
While the transmittance for postgeneration CARS light due to tissue scattering can be conveniently attained, a direct characterization of the attenuation of SHG radiation is significantly more difficult to acquire. Unlike the CARS signal, which follows from a virtually homogeneous distribution of DMSO molecules in the focal volume at all times, the SHG signal depends on the details of the collagen organization in the focal probing spot. We can write the forward-detected SHG intensity as
| (4) |
with S2ω(r) the total SHG generated light at a particular location r of the focal volume in the sample and g2ω the attenuation coefficient at the SHG emission wavelength. Note that in this analysis we have omitted the effects of tissue scattering on the incident light. The motivation for this omission is twofold. First, pregeneration scattering during the first ~25 μm results in a much smaller effect on the nonlinear signals than the postgeneration scattering over ~1 mm of the tissue. We verified that postgeneration scattering affects the signal by more than an order of magnitude relative to pregeneration scattering of the incident light under all tissue conditions examined. Second, because both SHG and CARS stem from a second-order interaction of the 812 nm beam with the material, both signals are similarly affected by the scattering-induced changes to the incident pump light. The CARS signal also depends linearly on the 1064 nm Stokes beam. In the following analysis, we have assumed that the detected CARS signal is negligibly affected by scattering of the Stokes light over 25 μm of propagation through the dermis.
The total SHG radiation S(r)2ω is a complex function of collagen microfibrillar density and orientation. In addition, depending on the fibrillar alignment relative to the incident polarization, S(r)2ω produces forward- and backward-propagating portions of coherent light [23,24], which are subsequently affected by scattering in the tissue [17,25]. Hence, the ratio of forward detected light to backward detected SHG is a function of both S(r)2ω and tissue scattering. This notion complicates the use of the forward-to-backward SHG ratio for extracting the attenuation coefficient at the SHG emission wavelength. This is especially true during the clearing process, when the fibrillar arrangement is significantly altered during the time course of the experiment. Unraveling of thick μm-sized collagen fibers into tentatively much thinner microfibrils is accompanied by changing phase matching conditions, which enhances the relative contribution of epidirected coherent emission [18]. The S(r)2ω-related forward-to-backward ratio thus changes in an unknown fashion during the experiment, making an unreliable reporter of tissue scattering changes alone. Nonetheless, it is possible to relate the attenuation coefficient of the CARS radiation to the attenuation of the SHG light. Both signals are coherent and originate from the same focal volume. The difference in attenuation results predominantly from the chromatic differences in the tissue scattering coefficient at 656 nm (CARS) and 406 nm (SHG).
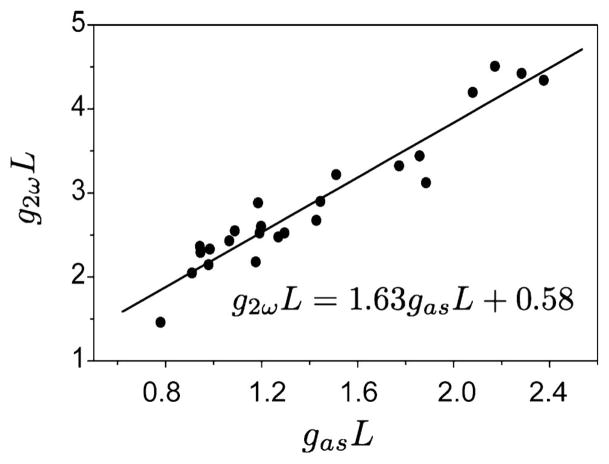
We have established a quantitative relationship between gas and g2ω in the following way. A constant light beam at 656 nm was produced through nonresonant anti-Stokes generation in a glass coverslip. A second light beam at 406 nm of constant power was generated by frequency doubling 812 nm laser light in a beta-barium borate crystal. Both beams were accurately overlapped in the focus of the same microscope objective lens as used in the imaging studies. About 10 μm beyond the focal volume, the two light beams were attenuated by a 1 mm thick skin sample treated with DMSO. At different levels of optical clearing, the relative attenuation of the 656 and 406 nm contributions were determined. The results are plotted in Fig. 4. A linear relation is found between the attenuation coefficients gas and g2ω. We will use this relation to correct the SHG signals for tissue scattering based on the retrieved attenuation coefficient from the CARS signals.
Fig. 4.
Comparison of the tissue attenuation coefficient at the SHG wavelength (406 nm) and at the CARS wavelength (656 nm) measured at different levels of optical clearing. The solid line is a linear fit, which is used to correlate the CARS transmittance to the SHG transmittance.
D. Structural Changes of Collagen During Skin Optical Clearing
Figure 5(a) shows a typical SHG image of collagen in the dermis [13,26]. Figure 5(b) depicts the SHG collagen distribution 3 h after DMSO application. The continuous fibrous collagen structures are replaced by a rather discontinuous pattern of knots and threads. Similar signatures have been observed in skin in situ treated with glycerol [13]. The similarity of the apparent effects of DMSO and glycerol seems to suggest that DMSO exhibits a similar ability to alter the structure of collagen fibers as previously observed for glycerol.
Fig. 5.
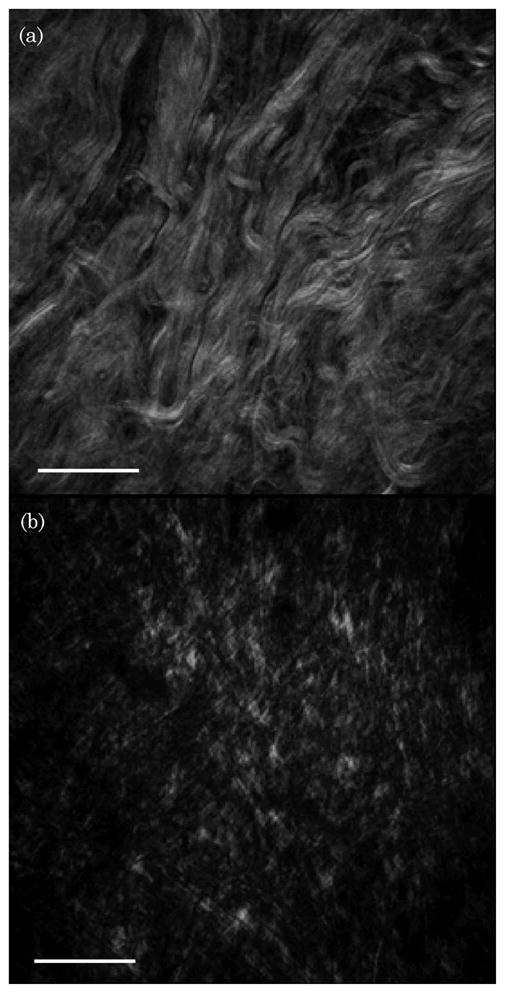
SHG images of dermal collagen (a) before and (b) after 3 h of immersion with DMSO. The scale bar is 50 μm.
However, it is unclear from these images whether the qualitative morphological changes are accompanied by an actual reduction of the SHG signal. A decrease of the SHG signal would provide evidence that DMSO affects the high density and crystalline organization of microfibrils on a sub-μm level, as opposed to a simple geometric arrangement of the thick (μm-sized) collagen fibers in the dermis. Such information can only be obtained conclusively after correcting the images for light scattering in the tissue.
E. Correlation of Corrected Collagen Changes with DMSO Concentration
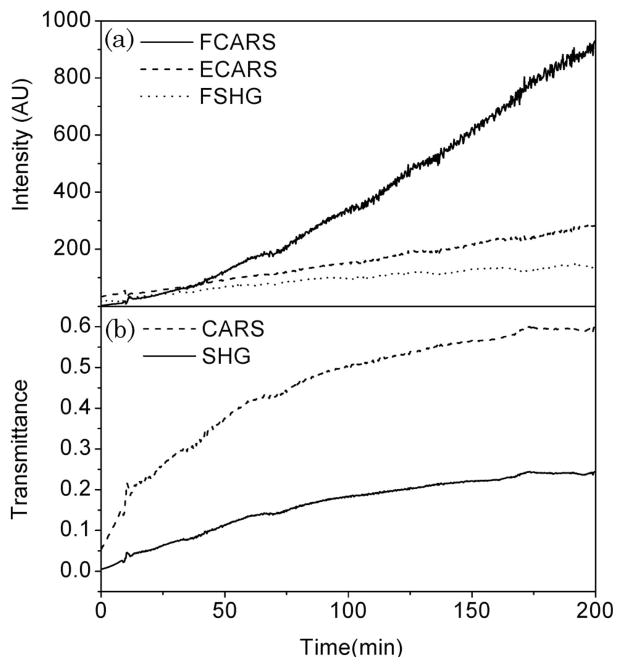
Figure 6(a) displays a trial in which the forward detected SHG signal of skin collagen is detected along with the simultaneously collected F-CARS and E-CARS signals during treatment with DMSO, over a time course of more than 3 h. As expected, the CARS signals increase dramatically as a consequence of higher DMSO concentration and tissue clearing. The detected SHG signal also rises during the time course of the experiment, a reflection of the decreasing attenuation of the skin tissue.
Fig. 6.
Variation of SHG, F-CARS, and E-CARS signals during skin optical clearing (a). The extracted transmittance of the CARS radiation, along with the derived transmittance for the SHG light, is given in (b).
Using Eq. (3), the time-dependent transmittance of the forward CARS signal from this trail can be extracted. In addition, the results of Fig. 4 allow us to determine the attenuation of the SHG radiation generated in the tissue. The extracted transmittance curves for both the CARS and SHG signals are given in Fig. 6(b). It is seen that the OCA-induced transparency of the skin approaches its maximum values of ~60% transmission at 656 nm and ~20% transmission at 406 nm after 3 h of immersion. Hence, the increasing CARS intensity 3 h after application of DMSO [Fig. 6(a)] cannot be explained by changes in the scattering properties of the tissue. Instead, the increase is solely due to the growing concentration of DMSO in the tissue. We found that the variation of the transmittance between different samples was large, with maximum transmittance values at 656 nm in the range 0.35–0.65 (n = 5), which we attribute to the difference in tissue thickness and the variation in the maximum DMSO concentration reached in the skin. Nonetheless, because our method provides direct access to the tissue transmittance and DMSO concentration, a direct comparison between these two parameters can be made irrespective of the sample thickness.
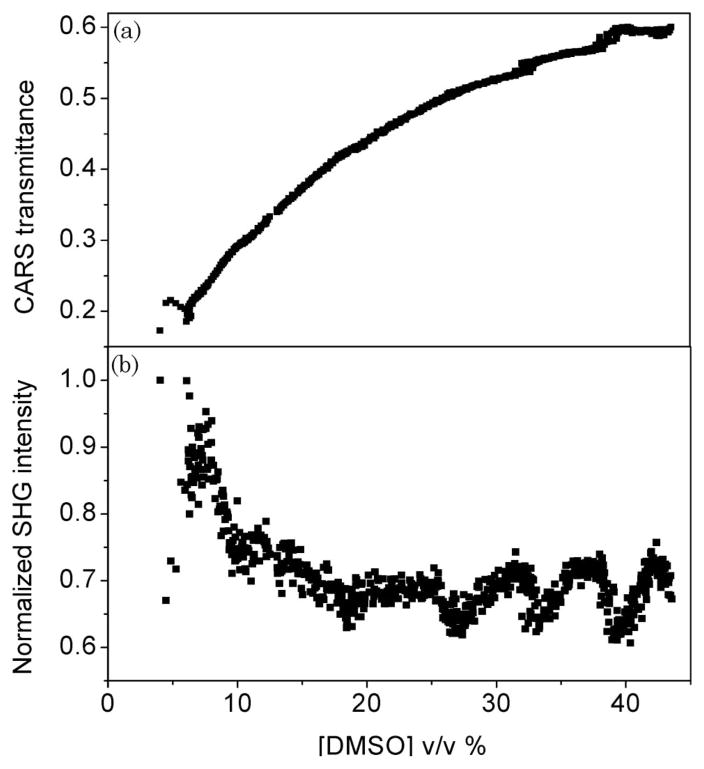
With the aid of the calibration curve in Fig. 2(b), the changing tissue scattering properties in terms of the CARS transmittance can be plotted as a function of DMSO concentration. The results are given in Fig. 7(a). We find for all samples (n = 5) that a reduction in tissue scattering is not observed at DMSO concentrations higher than ~40 v/v% in the tissue. Within the assumption that the DMSO-induced changes to the tissue optical properties take effect on a time scale faster than the gradual process of increasing OCA concentration, we conclude that maximum reduction of tissue scattering is obtained at a local DMSO concentration of 40 volume % in the tissue.
Fig. 7.
CARS transmittance and SHG response as a function of DMSO concentration. (a) CARS transmittance for different concentrations of DMSO. (b) Extracted SHG signal as a function of DMSO concentration. The oscillatory trend observed at higher concentrations relates to long-term laser fluctuations rather than changes in the SHG response.
Using the results found in Fig. 4, the SHG signal is corrected for postgeneration scattering and S2ω is determined. Figure 7(b) summarizes our findings. Whereas the detected signal in Fig. 6(a) shows an increase of the SHG channel, after correction for scattering a decrease of the integrated S2ω is observed. Although we found it difficult to determine the exact SHG signal at low DMSO concentrations (<4%), we observe a clear decrease of the SHG signal during optical clearing for each skin sample examined.
The optical clearing effect of glycerol in rat tail tendon samples has been partially explained in terms of swelling of the overall tissue [10]. It was suggested that while the overall morphology of collagen was retained, the hyperosmolarity of glycerol increases the interfibril spacing, thereby lowering the number of scattering objects per unit volume. In our skin optical clearing experiments with DMSO, we rule out a significant contribution from swelling to the observed decrease of the SHG signal. The skin sample was fixed between two glass slides, preventing significant changes in the thickness of the sample. Only a small increase (<5%) in the overall volume of the skin sample was observed after DMSO immersion, which cannot quantitatively account for the reduced scattering properties. Rather than a lower density of SHG-generating elements on a macroscopic level due to tissue swelling, our results clearly point towards the possible role of DMSO in altering the structure of collagen on a sub-μm level. The dense packing of collagen I fibrils into highly organized fibers with diameters that extend onto the μm scale has often been suggested as the source for the strong SHG response of skin tissue collagen [24,27,28]. When these highly organized “domains” are affected, a reduction of the SHG signal is expected. Both a lower density at the sub-μm level due to increased spacing between the microfibrils or a diminished degree of organizational symmetry will affect the second-order nonlinear response from the fiber. Our study thus suggests that the intrinsic structure of the collagen fibers in human skin ex vivo is modified by DMSO, and possibly associated with the reduced scattering properties of the tissue.
In addition, we clearly observe that, while the tissue optical scattering properties continue to change for concentrations up to 40 v/v%, the SHG signal settles to a constant value at a much lower concentration of ~20 v/v%. From this we infer that the DMSO-induced structural changes to the collagen fibers cannot be the only mechanism responsible for the optical clearing effect. The continuing clearing with increasing DMSO concentration up to 40 v/v% fits a model that includes the improved refractive index matching between the liquid matrix and tissue components. Our results thus indicate that both the decomposition of the highly ordered collagen fibers and the process of refractive index matching play a likely role in the underlying physics of skin optical clearing.
Our experiments in skin ex vivo show that changes to the collagen structure are substantial for concentrations below 20 v/v%. Because of tissue rehydration, it is expected that the local DMSO concentration in the dermis in vivo stays well below 40 v/v% during the optical clearing process. Consequently, the DMSO-induced modifications to dermal collagen could play an important role in optical clearing in skin in vivo as well.
4. Conclusion
In this study we have combined SHG imaging of collagen fibers with CARS microscopy to quantitatively follow the process of DMSO-induced optical clearing in human skin ex vivo. By detecting both the F-CARS and E-CARS signals, we were able to extract two hitherto elusive parameters during the clearing process: (1) the time-dependent attenuation coefficient for the coherent nonlinear signal and (2) the local concentration of the OCA. Using this multimodal approach, the SHG signal from collagen I fibers was corrected for the changing scattering properties of the skin during clearing and correlated with the local concentration of the OCA.
Our measurements suggest that DMSO interferes with the highly organized structure of thick collagen fibers, possibly by changing the interfibril spacing on a sub-μm scale. DMSO-assisted decomposition of collagen continues up to concentrations of 20 volume % of the clearing agent. Higher concentrations do not further compromise the SHG response from dermal collagen. On the other hand, reduction of tissue scattering persists up to DMSO concentrations of 40 v/v%. These combined observations emphasize that both the mechanism of refractive index matching and the structural changes of collagen I fibers play an important role in reducing the scattering properties during skin optical clearing.
Part of this work is financially supported by the Laser Microbeam and Medical Program (LAMMP), a National Institutes of Health (NIH) Biomedical Technology Resource Center (2 P41 RR001192-29). B. Choi acknowledges financial support from the Mabel and Arnold Beckman Foundation.
References
- 1.Tuchin V. Tissue Optics. SPIE Press; 2007. [Google Scholar]
- 2.Tuchin VV, Maksimova IL, Zimnyakov DA, Kon IL, Mavlutov AH, Mishin AA. Light propagation in tissues with controlled optical properties. J Biomed Opt. 1997;2:401–417. doi: 10.1117/12.281502. [DOI] [PubMed] [Google Scholar]
- 3.Vargas G, Chan EK, Barton JK, Rylander HG, Welch AJ. Use of an agent to reduce scattering in skin. Lasers Surg Med. 1999;24:133–141. doi: 10.1002/(sici)1096-9101(1999)24:2<133::aid-lsm9>3.0.co;2-x. [DOI] [PubMed] [Google Scholar]
- 4.Tuchin VV. Optical clearing of tissues and blood using the immersion method. J Phys D. 2005;38:2497–2518. [Google Scholar]
- 5.He Y, Wang RK. Dynamic optical clearing effect of tissue impregnated with hyperosmotic agents and studied with optical coherence tomography. J Biomed Opt. 2004;9:200–206. doi: 10.1117/1.1629682. [DOI] [PubMed] [Google Scholar]
- 6.Wang RK, Xu X, Tuchin VV, Elder JB. Concurrent enhancement of imaging depth and contrast for optical coherence tomography by hyperosmotic agents. J Opt Soc Am B. 2001;18:948–953. [Google Scholar]
- 7.Cicchi R, Pavone FS. Contrast and depth enhancement in two-photon microscopy of human skin ex vivo by use of optical clearing agents. Opt Express. 2005;13:2337–2344. doi: 10.1364/opex.13.002337. [DOI] [PubMed] [Google Scholar]
- 8.Vargas G, Chan KF, Thomsen SL, Welch AJ. Use of osmotically active agents to alter optical properties of tissue: effects on the detected fluorescence signal measured through skin. Lasers Surg Med. 2001;29:213–220. doi: 10.1002/lsm.1110. [DOI] [PubMed] [Google Scholar]
- 9.Plotnikov S, Junaja V, Isaacson AB, Mohler WA, Campagnola PJ. Optical clearing for improved contrast in second harmonic generation imaging of skeletal muscle. Biophys J. 2006;90:328–339. doi: 10.1529/biophysj.105.066944. [DOI] [PMC free article] [PubMed] [Google Scholar]
- 10.LaComb R, Nadiarnykh O, Carey S, Campagnola PJ. Quantitative second harmonic generation imaging and modeling of the optical clearing mechanism in striated muscle and tendon. J Biomed Opt. 2008;13:021109. doi: 10.1117/1.2907207. [DOI] [PubMed] [Google Scholar]
- 11.Xu X, Wang RK. The role of water desorption on optical clearing of biotissue: Studied with near infrared reflectance spectroscopy. Med Phys. 2003;30:1246–1253. doi: 10.1118/1.1576228. [DOI] [PubMed] [Google Scholar]
- 12.Choi B, Tsu L, Chen E, Ishak TS, Iskandar SM, Chess S, Nelson JS. Determination of chemical agent optical clearing potential using in vitro human skin. Lasers Surg Med. 2005;36:72–75. doi: 10.1002/lsm.20116. [DOI] [PubMed] [Google Scholar]
- 13.Yeh AT, Nelson JS, Tromberg BJ. Reversible dissociation of collagen in tissues. J Invest Dermatol. 2003;121:1332–1335. doi: 10.1046/j.1523-1747.2003.12634.x. [DOI] [PubMed] [Google Scholar]
- 14.Hirshburg J, Choi B, Nelson JS, Yeh AT. Collagen solubility correlates with skin optical clearing. J Biomed Opt. 2006;11:040501. doi: 10.1117/1.2220527. [DOI] [PubMed] [Google Scholar]
- 15.Odland GF. Physiology, Biochemistry and Molecular Biology of the Skin. Oxford University Press; 1991. Structure of the Skin; pp. 3–62. [Google Scholar]
- 16.Leonardi L, Ruggeri A, Roveri N, Bigi A, Reale E. Light microscopy, electron microscopy, and x-ray diffraction analysis of glycerinated collagen fibers. J Ultrastruct Res. 1983;85:228–237. doi: 10.1016/s0022-5320(83)90109-0. [DOI] [PubMed] [Google Scholar]
- 17.Légaré F, Pfeffer C, Olsen BR. The role of backscattering in SHG tissue imaging. Biophys J. 2007;93:1312–1320. doi: 10.1529/biophysj.106.100586. [DOI] [PMC free article] [PubMed] [Google Scholar]
- 18.Chu SW, Tsai SP, Chan MC, Sun CK, Hsiao IC, Lin CH, Chen YC, Lin BL. Thickness dependence of optical second harmonic generation in collagen fibrils. Opt Express. 2007;15:12005–12010. doi: 10.1364/oe.15.012005. [DOI] [PubMed] [Google Scholar]
- 19.Cheng JX, Volkmer A, Xie XS. Theoretical and experimental characterization of coherent anti-Stokes Raman scattering microscopy. J Opt Soc Am B. 2002;19:1363–1375. [Google Scholar]
- 20.Wang RK, He XY, Elder JB. Investigation of optical clearing of gastric tissue immersed with hyperosmotic agents. IEEE J Sel Top Quantum Electron. 2003;9:234–242. [Google Scholar]
- 21.Cansell F, Fabre D, Petitet JP. Raman spectroscopy of DMSO and DMSO-H2O mixtures (32 mol % of DMSO) up to 20GPa. Physica B. 1992;182:195–200. [Google Scholar]
- 22.Evans CL, Potma EO, Puoris’haag M, Côte D, Lin C, Xie XS. Chemical imaging of tissue in vivo with video-rate coherent anti-Stokes Raman scattering (CARS) microscopy. Proc Natl Acad Sci USA. 2005;102:16807–16812. doi: 10.1073/pnas.0508282102. [DOI] [PMC free article] [PubMed] [Google Scholar]
- 23.Williams RM, Zipfel WR, Webb WW. Interpreting second-harmonic generation images of collagen I fibrils. Biophys J. 2005;88:1377–1386. doi: 10.1529/biophysj.104.047308. [DOI] [PMC free article] [PubMed] [Google Scholar]
- 24.LaComb R, Nadiarnykh O, Townsend SS, Campagnola PJ. Phase matching considerations in second-harmonic generation from tissues: effects on emission directionality, conversion efficiency, and observed morphology. Opt Commun. 2008;281:1823–1832. doi: 10.1016/j.optcom.2007.10.040. [DOI] [PMC free article] [PubMed] [Google Scholar]
- 25.Nadiarnykh O, LaComb RB, Campagnola PJ. Coherent and incoherent SHG in fibrillar cellulose matrices. Opt Express. 2007;15:3348–3360. doi: 10.1364/oe.15.003348. [DOI] [PubMed] [Google Scholar]
- 26.LaComb R, Nadiarnykh O, Campagnola PJ. Quantitative second harmonic generation imaging of the diseased state osteogenesis imperfecta: experiment and simulation. Biophys J. 2008;94:4504–4515. doi: 10.1529/biophysj.107.114405. [DOI] [PMC free article] [PubMed] [Google Scholar]
- 27.Pena AM, Boulesteix T, Dartigalongue T, Schanne-Klein MC. Chiroptical effects in the second harmonic signal of collagens I and IV. J Am Chem Soc. 2005;127:10314–10322. doi: 10.1021/ja0520969. [DOI] [PubMed] [Google Scholar]
- 28.Zipfel WR, Williams RM, Christie R, Nikitin AY, Hyman BT, Webb WW. Live tissue intrinsic emission microscopy using multiphoton-excited native fluorescence and second harmonic generation. Proc Natl Acad Sci USA. 2003;100:7075–7080. doi: 10.1073/pnas.0832308100. [DOI] [PMC free article] [PubMed] [Google Scholar]


