Abstract
In general, the most difficult task in developing devices for fluorescence ratiometric sensing is the isolation of signals from overlapping emission wavelengths. Wavelength discrimination can be achieved by using monochromators or bandpass filters, which often lead to decreased signal intensities. The result is a device that is both complex and expensive. Here we present an alternative system—a low-cost standalone optical fluorimeter based on luminescence lifetime assisted ratiometric sensing (LARS). This paper describes the principle of this technique and the overall design of the sensor device. The most significant innovation of LARS is the ability to discriminate between two overlapping luminescence signals based on differences in their luminescence decay rates. Thus, minimal filtering is required and the two signals can be isolated despite significant overlap of luminescence spectra. The result is a device that is both simple and inexpensive. The electronic circuit employs the lock-in amplification technique for the signal processing and the system is controlled by an onboard microcontroller. In addition, the system is designed to communicate with external devices via Bluetooth.
INTRODUCTION
Over the past 2 decades fluorescence has become the dominant detection and sensing technique in the life sciences. Many new applications based on fluorescence spectroscopy have been developed ranging from basic research to standard routine assays. Fluorescence has been exploited in assays for environmental and clinical studies, cell identification and sorting in flow cytometry and cell and tissue imaging in medical science. In spite of all these applications, the principles of fluorescence measurements remain the same. A majority of the applications are based on fluorescence intensity measurements because of the relatively simple instrument requirements. However, though simple and easy to implement, systematic errors are associated with intensity measurements that make it difficult to obtain the high accuracy that some assays may demand. These sources of errors can be due to the fluctuating intensities of the excitation light, the concentration of the fluorescent probe, inner filter effects or as trivial as variation in the distance between the sample and the excitation light or detector.1 Some of these problems can be avoided by measuring the fluorescence lifetime or decay which is independent of the excitation light intensity. However, one setback of the time-resolved method is that most available fluorophores have lifetimes in the range of nanoseconds to picoseconds. Thus, time-resolved fluorescence measurements often require sophisticated instrumentation such as narrow pulsed light sources and fast detectors. Determining the ratio of fluorescence intensities at two wavelengths is an alternative approach independent of both excitation light and sample concentrations. This method requires the fluorophore system to have two distinct fluorescence signals. Because the two signals are generated under the same conditions, any changes in the excitation light or fluorophore concentration would have the same effect on the two signals. Thus, the ratio of the signals should remain unaffected. In the conventional ratiometric approach it is desirable that the fluorescence signals be at different wavelengths with no overlap. However, minimal to significant overlap always exists in practice. To accomplish successful signal discrimination, costly optical gratings, prisms, or highly attenuating band pass filters are necessary. In the case of band pass filters, a rotating filter wheel is needed to alternate between the desired filters along the signal path. This mechanical component makes the system more complicated and less robust. Additionally, the process of limiting the signal within a narrow wavelength range always results in a considerable decrease in signal strength, which in turn requires more powerful but more expensive detectors.2
In previous papers, we reported an alternative approach, which is based on selectively exciting the two fluorophores with frequency modulated light.3, 4, 5 We call this lifetime assisted ratiometric sensing (LARS). In this paper, we describe the standalone fluorimeter that we designed and constructed based on the principles of LARS. The design innovation takes advantage of the lifetime difference of the fluorophores for signal discrimination rather than their wavelengths of emission. For this reason, a sophisticated optical filtering system is not required, unlike in the conventional ratiometric technique as described above. Additionally, rather than confining the signal to the emission at a narrow range of wavelengths, it is possible to collect the total emission of the fluorophores, thereby maximizing the signal. In fact, even completely overlapping signals can be satisfactorily discriminated. The potential of this technique is demonstrated with several commonly used fluorophores.
Our motivation for the development of this type of fluorimeter arose from biosensing applications using periplasmic binding proteins (PBPs).6, 7, 8 The PBPs are part of the gram-negative bacteria adenosine triphosphate-binding cassette transporter system, which shuttles various substrates from the periplasmic space to membrane-bound receptors. The PBPs have drawn much attention as sensors because they can be easily modified genetically, are water soluble, are highly sensitive (Kd in the submicro-to-micromolar levels), and are generally, extremely selective to their substrate. Another advantage is that the PBPs do not possess cysteine residues in their primary structures. Thus, for sensing purposes, it is trivial to engineer a cysteine residue into a predetermined position for labeling with a fluorescent dye.3, 9, 10 A polarity sensitive fluorophore such as acrylodan situated in an allosteric site can serve as a signal transducer for protein conformational changes associated with binding of the substrate. By measuring changes in the fluorescence intensity, the concentration of the substrate can then be calculated. To allow for ratiometric measurements using the PBP biosensors designed in our laboratory, a reference fluorophore was introduced to the N-terminal. As discussed above, this had the potential for more reliable determinations. Further development was driven by the need to recover overlapping fluorescence signals and to maximize sensitivity while simplifying the optics, leading to the implementation of the lifetime assisted discrimination approach.
THEORY
The intrinsic fluorescence lifetime τ is the time it takes for a population of fluorophores in the lowest excited state (S1) to return to the ground state (S0). In the simplest example, the population of fluorophores in the excited state, C(t) at a certain time t can be described by the first order exponential equation
| (1) |
At t=τ,C0∕e fluorophores are in the excited state, while (1−e−1) are in the ground state. If at this time, the ground state molecules are exposed to a second Delta–Dirac excitation light pulse, the population of the excited molecules will again approach C0. Thus, the shorter the pulsation interval, the fewer molecules will be found in the ground state. In practice, it is difficult to count C(t), rather the fluorescence intensity, f(t), which is proportional C(t) is determined. Suppose in exciting a population of fluorophores, the single excitation pulse is replaced by intensity modulated excitation light, the resulting (de)modulated fluorescence will decrease in intensity with increasing excitation frequency. The dependence of the fluorescence intensity f to the lifetime of the fluorophore and the modulation frequency of the excitation light is described as11
| (2) |
For a system with multiple fluorophores the total fluorescence ftotal is the sum of the fi,
| (3) |
where fi is the fractional steady state fluorescence intensity of the fluorophore i and ω the angular modulation frequency in units of cycles per second. As shown in [Eq. 3] the modulated fluorescence can approach zero with increasing modulation frequency.
Assume a system containing two fluorophores A and B, where fluorophore A has a lifetime of 1 μs and fluorophore B has a lifetime of 1000 μs. If this system is excited consecutively with ω1=100 kHz and ω2 100 kHz then
| (4) |
| (5) |
| (6) |
Note that at ω1, only the fluorescence from A is detected. Hence, with alternating modulation frequencies, the fluorescence signals from two fluorophores can be discriminated provided that there is a great difference in their lifetimes. This is also true even when the fluorescence signals completely eclipse.
CONSTRUCTION OF THE FLUORIMETER
Optical setup
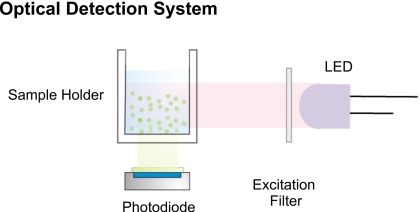
The optical setup of the fluorimeter has a simple design (Fig. 1). It consists of a light-emitting diode (LED) as the excitation source, a mini PMT as the photodetector and a sample holder. The sample holder is illuminated by the LED from the side while the PMT is located 90° underneath the cell. This geometry minimizes the exposure of the photodetector to excitation light. Additionally, this orientation makes it easier to replace the sample holder to a microfluidic chip, which is a more desirable sample system for many devices, particularly where miniaturization is crucial. For the applications presented in this paper the light source is a UV-LED RL5-UV1215 (Superbrightleds, Missouri, USA). The short wavelength pass filter 420SWP (Intor, New Mexico, USA) and a long wavelength pass filter FEL0450 (Thorlabs, New Jersey, USA) were positioned in front of the excitation source and before the photodetector, respectively. An additional dichroic filter DT-Green (Linos, Goettingen, Germany) is employed to further cutoff the undesired longer wavelength light. This LED and filter combination can be altered accordingly for other applications.
Figure 1.
Optical setup of the fluorimeter.
Electronic Implementation
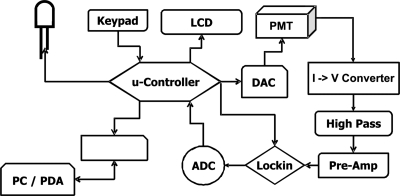
The fluorimeter described in this paper is a standalone device specifically designed for LARS (Fig. 2). The microcontroller ATmega128 (Atmel, California, USA) is used for data acquisition and processing, as well as communication with the user. The ATmega128 is an 8-bits RISC based microcontroller operating at 16 MHz. Among other features it has two 16-bits timers, two programmable universal asynchronous receiver∕transmitters (UARTs) and external interrupt sources. The two UARTs are connected to a serial liquid crystal display (LCD) and to a Bluetooth transmitter; the external interrupts are used for the keypad. The user has the choice to run the fluorimeter either using the keypad and the LCD or via Bluetooth from a computer using the WINDOWS software developed for the fluorimeter. Apart from these tasks the microcontroller also generates the intensity modulation of the LED and the reference modulation for the lock-in amplifier which is employed for the signal processing. In addition, it regulates the sensitivity of the photomultiplier tube (PMT) with an external digital-to-analog converter by adjusting the control voltage of the PMT to the previously set value. The fluorescence signal acquisition components of the system comprise of the PMT, PMT R7400 (Hamamatsu, New Jersey, USA), a transimpedance amplifier (OPA129, Texas Instruments, USA) followed by a second order Sallen-Key highpass filter (to remove dc offset caused by ambient light), a preamplifier (the latter ones are built on the OPA277, Texas Instruments, USA) and the lock-in amplifier AD630 (Analog, USA). The OPA129 was chosen for the I-to-V conversion as it has an ultralow bias current of 100 fA allowing for the signal offset to be minimized. The low pass filter of the lock-in amplifier operates with a cutoff frequency of 10 Hz. The recovered signal after the lock-in amplifier is converted to digital data by the serial 16-bits ADC TLC4545 (Texas Instruments, USA), which is connected to the microcontroller via serial peripheral interface. The digitalized signal is displayed on the LCD and transmitted to the computer via Bluetooth.
Figure 2.
Schematic block diagram of the electronic circuit of the fluorimeter.
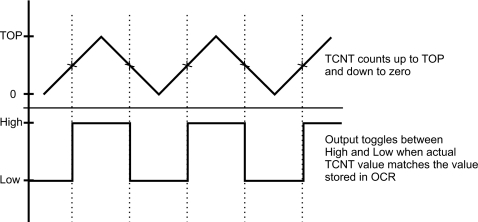
The modulation of the light from the LED and the lock-in reference signal are generated by one of the on-chip timers of the microcontroller. The timer consists of the timer∕counter TCNT and output compare units. In order to modulate the signal of a designated output pin the output compare unit is set to the “phase and frequency corrected pulse width modulation mode.” In this mode the 16-bits timer∕counter TCNT counts from zero to a predetermined value (TOP) stored in a special register. Each time the TOP-value is reached, the TCNT counts down to zero. During the counting process the timer also compares its actual value with that stored in the “output compare register.” When a match is reached the output pin toggles between high and low thereby modulating the output signal (Fig. 3). The frequency generated by this method can be anywhere between zero and 16 MHz and can be freely set by the user according to the equation12
| (7) |
The software of the microcontroller allows for a range of frequencies up to 16 MHz. This opens up a broader choice of fluorophore systems for different applications. At the start of a measurement, the microcontroller modulates the LED and generates the reference signal with a low frequency so that the fluorescence of both fluorophores can be fully recovered. Then the same procedure is repeated at a higher frequency to demodulate the fluorescence of the longer-lived fluorophore. At this higher frequency, the recovered signal is only that of the fluorophore with the shorter lifetime. By subtracting the first result by the second, the fluorescence of the long lived fluorophore can be obtained and the ratio between the two fluorescence signals can be calculated.
Figure 3.
Timing diagram of the output modulation in the phase and frequency corrected pulse width modulation mode.
RESULTS
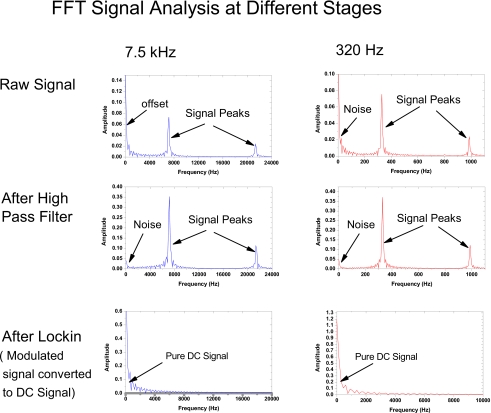
We evaluated the performance of the optoelectronics by using the fluorescent dye, 8-hydroxypyrene-1,2,6-trisulfonate (HPTS), which has a lifetime of about 5 ns. The dye was excited with an UV-LED (λmax=400 nm) at 7.5 kHz and 300 Hz modulation frequencies. The fast Fourier transform (FFT) analysis of the signal at different stages along the signal processing chain is shown in Fig. 4. The raw signal right after the I-to-V conversion contains apart from the fluorescence signal and its third harmonic, a dc offset that is considerably greater than the actual signal. This is caused partly by the ambient light and partly by the electronic cir cuit itself. This offset is minimized by introducing a high pass filter. This filtered signal goes through the lock-in amplifier13, 14 designed to recover only the signal whose modulation frequency is locked to the reference signal. As can be seen in the bottom plots for both frequencies, the recovered signal exhibited minimal high frequency noise.
Figure 4.
FFT analysis at different stages of the signal processing steps. The measurement was carried out by a digital oscilloscope Tektronix TSD2000B.
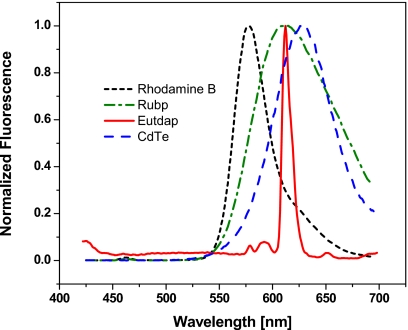
To demonstrate the lifetime assisted discrimination method, the fluorimeter is employed to measure the fluorescence of various commonly used fluorophores at different modulation frequencies. The fluorophores rhodamine B, CdTe quantum dots, tris-(2,2′-bipyridine) ruthenium(II) [Rubp], and rris-(dibenzoylmethane)-5-amino-(1,10-phenanthroline) europium (III) [Eu(tdap)] are chosen because their excitation wavelengths fall within the emission of the built-in LED. Aqueous solutions of these fluorophores at room temperature exhibit lifetimes of 1.5 ns, ∼3 ns, 400 ns, and 0.15 ms, respectively. Figure 5 shows the emission spectra of these fluorophores. The emission maxima of Eu(tdap), Rubp, and CdTe quantum dots are centered between 612–625 nm with almost complete overlap between the fluorescence spectra. The emission maximum of rhodamine B is slightly blueshifted at 586 nm but still with considerable overlap. Note that the Eu(tdap) spectrum is very narrow with a base width of only 50 nm.
Figure 5.
Normalized fluorescence spectra of rhodamine B, Rubp, CdTe quantum dots, and Eu(tdap) in aqueous solution.
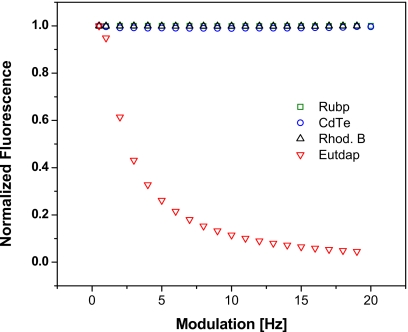
To demonstrate the effect of LED modulation frequency the fluorimeter was programmed to run between 500 Hz and 20 kHz. As shown in Fig. 6, the fluorescence signals of rhodamine B, Rubp, and CdTe quantum dots (designated as the “short-lived” fluorophores) are unaffected by increasing modulation frequency. In stark contrast, the fluorescence of Eu(tdap) (designated as the “long-lived” fluorophore) drops exponentially and approaches the asymptote at the higher frequencies. At 10 kHz Eu(tdap) fluorescence decreased to 12% of the value at 500 Hz.
Figure 6.
Modulation sweep carried out with the aqueous solutions of rhodamine B, CdTe quantum dots, Rubp, and Eu(tdap). These solutions contain only one fluorophore.
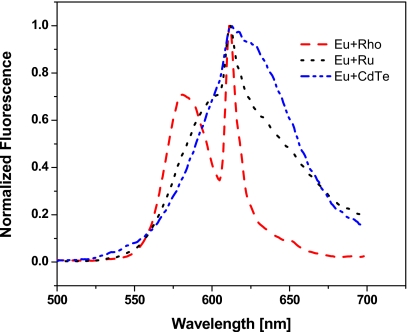
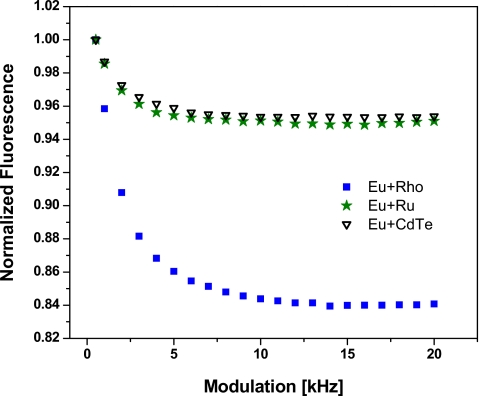
In a second experiment dual-fluorophores solutions of Eu(tdap) and each one of the three short-lived dyes rhodamine B, Rubp, and CdTe were subjected to the same frequency sweep as the pure solutions. The experiment is meant to demonstrate the discrimination of the fluorescence emission of two fluorophores combined in the same solution. Furthermore, the experiment should show that the recovery of the individual fluorescence is independent of the distance between the fluorescence peaks and their relative height. Hence, in addition to the choice of three different dyes, the relative fluorescence intensity of Eu(tdap) in the three dual-fluorophores solutions is varied by adjusting the concentration. This can be seen in the combined emission spectra of these solutions in Fig. 7. As previously noted in Fig. 5, the overlap between the emission spectra of these flurophores is extensive. Hence, conventional optical separation techniques would be inadequate to satisfactorily discriminate the overlapping peaks. We show here that with the lifetime assisted discrimination method the signals can be easily recovered. The recovery of the fluorescence of the individual fluorophores in a mixture is independent of the distance between the fluorescence peaks on the emission spectra and independent of the height of the peaks. Figure 8 reveals that the fluorescence intensity of the dual-fluorophore solutions drop at higher modulation frequency as the fluorescence of Eu(tdap) is increasingly demodulated. At about 10 kHz the fluorescence of Eu(tdap) is practically completely demodulated. The reduced signal is the fluorescence intensity of the short-lived fluorophore. The fluorescence of the three mixtures decrease at different extent because the concentration of Eu(tdap) in the mixtures are different. Eu(tdap) contributes 0.17, 0.05, and 0.04, respectively, to the total normalized fluorescence of the solution Eu+Rho, Eu+Ru, and Eu+CdTe. These results are compared to the results obtained by the deconvolution of the spectra shown in Fig. 7. The approach of deconvolution is described in detail in Ref. 15. Using this method the combined spectra of dual fluorophores solutions are deconvoluted in spectra of the individual fluorophores. The fluorescence of the dyes is obtained by integration of the deconvoluted spectra. As shown in Table 1, the results achieved by the two approaches are comparable although not identical. The discrepancy of the data stems from the fact that the mathematical model of the deconvolution method is not perfect; hence the approach cannot deconvolute the spectra precisely without a certain error. On the other hand the PMT of our system is less sensitive in the longer wavelength regions. That explains why the fluorescence of Eu(tdap) from the rhodamine∕Eu(tdap) solution measured by our system is significantly lower than the deconvolution data. As shown in Fig. 7, the emission peak of rhodamine is found at around 580 nm while the emission of Eu(tdap) is located at 613 nm. Due to the lower sensitivity of the PMT at longer wavelengths, the emission of Eu(tdap) appears to be weaker than it actually is. Nevertheless, the experiments show that signal discrimination is possible whether the fluorescence spectra of the dyes are partially overlapped—as in the case of rhodamine B and Eu(tdap)—or completely eclipsed—as in the case of Rubp and Eu(tdap). The intensity of the fluorescence peaks in comparison with each other also plays no significant role. The signals can be fully recovered as long as the lifetimes are significantly different.
Figure 7.
Wavelength scan of dual-fluorophores solutions consisting of Eu(tdap) and one of the fluorophores rhodamin B (Eu+Rho), Rubp (Eu+Ru), and CdTe quantum dots (Eu+Qu). The fluorescence peak of Eu(tdap) is centered at 612/3 nm
Figure 8.
Modulation sweep carried out with the aqueous solutions of a mixture of Eu(tdap) with one of the following dyes rhodamine B (Eu+Rho), CdTe quantum dots (Eu+Qu), and Rubp (Eu+Ru). The concentration of Eu(tdap) in each of the mixture is varied to demonstrate signal discrimination.
Table 1.
Comparison of the signal recovery by the lifetime assisited discrimination method and the spectra deconvolution method.
| Fluorescence of Eu(tdap) in Eu+Rho | Fluorescence of Eu(tdap) in Eu+Ru | Fluorescence of Eu(tdap) in Eu+CdTe | |
|---|---|---|---|
| Lifetime assisted discrimination | 0.17 | 0.05 | 0.04 |
| Spectra deconvolution | 0.24 | 0.08 | 0.06 |
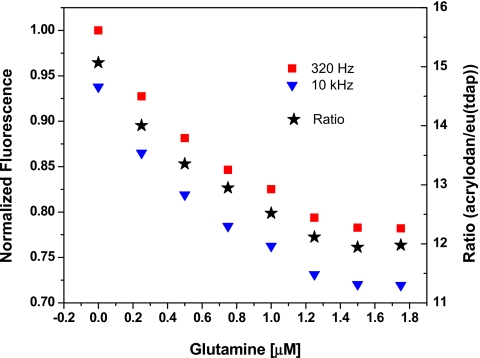
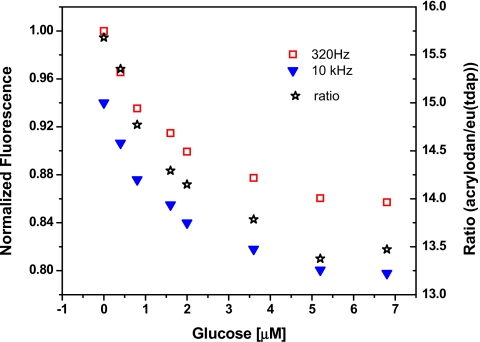
Finally, we applied the lifetime assisted ratiometric approach to measure glucose and glutamine using dual-labeled protein biosensors. These biosensors are the genetically modified glucose binding protein L255C and the glutamine binding protein S179C.5 A single cysteine amino acid is introduced by site-directed mutagenesis at a specific position in the binding protein sequence. The cysteine group is then used to covalently attach the polarity sensitive fluorophore acrylodan to the protein. For LARS applications, a Eu(tdap) dye is selectively attached to the N-terminal of the protein resulting in a dual-label where both the short and long-lived fluorophores are in the same protein molecule.
In the presence of substrate these proteins undergo a conformational change whereby the substrate becomes sequestered in the binding site. Through allosteric changes, the micro-environment surrounding the acrylodan label on the opposite side of the binding site changes from less polar to more polar. This in turn decreases the observed fluorescence intensity of the dye. It should be noted that the fluorescence of Eu(tdap) is unaffected by the substrate-induced conformational changes and therefore remains constant. By measuring the ratio of the fluorescence signals of acrylodan and Eu(tdap), the concentration of the substrate can be determined. For the measurements presented here, the dual labeled binding proteins are dissolved in 20 mM phosphate buffer at pH 8. The substrate (glucose or glutamine) is added to the protein solution and the measurements are carried out alternately at 300 Hz and 10 kHz at room temperature. The fluorescence intensities of acrylodan and Eu(tdap) and their ratio are calculated as in the previous experiments. The responses of the labeled proteins are shown in Figs. 910. The glucose detection range of the L255C is within 5 μM and that of the glutamine binding protein is found to be below 2 μM. Both proteins respond more sensitively at low concentrations of the substrate. The response can be described by an exponential decay curve.
Figure 9.
Response of a 5 μM glutamine binding protein S179C labeled with acrylodan and Eu(tdap) in 20 mM phosphate buffer to glutamine. The measurement is carried out at room temperature. The detection range is found to be below 2 μM.
Figure 10.
Response of a 7 μM solution of glucose binding protein S179C labeled with acrylodan and Eu(tdap) to glutamine. The measurement is carried out at room temperature. The detection range is found to be below 5 μM.
In conclusion, our standalone fluorimeter is able to discriminate the fluorescence of various dyes by utilizing the differences between the fluorophore lifetimes. The discrimination is achieved without expensive gratings or attenuating band pass filters. In addition, the fluorimeter is able to recover even completely eclipsed fluorescence signals which we believe is unmatched by traditional wavelength discrimination techniques using filters. Finally we demonstrated the utility of this technique in chemosensing and biosensing, as shown by the determination of glucose and glutamine. Due to the simplicity of the optical setup, future work will involve miniaturization of the system to a handheld device.
ACKNOWLEDGMENTS
This work was supported by grants from the U.S. Army (Contract No. W81XWH-04-1-0781) and the National Institutes of Health (Contract Nos. DK062990 and DK072465) to L.T. and Becton–Dickinson Technologies to H.L.
References
- Laczko G., Gryczynsky I., Wiczk W., Malak H., and Lakowicz J. R., Rev. Sci. Instrum. 61, 2331 (1990). 10.1063/1.1141360 [DOI] [Google Scholar]
- Kostov Y., Harms P., and Rao G., Anal. Biochem. 297, 105 (2001). 10.1006/abio.2001.5336 [DOI] [PubMed] [Google Scholar]
- Ge X., Tolosa L., and Rao G., Anal. Chem. 76, 1403 (2004). 10.1021/ac035063p [DOI] [PubMed] [Google Scholar]
- Tolosa L., Ge X., and Rao G., Anal. Biochem. 314, 199 (2003). 10.1016/S0003-2697(02)00586-9 [DOI] [PubMed] [Google Scholar]
- Lam H., Kostov Y., Rao G., and Tolosa L., Anal. Biochem. 383, 61 (2008). 10.1016/j.ab.2008.08.018 [DOI] [PMC free article] [PubMed] [Google Scholar]
- Nanavati D., Noll K., and Romano H., Microbiology 148, 3531 (2002). [DOI] [PubMed] [Google Scholar]
- D’Auria S., Scirè A., Varriale A., Scognamiglio V., Staiano M., Ausili A., Marabotti A., Rossi M., and Tanfani F., Proteins 58, 80 (2005). 10.1002/prot.20289 [DOI] [PubMed] [Google Scholar]
- Su J. G., Jiao X., Sun T. G., Li C. H., Chen W. Z., and Wang C. X., Biophys. J. 92, 1326 (2007). 10.1529/biophysj.106.086512 [DOI] [PMC free article] [PubMed] [Google Scholar]
- Tolosa L., Gryczynskia I., Eichhornb L., Dattelbaum J. D., Castellano F. N., Rao G., and Lakowicz J. R., Anal. Biochem. 267, 114 (1999). 10.1006/abio.1998.2974 [DOI] [PMC free article] [PubMed] [Google Scholar]
- Geddes C. and Lakowicz J. R., Topics in Fluorescence Spectroscopy Glucose Sensing (Springer, Heidelberg, 2006), pp. 323–331. [Google Scholar]
- Lakowicz J. R., Principle of Fluorescence, 3rd ed. (Springer, New York, 2006). [Google Scholar]
- Atmel, ATmega128 8-bit AVR microcontroller manual, www.atmel.com/dyn/resources/prod_documents/doc2467.pdf.
- Stanford Research Systems, SR850 DSP Lock-in Amplifier User’s Manual, also in http://www.srsys.com/html/bodyIsr850.html.
- Razek T., Miller M. J., Hassan S., and Arnold M. A., Talanta 50, 491 (1999). 10.1016/S0039-9140(99)00151-4 [DOI] [PubMed] [Google Scholar]
- Fogarty M. P. and Warner I. M., Anal. Chem. 53, 259 (1981). 10.1021/ac00225a031 [DOI] [Google Scholar]


