Abstract
Fiber cells of the lens are interconnected by an extensive network of gap junctions containing α3 (Cx46) and α8 (Cx50) connexins. A specific role for these connexins in lens homeostasis is not known. To determine the contribution of these connexins to lens function, we used impedance techniques to study cell-to-cell coupling in lenses from homozygous α3 knockout (−/−), heterozygous (+/−), and wild-type (+/+) mice. Western blots and immunofluorescence data indicated that α8 remained at similar levels in the three classes of lenses, whereas α3 was approximately 50% of the normal level in the +/− lenses, and it was absent from the −/− lenses. Moreover, the data from +/+ lenses suggest that a cleavage of connexins occurs abruptly between the peripheral shell of differentiating fibers (DF) and the inner core of mature fibers (MF). The appearance of the cleaved connexins was correlated to a change in the coupling conductance. In −/− lenses the coupling conductance of MF was zero, and these fibers were depolarized by about 30 mV from normal (≈−65 mV). The DF remained coupled, but the conductance was reduced to 30–35% of normal. However, the gap junctions in the DF of α3 −/− lenses remained sensitive to pH. We conclude that α3 connexin is necessary for the coupling of central fibers to peripheral cells, and that this coupling is essential for fiber cell homeostasis because uncoupled MF depolarize and subsequently become opaque.
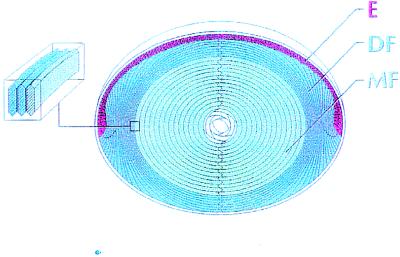
The lens of the eye contains a single layer of epithelial cells that covers its anterior surface and a much larger number of fiber cells that makes up the bulk of its mass. Equatorial epithelial cells differentiate to form new fibers, which subsequently become a part of the inner mass of fiber cells as the lens grows. These features are shown in Fig. 1 where we have classified the cells/regions as epithelial cells (E), differentiating fibers (DF), and mature fibers (MF). As fibers mature, their intracellular organelles, which would scatter light, are degraded (1). Consequently, most of the metabolic activity and protein synthesis is carried out by the epithelium and DF. An extensive network of gap junctions provides low-resistance pathways for diffusion between all of these cells (2), thus forming a metabolic syncytium (3, 4). Moreover, the lens generates internally circulating ionic current that enters at both anterior and posterior surfaces and exits at the equator (5). Gap junctions are a pathway for this current, and they may direct the overall pattern of current flow in the lens.
Figure 1.
The cellular structure of the lens. The anterior surface of the lens is capped by a single layer of typical epithelial cells (E). At the equator, the epithelial cells elongate and differentiate into fiber cells. This process occurs in the outer layer of DF. MF have no organelles, very little active membrane transport, and a low level of metabolic activity. All of these cells are connected through an extensive network of gap junctions. When the epithelial cells begin to differentiate, new cytoplasmic and membrane proteins are synthesized, and many of the epithelial proteins are deleted. As the DF change to MF, there is a rather abrupt cleavage of most membrane proteins, including the gap junction proteins of the fibers. In this study, we have defined the DF and MF zones based on where the gap junction proteins are cleaved. (Inset) The fiber cell cross section has the shape of a flattened hexagon with a long side dimension of about 10 μm and a short side of about 3 μm. Each MF extends from anterior to posterior pole.
Gap junction channels are formed by the oligomerization of six connexins in one cell to form a connexon (hemi-channel) that pairs with a connexon in an adjacent cell. Functional coupling of lens cells involves expression of at least three types of connexins. Epithelial cells express α1 (Cx43) connexin whereas DF have no detectable α1, but express α3 (Cx46) and α8 (Cx50) connexins. As the fibers mature, α3 and α8 connexin are modified by phosphorylation (6) and cleavage of their N and C termini (7). All three connexins have been cloned and studied in heterologous expression systems (8), where they can form homotypic (same type connexins in each cell) and heterotypic (α3 expressed in one cell, and either α1 or α8 in the other) channels that are sensitive to pH. Moreover, there is some biochemical evidence that the lens has heteromeric gap junction channels, which contain both α3 and α8 in the same connexon (9).
It is not known why the lens uses at least three different gap junction proteins, although it is likely to reflect the different functional properties of the connexins. Functional studies have shown fiber cell gap junctional coupling is not uniform in distribution or gating properties (reviewed in ref. 5). In the MF zone, the gap junctional coupling is relatively uniform with a moderately high resistance and is not sensitive to pH. In contrast, in the DF zone, the coupling resistance varies dramatically from poles to equator, with very low resistance at the equator. Moreover, DF junctions uncouple in response to a drop in cytoplasmic pH. Some of these functional properties are likely influenced by the composition of the gap junctions. To determine the role of one of the lens connexins in the intact lens, we generated a knockout mouse for α3 connexin (10). In this study, we have used electrophysiological techniques (11) to study the role of this connexin in cell-to-cell coupling in the intact lens.
MATERIALS AND METHODS
Biochemical and Western Blot Analysis of Mouse Lenses.
Samples of α3 connexin were prepared by NaOH extraction of homogenates of total mouse lenses and the different regions as described (10).
Samples of α8 connexin were extracted with 0.1 M NaCl and 50 mM Na2HPO4 (pH 7.0), and the insoluble pellet was analyzed as described (10). Laemmli SDS/PAGE and Western blot analysis were performed by using antibodies to α3 and α8 connexin. The bound primary antibodies were detected with the Amersham ECL kit. Equal volumes of lens homogenate were used in each lane. Rabbit polyclonal antibodies (α3 J) directed against the cytoplasmic loop, residues 115–128 of rat α3 connexin, and murine mAbs to α8 connexin, generously provided by Dan Goodenough (Harvard University, Boston), were used for the Western blot and immunofluorescence analysis.
Immunocytochemistry of Mouse Lenses.
Immunocytochemical staining was carried out by using the method described in ref. 10 with the α3J and α8 connexin antibodies described in ref. 16. The spatial distribution of α3 and α8 connexin in a normal (+/+) lens was determined by indirect immunofluorescence.
Electrophysiological Measurement of Mouse Lenses.
Generation of the α3 knockout mice is described in Gong et al. (10). The impedance studies follow the methods described in Mathias et al. (11). The studies reported here used litter mates, so the +/+, +/−, and −/− lenses have a similar genetic background. The mice were sacrificed in accordance with National Institutes of Health guidelines by using procedures approved by the Institutional Animal Care and Use Committee of the State University of New York at Stony Brook. The lenses were dissected from the eye and placed in a sylgard-lined chamber. An intracellular microelectrode was used to inject a wide band stochastic current into a central fiber cell. A second intracellular microelectrode recorded the induced voltage at a distance r (cm) from the lens’ center. The current and voltage signals were analyzed by using a Fast Fourier Analyzer to compute the impedance in real time. The cumulative resistance curves (Rs vs. r/a) were generated by advancing the voltage recording microelectrode and recording the impedance at a series of locations from surface to center of a lens.
At frequencies greater than about 100 Hz, the fiber cell membrane capacitance generates sufficiently low impedance to maintain the intracellular and intercellular compartments of the lens at the same voltage (14). Under these conditions, the lens is essentially a conductive sphere whose surface is at ground potential. In a radially symmetric sphere, the magnitude of the induced intracellular voltage (ψi) at a distance r (cm) from the center is described by:
 |
1 |
The average lens radius, a = 0.096 ± 0.002 cm in these studies. In the lens, the resistivity Rp(r) (Ω cm) is the parallel combination of Ri(r) (Ω cm), the effective intracellular resistivity because of gap junctions, and Re (Ω-cm), the effective extracellular resistivity caused by small tortuous extracellular clefts.
 |
2 |
We assume Re is approximately uniform throughout the lens, as was determined in other species (11, 15). Similarly, Ri is assumed to be uniform in the MF zone, but has a different value in the DF zone.
The effective intracellular resistivity Ri is the most convenient way to express the series coupling of fiber cells. However, the cell-to-cell resistance in a unit area of membrane depends on α3 and α8 connexin acting in parallel. Thus, it is convenient to define the specific coupling conductance per unit area of fiber cell membrane, Gi = 1/Riw (S/cm2), where w ≈ 3 μm is the fiber cell width. As an hypothesis, we assume Gi can be functionally separated into components because of α3 and α8: Gi = Gα3 + Gα8. This relationship assumes there are no cooperative effects of α3 and α8 on total conductance, but it does not depend on knowledge of the distribution of connexins within any given channel, as discussed below.
RESULTS
Three genetic classes of mouse lenses were used for functional studies: normal α3 genes (+/+), heterozygous (+/−), and homozygous (−/−) α3 connexin knockouts. The +/+ and +/− lenses have normal phenotype, whereas the −/− develop nuclear cataracts (10).
Immunoblot Analysis of Connexins in Mouse Lenses.
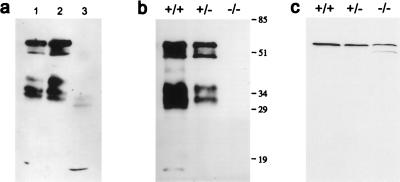
Fig. 2 contains Western blots of α3 and α8 connexin protein from the three types of lenses. Fig. 2a qualitatively compares the forms of α3 found in total lens (lane 1), and in the cortex (lane 2) and nucleus (lane 3) of normal (+/+) lenses. The cortex includes the DF zone and some outer fraction of the MF zone, whereas the nucleus is entirely MF. Several forms of α3 connexin were present. There was a 60-kDa phosphorylated intact connexin, a 46-kDa nonphosphorylated intact connexin, and several bands of higher mobility (36, 32, 29, and 16 kDa) that may represent degraded forms. The antibodies used for these studies bind to a peptide epitope on the inner cytoplasmic J loop, and thus only the connexin proteins that retained this epitope were detected. The intact forms were found only in the cortical region. Fig. 2b compares total lens α3 protein in lenses from +/+, +/−, and −/− mice. The different forms and distribution of α3 were similar in the +/+ and +/− lenses. Based on densitometry, the amount in +/− was about one-half that in +/+, whereas the −/− lenses had no detectable α3. Fig. 2c compares the level of α8 in the cortex of +/+, +/−, and −/− lenses. The α8 antibodies that were used bind to an epitope on the carboxyl terminal region of the α8 connexin. Hence, these antibodies were unable to detect α8 in the nucleus where the C terminus previously has been reported to be cleaved to generate a 38-kDa form (12). However, in −/− lenses (Fig. 2c), Western blotting detected an additional 50-kDa band, which may represent the nonphosphorylated form of α8 connexin. The influence of the phosphorylation state on the conductance properties of α8 connexin is not known. Nonetheless, it is unlikely that this small amount of nonphosphorylated α8 connexin protein could account for the total uncoupling of MF in −/− lenses.
Figure 2.
Western blots of α3 and α8 connexins. (a) Membrane proteins were isolated from the lenses of 6-week-old wild-type mice and analyzed by using anti-α3 connexin antibodies that bind to an epitope on the inner cytoplasmic loop; the same antibodies were used for immunocytochemical staining. Lane 1, membrane proteins from total lens; lane 2, membrane proteins from fibers of the DF zone and some outer fraction of the MF zone; lane 3, membrane proteins from nuclear fibers. (b) A comparison of α3 in lenses from the litter mates of +/+, +/−, and −/− mice at 2 months of age. (c) A comparison of α8 in the cortex of lenses from the litter mates of +/+, +/−, and −/− mice at the age of 2 months. The same α8 antibodies were used for immunocytochemical staining shown in Fig. 3.
Immunofluorescence Analysis of Connexin in Mouse Lenses.
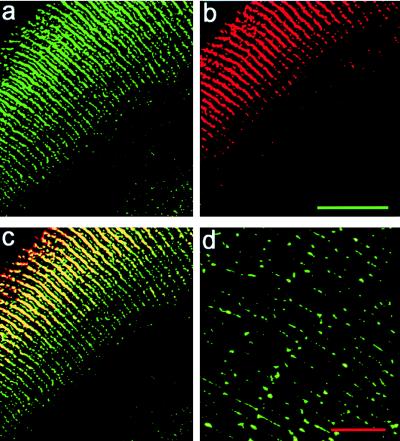
The spatial distribution of α3 and α8 connexin in a normal (+/+) lens was determined by indirect immunofluorescence. In the DF zone, extensive linear fluorescence was detected on the broad sides of hexagonal fibers by using both α3 and α8 connexin antibodies (Fig. 3 a–c). The yellow/orange staining in Fig. 3c indicates that these plaques contained both α3 (green in Fig. 3a) and α8 (red in Fig. 3b), as previously reported (10, 13). The large plaques were not detectable in MF (Fig. 3d). Punctate spots containing predominantly α3 connexin were observed on the narrow sides of the fibers in the DF and MF zones, but in the MF zone the α3 signal was more diffuse. The α8 signal in the MF zone was completely undetectable. In this zone the C terminus of the α8 connexin has been removed and consequently is not recognized by the α8 antibody (12). Based on this pattern of staining, we estimate the DF zone in small mouse lenses is 80 ± 30 μm thick at the poles and expands to 180 ± 30 μm thick at the equator. Gong et al. (10) reported that the immunofluorescence staining of α8 was similar in the DF of both +/+ and −/− lenses. Taken together, these data suggest that +/− lenses were nearly normal with respect to the distribution of connexins, except they had about 50% as much α3 connexin as +/+ lenses. The −/− lenses have no α3 as expected, and only minor changes in α8 connexin were observed. Indeed, there are remarkably few detectable changes in the level and distribution of α8 connexin among +/+, +/−, and −/− lenses.
Figure 3.
The distribution of α3 and α8 connexins in mouse lenses. The scale bar in b is 50 μm and a–c are at the same magnification. (a and b) Fluorescent antibody double staining of the α3 (green) and α8 (red) connexins in a frozen section of the lens from a 6-week-old +/+ mouse. (c) The merged picture of a and b. Orange/yellow staining represents the colocalization of α3 and α8 connexins to the same gap junctional plaques. The plaques are preferentially located in the long sides of the hexagonal fibers in the DF zone. Small plaques also were detected in the edges of the narrow sides of fibers in the DF zone. (d) Fluorescent signals of the α3 connexin in MF of the same mouse lens in a–c by using the same anti-α3 connexin antibodies. This pattern of staining was consistent throughout the MF right up to the DF. The scale bar in d is 10 μm.
Electrophysiological Measurements of the Mouse Lenses.
We used frequency domain impedance techniques (11) to determine the coupling resistance between fiber cells in the DF and MF regions of +/+, +/−, and −/− lenses. When a high frequency sinusoidal current of magnitude (I) is injected into a central fiber cell, it flows along two parallel paths to the surface: in normal conditions, it flows predominantly from cell to cell via gap junctions. The effective resistivity of this intracellular path is denoted as Ri. When the fiber cells are uncoupled, the parallel path along narrow intercellular spaces becomes important. We denote the effective resistivity of this extracellular path as Re. As described in Materials and Methods, our data allow us to determine the resistivity Rp, which is the parallel combination of Ri and Re (Eqs. 1 and 2).
In the DF zone of lenses from adult rats, Ri has a dramatic angular variation from poles to equator (15). We considered whether the α3 connexin might relate to this angular variation. However, in these tiny lenses from 2- to 3-week-old mice, the angular variation was difficult to accurately measure. To the accuracy of our method, the small angular variation in Ri was the same in +/+ and −/− lenses. In the subsequent analysis of our data, we neglected angular dependence and used Eqs. 1 and 2.
The effect of α3 connexin on the radial dependence of fiber cell coupling.
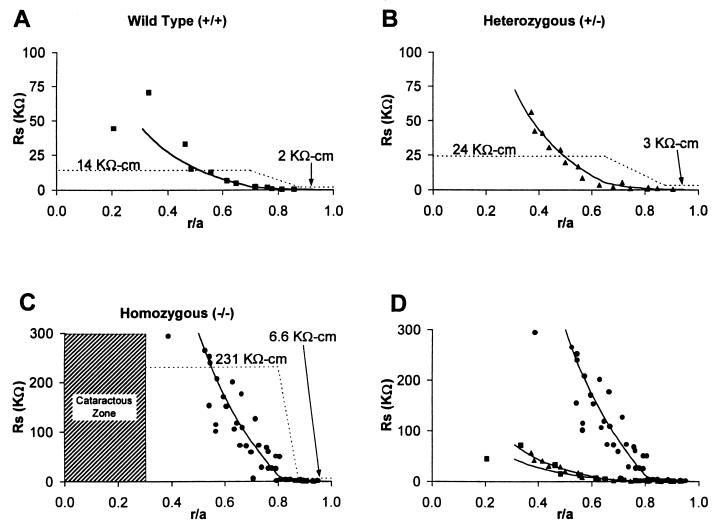
Fig. 4 illustrates the cumulative resistance Rs = ψi/I (Eq. 1) between a series of points of recording and the bath, with the solid line representing the best fit by using Eq. 1, and the dashed line indicating the values of Rp that were needed to generate the smooth curves. Fig. 4 A–C contains data from +/+, +/−, and −/− lenses, respectively; Fig. 4D contains an overplot of Rs from the three types of lenses and clearly illustrates the extensive uncoupling of fibers in the MF zone of −/− lenses. We assume that these fibers are completely uncoupled, so the value of Rp in the MF zone of −/− lenses (Fig. 4C) provides a measure of the effective extracellular resistivity, Re. Table 1 gives the estimated values of Ri based on Rp in Fig. 4.
Figure 4.
The cell-to-cell coupling resistance in +/+, +/−, and −/− lenses. The Rs data represent the cumulative resistance between the point of recording (r/a, where r is the distance from the center of the lens and a is the radius of the lens) and the surface of the lens (r/a = 1). The smooth curves are generated by using Eq. 1 with the values of Rp in Eq. 1 shown as the dashed lines. We assumed Rp increased linearly between the DF and MF zones; however, equally good fits to the data could have been achieved with other assumptions (e.g., a sigmoidal increase). Rp represents the parallel combination of the cell to cell intracellular resistivity and extracellular resistivity (Eq. 2). In normal circumstances Rp is approximately equal to Ri; however, in the MF zone of −/− lenses, Ri is essentially infinite so in this case, Rp is equal to Re. (A) Wild-type (+/+) lenses. Data are from two lenses. (B) Heterozygous (+/−) lenses. Data are from two lenses. (C) Homozygous (−/−) lenses. Data are from 10 lenses. (D) An overplot of Rs from +/+, +/−, and −/− lenses.
Table 1.
Regional values of Ri in the three types of lenses
| Zone | Resistivity | +/+ | +/− | −/− |
|---|---|---|---|---|
| DF | Ri (KΩ-cm) | 2 | 3 | 6.6 |
| MF | Ri (KΩ-cm) | 15 | 27 | ∞ |
As discussed in Materials and Methods, the specific coupling conductance per unit area of fiber cell membrane (Gi) is a function of the α3 and α8 connexin. Therefore, by using the data in Table 1, it was possible to assess the contribution of α3 and α8 connexin to the specific conductance. In −/− lenses there is no α3 connexin, so the specific conductance defines Gα8, which must be because of homotypic channels. In +/+ or +/− lenses, we assume the contribution of α8 to specific coupling conductance is unchanged, although the contribution could be because of either homotypic or heteromeric channels. By simple subtraction, one obtains Gα3 in the different regions and types of lenses. These functionally defined values are presented in Table 2. Western blots indicated the amount of α3 in +/− lenses was about 50% of that in +/+ lenses. Note that in both DF and MF, Gα3 in the +/− lenses is about 50% of that in +/+ lenses, consistent with the assumption that Gi is linearly proportional to the amount of α3 connexin. At this time, we have no means of testing whether Gi is also linearly proportional to the amount of α8.
Table 2.
The functional contributions of α3 and α8 to the cell-to-cell coupling conductance
| Zone | Coupling | +/+ | +/− | −/− |
|---|---|---|---|---|
| DF | Gi (S/cm2) | 1.7 | 1.1 | 0.5 |
| Gα3 (S/cm2) | 1.2 | 0.6 | 0 | |
| Gα8 (S/cm2) | 0.5 | 0.5 | 0.5 | |
| MF | Gi (S/cm2) | 0.2 | 0.1 | 0 |
| Gα3 (S/cm2) | 0.2 | 0.1 | 0 | |
| Gα8 (S/cm2) | 0 | 0 | 0 |
Based on the data in Table 2, α3 contributed 71% of the conductance in the DF zone, whereas it was required for 100% of the functional junctions in the MF zone. In normal (+/+) lenses from this litter of mice, the average cell-to-cell conductance in the MF zone diminished 7- to 8-fold from its value in the DF zone. This decrease is unusually large because wild-type lenses from rats (15), frogs (11), or mice of random genetic background generally show a 2- to 4-fold reduction. We examined lenses from another litter of +/+, +/−, and −/− α3 knockout mice and observed the same effect of α3 on coupling; however, the +/+ lenses were much more uniformly coupled. In +/+ lenses from this litter, the average value of Gi in the DF zone was 1.00 S/cm2, which diminished to 0.65 S/cm2 in the MF zone. In the −/− lenses, the value of Gi in the DF zone was 0.35 S/cm2, suggesting α3 contributed 65% of the conductance in the DF zone, whereas it was required again for 100% of the coupling in the MF zone. Again, in the +/− lenses, Gα3 in either the DF or MF region dropped to about 50% of its value in +/+ lenses. Thus, the change in coupling conductance for the knockout mice appears to have been a specific result of the loss of α3 connexin. Moreover, the results of comparing mice within a litter were quite reproducible, but baseline data varied considerably between litters of these inbred mice.
The effect of α3 connexin on resting voltage.
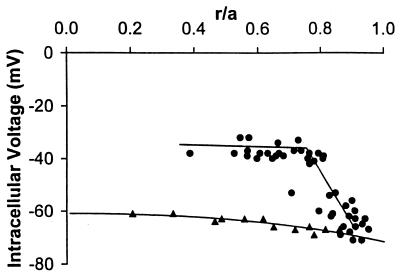
Fig. 5 shows the distribution of resting voltages in the +/+ and −/− lenses that were used for Fig. 4. In the +/+ mouse lenses, there is a small radial gradient in resting voltage that is the same as we previously reported for frog or rat lens (5). This gradient is the result of the standing current that flows via gap junctions from central cells to surface cells. The smooth curve describing the resting voltage in +/+ lenses was generated by using parameters from rat lenses as described in ref. 5. The similarity of the resting voltage to that in larger lenses suggests ion transport in these small mouse lenses is the same as in larger lenses from other species where more precise measurements are possible. In the −/− lenses, peripheral fiber cells are still coupled to surface cells, and they have a normal resting voltage. However, the more interior fiber cells lose coupling with the surface, and their resting voltage depolarizes to about −35 mV. The spatial pattern of depolarization follows the predicted value of Rp in Fig. 4C. Thus, we suggest that the fiber cells’ resting voltage depends on gap junction channels to connect to the surface cells where the majority of the lens’ K+-conductance and Na/K ATPase activity is thought to reside.
Figure 5.
The radial distribution of resting voltages in +/+ and −/− lenses. Comparison with the coupling data (Rp) in Fig. 4C suggests that as the coupling of MF to the lens surface is lost, the fibers depolarize.
The effect of α3 on gating.
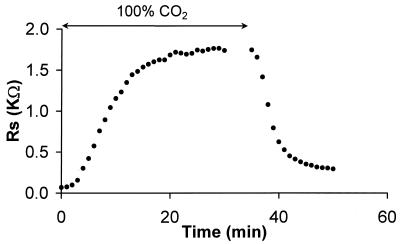
To determine whether the lack of α3 connexin would affect the ability of junctions in the DF zone to gate, we analyzed the sensitivity of coupling to CO2. Fig. 6 illustrates the time dependence of coupling as the lens was superfused in Tyrode bubbled with 100% CO2. The abscissa is the cumulative resistance Rs between the point of recording and the bath (Eqs. 1 and 2). Because the point of recording, r = 0.09 cm, is just 100 μm from the surface of the lens, the value of Rs depends only on DF junctions. As the CO2 diffused across the fiber cell membranes, the cytoplasm acidified and the gap junction channels closed, causing a large increase in Rp. At initial times Rp ≈ Ri = 1,700 Ω-cm, but as the junctions uncoupled and Ri became large, Rp was more dependent on Re. When the CO2 was removed from the bathing solution, the junctional channels reopened and coupling recovered. This response is typical of what we found previously for normal rat (15) or frog (16) lenses, and it is similar to data obtained from +/+ mouse lenses. Thus, we conclude that α3 connexin was not necessary for the gating of DF gap junctions.
Figure 6.
The effect of pH on junctional coupling in DF from a −/− lens. The graph shows the time dependence of the cumulative coupling resistance of junctions between the point of recording (r = 0.09 cm) and the lens surface (a = 0.10 cm). When the bathing solution is bubbled with 100% CO2, the junctions uncouple, then recover when the CO2 is removed. Thus, DF junctions lacking the α3 connexin are capable of gating similarly to normal DF junctions.
DISCUSSION
The contribution of α3 and α8 connexins to lens function was analyzed by using impedance techniques to study cell-to-cell coupling in lenses from α3 knockout and wild-type mice. The results from this analysis provide direct evidence for the importance of α3 connexin in maintaining the coupling of mature fibers to peripheral cells. This coupling is essential for fiber cell homeostasis because uncoupled mature fibers depolarize and subsequently become opaque.
The lack of new protein biosynthesis in the MF cells of the lenses suggests that the differences between junctions in the DF and MF reflect the differences in the junctions that were assembled in the DF. The observed pattern of immunofluorescence staining reflects the changes in gap junctional connexin distribution from the DF to MF zone, and these changes can be spatially correlated to the functional differences that have been determined in gap junctional coupling in these two zones.
In this study, we have found that reduced coupling was retained in the DF in the absence of α3 connexin, whereas α3 was required for coupling in the older central MF. Our data are compatible with several structure/function relationships for lens junctions. For example, if the single channel conductance is independent of the composition of the gap junction, we can equate the functional conductances in Table 2 with the amount of α3 and α8 protein. In the DF of lenses from +/+ mice, this assumption implies there were on average about eight α3 connexins for every four α8 connexins. This calculation might mean the typical channel in DF is heteromeric, made up of eight α3 connexins and four α8 connexins; or, it might mean that of every 12 channels in DF, on average eight are homotypic α3 and four are homotypic α8. Either possibility is consistent with our data. Reduction of coupling in MF of +/+ lenses and loss of coupling in MF of −/− lenses probably are caused by age-dependent degradation and/or posttranslational modifications causing loss of functional α8 connexin. Perhaps, only homotypic α3 channels in DF of +/+ lenses survive the degradation and remain as functional channels in MF. Another possibility is that DF channels with some minimum number of α3 connexins are not functionally degraded in MF of +/+ lenses. A final possibility is that only channels containing a specific mixture of α3 and α8 remain stable, in which case the absence of α8, like the absence of α3, would cause complete uncoupling of MF junctions. Our data are compatible with any of these hypotheses. However, in the last two possibilities, the single channel conductance in MF depends on the mixture of α3 and α8 connexin in the channel, because the conductance is zero for certain combinations. Thus, in MF the relationship of Gα3 to the amount of α3 connexin is uncertain. Nonetheless, we can conclude that α3 is essential for functional channels to exist in MF.
The formation of a nuclear cataract in the −/− lenses probably is related to the uncoupling of central fiber cells from the surface cells. If so, then the opacity should increase with time. However, the lens also grows with time. Consequently, there would always be a zone of new MF that is transparent, with the older, more central MF being opaque. In the 2- to 3-week-old mice used in this study, the diameter of the lens was about 1.9 mm, and the diameter of the cataract was about 0.6 mm. In 2- to 3-month-old mice, the lens is about 2.3 mm, and the cataract about 0.9 mm. Thus, the pattern of change is consistent with the uncoupling being responsible for generating the loss of homeostasis in the central MF.
The uncoupling of MF from surface cells may interrupt the movement of an essential metabolite. However, the depolarization of fibers in the MF zone and formation of a nuclear cataract in (−/−) lenses is also consistent with an hypothesis drawn from a number of other transport studies (5). The lens generates an internally circulating ionic current that is thought to be followed by fluid flow. It has been hypothesized that this system creates a well-stirred intracellular environment in which active transport by peripheral cells maintains a homeostatic environment for cells in the MF zone. Loss of coupling would cut off the MF zone from this circulation. With time, ion gradients in such uncoupled cells would dissipate, intracellular calcium would increase, and proteolysis of cytoplasmic proteins (such as the crystallins) would occur (10). As a result, the denatured proteins would aggregate and form light-scattering elements that would be responsible for the nuclear opacity.
Acknowledgments
We thank Dr. Peter Brink for a critical reading of a preliminary version of this paper. This work was supported by National Institutes of Health Grants EY06391, EY11093, and GM37904.
ABBREVIATIONS
- DF
differentiating fibers
- MF
mature fibers
References
- 1.Bassnett S, Beebe D C. Dev Dyn. 1992;194:85–93. doi: 10.1002/aja.1001940202. [DOI] [PubMed] [Google Scholar]
- 2.Rae J L, Bartling C, Mathias R T. J Membr Biol. 1996;150:89–103. doi: 10.1007/s002329900033. [DOI] [PubMed] [Google Scholar]
- 3.Goodenough D A. Semin Cell Biol. 1992;3:49–58. doi: 10.1016/s1043-4682(10)80007-8. [DOI] [PubMed] [Google Scholar]
- 4.Goodenough D A, Dick J S, Lyons J E. J Cell Biol. 1980;86:576–589. doi: 10.1083/jcb.86.2.576. [DOI] [PMC free article] [PubMed] [Google Scholar]
- 5.Mathias R T, Rae J L, Baldo G J. Phys Rev. 1997;77:21–50. doi: 10.1152/physrev.1997.77.1.21. [DOI] [PubMed] [Google Scholar]
- 6.Jiang J X, Paul D L, Goodenough D A. Invest Ophthalmol Visual Sci. 1993;34:3558–3565. [PubMed] [Google Scholar]
- 7.White T W, Bruzzone R, Goodenough D A, Paul D L. Mol Biol Cell. 1992;3:711–720. doi: 10.1091/mbc.3.7.711. [DOI] [PMC free article] [PubMed] [Google Scholar]
- 8.White T W, Bruzzone R, Wolfram S, Paul D L, Goodenough D A. J Cell Biol. 1994;125:879–892. doi: 10.1083/jcb.125.4.879. [DOI] [PMC free article] [PubMed] [Google Scholar]
- 9.Jiang J S, Goodenough D A. Proc Natl Acad Sci USA. 1996;93:1287–1291. doi: 10.1073/pnas.93.3.1287. [DOI] [PMC free article] [PubMed] [Google Scholar]
- 10.Gong X, Li E, Klier G, Huang Q, Wu Y, Lei H, Kumar N M, Horwitz J, Gilula N B. Cell. 1997;91:833–843. doi: 10.1016/s0092-8674(00)80471-7. [DOI] [PubMed] [Google Scholar]
- 11.Mathias R T, Rae J L, Eisenberg R S. Biophys J. 1981;34:61–83. doi: 10.1016/S0006-3495(81)84837-0. [DOI] [PMC free article] [PubMed] [Google Scholar]
- 12.Kistler J, Kirkland B, Bullivant S. J Cell Biol. 1985;101:28–35. doi: 10.1083/jcb.101.1.28. [DOI] [PMC free article] [PubMed] [Google Scholar]
- 13.Lo W K, Shaw A P, Takemoto L J, Grossniklaus H E, Tigges M. Exp Eye Res. 1996;62:171–180. doi: 10.1006/exer.1996.0021. [DOI] [PubMed] [Google Scholar]
- 14.Eisenberg R S, Barcilon V, Mathias R T. Biophys J. 1979;25:151–180. doi: 10.1016/S0006-3495(79)85283-2. [DOI] [PMC free article] [PubMed] [Google Scholar]
- 15.Baldo G J, Mathias R T. Biophys J. 1992;63:518–529. doi: 10.1016/S0006-3495(92)81624-7. [DOI] [PMC free article] [PubMed] [Google Scholar]
- 16.Mathias R T, Riquelme G, Rae J L. J Gen Physiol. 1991;98:1085–1103. doi: 10.1085/jgp.98.6.1085. [DOI] [PMC free article] [PubMed] [Google Scholar]


