Abstract
Imaging techniques of the lung continues to advance with improving ability to image the more distal airways. Two imaging techniques are reviewed, computerized tomography and magnetic resonance with hyperpolarized helium-3.
Keywords: Imaging, asthma, distal airways, small airways, CT, high resolution CT, hyperpolarized magnetic resonance
CT IMAGING TECHNIQUES FOR THE DISTAL LUNG IN ASTHMA
The underlying rationale for using regional ventilation as a surrogate for small airways disease in asthma is that the small airways are mainly responsible for the distribution of ventilation to the gas-exchanging surface of the distal lung; when the small airways are narrowed by disease, the distribution of ventilation becomes uneven and air that was inhaled becomes trapped behind prematurely (anatomically or functionally) closed small airways. This may not be reflected by changes in residual volume (measured by body plethysmography) since the latter measurement is a global measure of lung volume and is likely to be a less sensitive measure of regional ventilation that can be assessed by imaging techniques using quantitative image analysis (QIA) (1, 2). While it is also possible to use thoracic HRCT to directly assess changes in conducting airway structure (airway wall thickness, luminal area), with current CT technology such assessment can only reliably be carried out to the level of subsegmental bronchi (i.e., the 5th generation of the tracheobronchial tree), which are proximal to the portion of the respiratory tract that comprises the small airways (7th or 8th generation and distally). Thus, CT imaging currently provides only an indirect assessment of small airways disease.
Advances in CT technology over the last decade have led to the development of multi-detector CT scanners that allow shorter scanning times and provide higher spatial and temporal resolution. Therefore, whereas older scanners required 32 seconds of scanning time to acquire images throughout the lung with axial slice thickness of 5 mm, the latest 64-detector scanners can acquire whole-lung data in only 4 seconds with slice thickness down to 0.4 mm. Thus, earlier studies were greatly restricted in examination of the airways. More recent studies utilizing 64-detector scanners can acquire whole lung data that can process image data volumetrically with anatomic segmentation into the five lobes and 18 bronchopulmonary segments. Therefore, examining regional changes within all of the anatomically relevant regions of the lung and assessing the regional heterogeneity of small airways involvement between lobes and segments, as well as within these anatomic units can be performed. Of importance is the cooperation of the subject for the validity of the information. Imaging is routinely performed under controlled conditions with the patient supine at residual volume (RV) or functional residual capacity (FRC) during a suspended breathhold. Spirometry is used to assure that the subjects hold their breath at the stipulated volume. Assessment of regional air-trapping was based on analyses of frequency distribution curves of lung attenuation units (so-called “lung attenuation curves”, or LACs) using a validated software package developed at UCLA and thus not subject to inter- or intra-observer variation (1). Shifts in these curves toward lower or higher attenuation (indicating an increase or decrease in regional airtrapping, respectively) were also assessed using computer software (1,2). Studies conducted in healthy volunteers provided normal reproducibility data indicating that shifts in the LAC >7% represent an abnormal change (2).
Studies documenting the utility of HRCT imaging
Beclomethasone (BDP) HFA versus BDP CFC
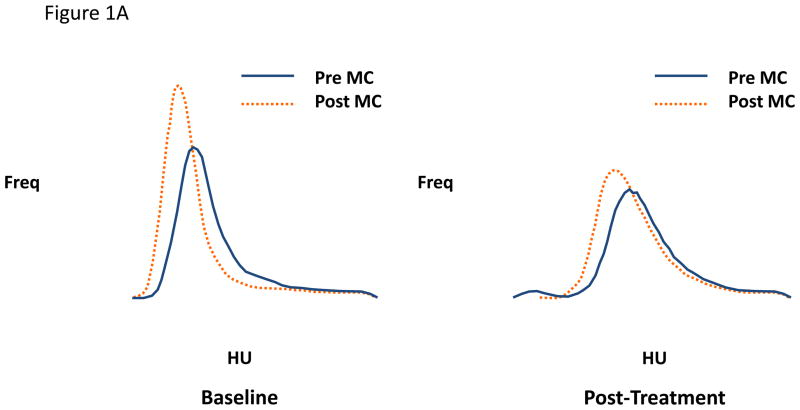
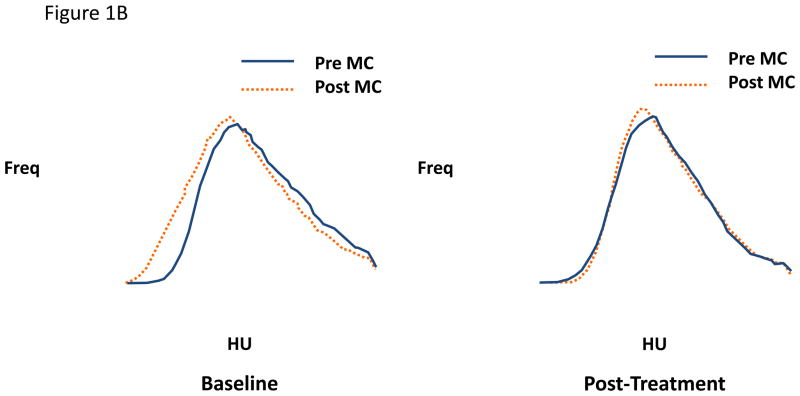
An early interventional study tested the hypothesis that treatment for 1 month with an extra-fine steroid aerosol (beclomethasone [BDP]HFA) in 31 steroid-naïve asthmatic subjects would have a greater effect in reducing regional airtrapping than the same microgram dose of the same molecule delivered from a conventional suspension steroid aerosol (BDP CFC) using a randomized, double-blind parallel-group design (3). The results indicated a significant shift in the LAC in the direction of greater attenuation (less regional airtrapping) in the BDP-HFA subjects but no shift in either direction in the BDP-CFC-treated subjects, the difference in the mean shifts in the two groups being statistically significant (p<0.05). Moreover, while both groups of subjects showed similar shifts in the direction of lower attenuation (more airtrapping) with methacholine at baseline, this methacholine-induced shift increased in the CFC-treated group (a representative example is illustrated in Figure 1A) but diminished substantially in the HFA-treated group (a representative example is shown in Figure 1B), the difference between the two groups being statistically significant (p<0.04). The latter findings suggest that regional hyperresponsiveness of smaller airways is reduced by the extra-fine steroid aerosol but not by the larger-particle suspension steroid aerosol, implying that the former but not the latter penetrated the distal lung to an extent that suppressed inflammation (and thus hyperresponsiveness) in the small airways. The possible clinical significance of these findings is suggested by the observation that shortness of breath (assessed by daily diary using a Likert scale) improved significantly more in the BDP HFA than the BDP CFC group. Moreover, the same subjects showed no changes in the dimensions of larger airways assessed at functional residual capacity in response to either formulation of BDP, suggesting that changes in larger airways were not responsible for the reduction in lung attenuation or improvement in symptoms in the BDP HFA group.
Figure 1.
Figure 1A and 1B. Lung attenuation curves from individual subjects using matched right upper lobe images pre- and post-methacholine at baseline and post-treatment A) with BDP CFC and B) with BDP HFA. The small particle inhaled steroid (HFA BDP) blocks the increase in airtrapping following methacholine. MC = methacholine. HU = Hounsfield units (more negative number represents more airtrapping). Study performed at residual volume.
Cat room antigen challenge
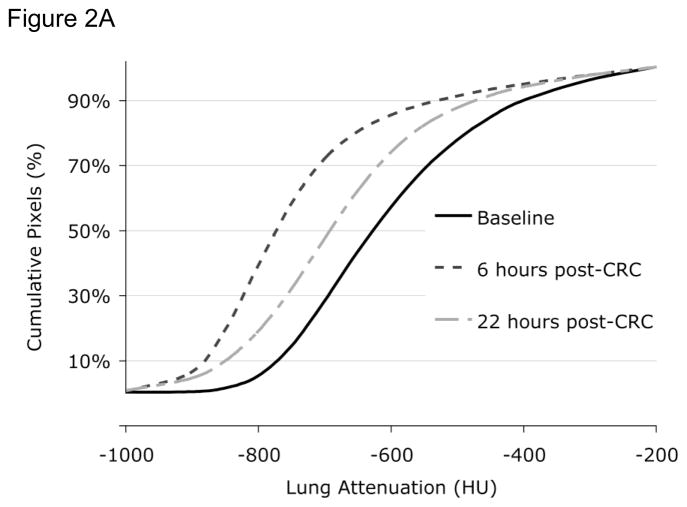
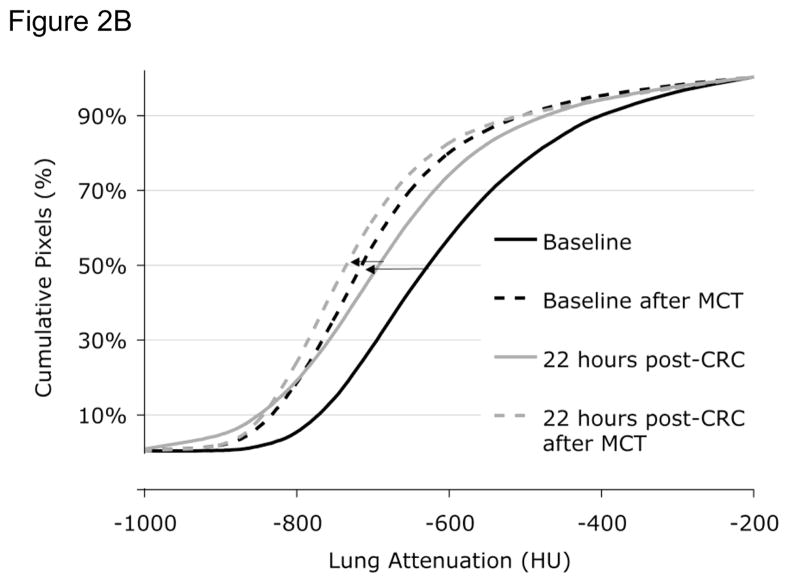
Approximately 25% of Fel D 1 antigen shed by cats is in the submicronic size range capable of reaching the small airways and inducing an inflammatory response in this region of the lung. We therefore examined whether naturalistic exposure to cat allergen in a 50 m3 room that contained two neutered cats could induce late allergic responses in the small airways detectable by HRCT using techniques of QIA. Ten subjects with cat-induced asthma were examined both physiologically and using HRCT before and 6 and 22 hours after a cat-room challenge (4). While there was no significant decline in FEV1 at 6 or 22 hours, HRCT QIA revealed increased regional air trapping at both 6 and 22 hours after challenge; a representative example is shown in Figure 2A. FEF25–75% did decline significantly at 6 hrs but not at 22 hours and closing volume, but not plethysmographically determined RV, increased significantly at both times periods after challenge. Interestingly, while the PC20 measured using FEV1 did not change from baseline after 22 hours, the change in CT attenuation in a selected region of the lung increased in response to methacholine at 22 hours after challenge occurred, indicating an increase in regional hyperresponsiveness (example is illustrated in Figure 2B). These findings indicate that a real-world exposure to cat allergen can cause both narrowing of small airways evident at 6 hrs (late asthmatic reaction) that persists for as long as 22 hours and is associated with regional hyperresponsiveness detectable by HRCT 22 hours after challenge that is not detectable spirometrically. Moreover, changes in two of the sensitve physiologic measures (closing volume and FEF25–75%) paralleled the HRCT findings at one or both time points, supporting the validity of the latter findings. It is noteworthy, however, that subjects had no symptoms of asthma 22 hrs after the cat room challenge despite the significant HRCT changes. While the clinical significance of these findings is therefore uncertain, it is possible that these changes represent clinically and physiologically silent distal lung inflammation that could serve as a substratum on top of which clinically significant asthma events could be superimposed.
Figure 2.
Figure 2A. Lung attenuation curves before (baseline, solid black line) and 6 (dashed black line) and 22 (dot-dashed grey line) hours after cat room challenge (CRC). At 6 hours and to a lessor degree at 22 hours there is an increase in airtrapping. A left shift in the lung attenuation curve indicates more airtrapping. HU = Hounsfield units. CRC = Cat room challenge.
Figure 2B. Lung attenuation curves before (solid lines) and after (dashed lines) methacholine before (baseline, black lines) and 22 hrs after (grey lines) cat room challenge. Methacholine causes an increase in airtrapping (left shift in lung attenuation). However, 22 hours after cat room challenge, methacholine produces a further increase in airtrapping. HU = Hounsfield units. CRC = Cat room challenge. MCT = methacholine challenge test.
Thus, quantitative image analysis of HRCT scans is a sensitive noninvasive method of assessing involvement of small airways in asthmatic patients and is capable of detecting narrowing of the distal airways (regional air-trapping) and increased responsiveness of these airways to methacholine (regional increases in air-trapping after methacholine) in response to various interventions when changes in traditional physiologic tests are largely undetectable. At present QIA of HRCT remains a research tool, the clinical utility of which remains to be determined. Limitations of this technique include radiation exposure, particularly with repeated imaging, and expense.
HYPERPOLARIZED HELIUM-3 MR IMAGING OF THE DISTAL LUNG
Magnetic resonance (MR) imaging with inhaled “hyperpolarized” helium-3 (3He) gas is an investigational technique with which high resolution images of the lung airspaces can be acquired (5, 6). Before imaging the 3He gas needs to be hyperpolarized in a special device (polarizer) and it typically takes several hours to produce liter quantities of the gas. When 3He gas is inhaled and imaging performed, the gas polarization quickly decreases (loses signal) by the radiofrequency pulses of the MR scanner and as a result, the number of images that can be obtained from one inhalation of gas is limited. This is in contrast to conventional hydrogen-based (1H) MR imaging, a technique with which unlimited numbers of images can be acquired, because the strong magnetic field of the MR scanner causes the polarization of the nuclei to quickly recover after each pulse. However, 1H MR imaging is poorly suited for airway imaging because the concentration of 1H nuclei (i.e. water) in air is low.
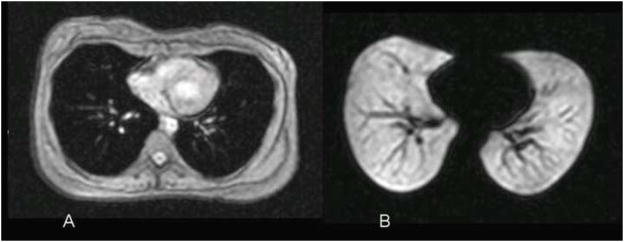
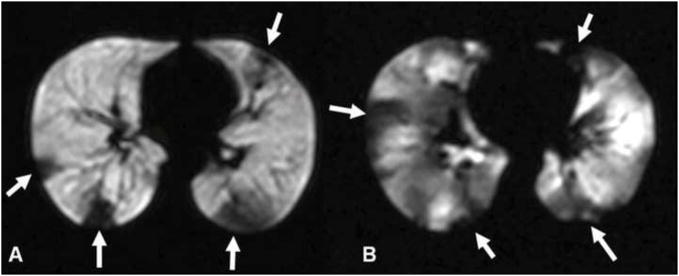
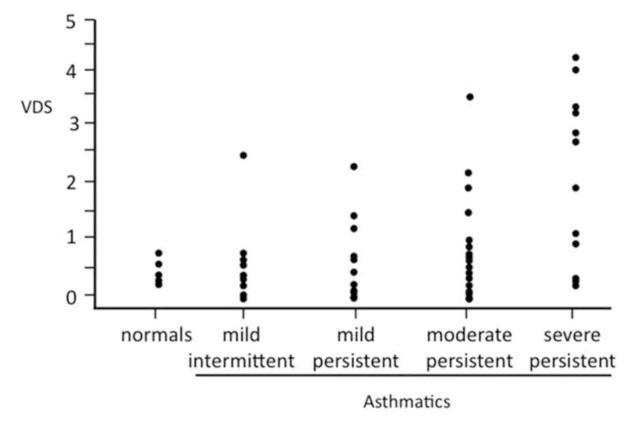
When the 3He gas is inhaled, the gas distributes evenly in the healthy lung and the airspaces are shown as homogeneous bright (white) structures (7–9). When there is airflow obstruction, for instance from airway closure as in asthma, the airspaces distal to the obstruction do not fill and are shown as black because of the lack of signal (figure 3). These foci of decreased or absent signal are also referred to as “ventilation defects”, and quantification of the defects provides a measure of the regional airflow. Since airflow obstruction forms the mainstay of the disease, ventilation defects are commonly found in patients with asthma, and we demonstrated in a recent study involving 58 asthmatics with differing severity and 18 age-matched healthy subjects that the number and size of the defects correlate with clinical measures of disease severity, and with spirometry (10)(figures 4–5). It was also shown that the mean number of ventilation-defects-per-image slice (VDS) for the asthmatics with moderate and severe persistent disease (11) was significantly greater than that for those with mild intermittent and mild persistent disease (1.37±0.24 versus 0.53±0.12; p<0.001). Another interesting finding was that there were more asthmatics with abnormal VDS than with abnormal FEV1, FVC, FEV/FVC or PEF. The number of asthmatics with abnormal VDS and abnormal FEF25%–75% was about the same. This could imply that VDS most closely correlates with FEF 25%–75%. It has been suggested that FEF25%–5% is sensitive to narrowing of the small airways and thus the abnormal VDS may be related to changes involving those airways (12, 13). However, other studies have had difficulty identifying objective changes in the small airways (14, 15) and it remains therefore uncertain which airways are involved when abnormalities in VDS are found in patients with asthma.
Figure 3.
Normal subject. (A) Conventional axial 1H MR image of the chest showing the soft tissues of the chest. The airspaces of the lung show as dark due to the low water content. (B) Corresponding 3He MR image obtained immediately after inhalation of the hyperpolarized helium-3 gas shows homogeneous, bright appearance of the gas-filled airspaces. The dark linear structures within the lungs represent the pulmonary vessels. Reprinted with permission from Chest 2006;130:1055–62.
Figure 4.
Axial 3He MR ventilation images of (A) moderate and (B) severe persistent asthmatic. There are few defects in A while there are many in B (several defects indicated with arrows). The defects in B are mostly pleural-based suggesting subsegmental narrowing or complete obstruction of small airways. In B the defects also involve the central portions of the lung indicating that the proximal airways are also involved. Reprinted with permission from Chest 2006; 130:1055–62.
Figure 5.
Scatterplot showing distribution of mean number of ventilation defects (VDS) for each subject by disease severity. Within asthma subgroups, there is positive correlation between mean VDS and asthma severity (r=0.39, p=0.003), with the number of ventilation defects becoming greater with increasing disease severity. Reprinted with permission from Chest. 2006;130:1055–62.
The ventilation defects can be remarkably persistent over time. Investigation recently showed that patients who were imaged twice within 42–82 minutes had 75% of defects remaining in the same location, and that most (71%) of these defects did not change size (16). When patients were imaged at longer (1–476 days) intervals there was relatively little change in total number of defects for each asthmatic, although the number of defects that remained in the same location decreased over time. However, a considerable number of defects remaining in the same location did not change size, with 67% of these still unchanged in size after 31 days (median interval), 43% after 41 days, and 38% after 85 days (figure 6). Thus, in certain regions of the lungs the airways appeared to remain persistently narrowed with time. This trend was regardless of disease severity or whether the patients used asthma medications.
Figure 6.
Long term assessment of ventilation defects (A) Large (arrow) and small defect (small arrow) are shown at baseline. (B) The defects are unchanged in location and size (arrow) 38 days later. (C) The large defect is also unchanged at 412 days (arrow). The small defect (small arrow) has slightly decreased in size, and a new central defect (open arrow) has developed. Reprinted with permission from Radiology. 2009;250:567–75
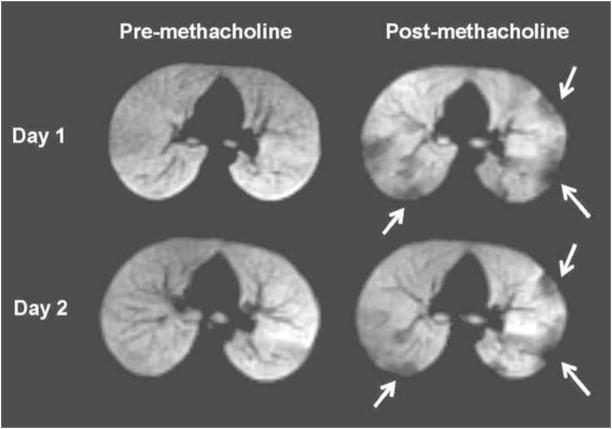
It has also been shown that ventilation defects increase in number and extent when bronchoconstrictor (methacholine) is given, as can be expected from the increase in airflow obstruction caused by the medication. This can also be demonstrated with exercise in patients who are sensitive to this (17). However, when methacholine is given repeatedly, that is, the same dose on two different days, there appears to be a marked tendency for certain airways to respond to the same degree with each challenge (18). More specifically, we found that 69% of the ventilation defects that appeared at the first challenge also occurred at the second, and of those 43% had the same size (figure 7). These findings seem to suggest that certain airways are more sensitive to the methacholine than others, and some not at all. We have also shown that when β-agonist is given the defects decrease in number and FEV1 increases, as would be expected from the improvement of airflow caused by the bronchodilator (19). When the effects of the medication wear off the airways close down again and the defects recur (20). In few patients one can see an increase in defects after a bronchodilator is given suggesting paradoxic bronchoconstriction (21, 22).
Figure 7.
Pre- (left) and post-methacholine (right) images from Day 1 are on top and from Day 2 (97 days later) at the bottom. All images are from the same subject and at the same anatomic level. At baseline there are no ventilation defects at this slice position on both days. After methacholine multiple defects (arrows) have developed, with many of these in the same location on both days (several pointed with arrows).
Using 3He MR one can also obtain spatial information about the lung microstructure by measuring the diffusivity of the gas in the lung, that is the degree to which 3He atoms move within the airspaces. Studies have demonstrated that the 3He diffusivity is increased in patients whose airspaces are known to be enlarged, such as in chronic obstructive pulmonary disease (COPD) (23). It has also been found in an animal study that the increase in the apparent diffusion coefficient (ADC) of 3He correlates directly with size of the alveolar spaces (24). Initial investigation using this technique have shown variable results in patients with asthma (25). However, using a more sensitive method for measuring 3He diffusivity in 14 patients with severe, difficult-to-treat asthma, we found a slight but significant increase in ADC compared to healthy subjects although the values were substantially lower than those seen in COPD patients (26). An interesting finding was also that the ADC values remained elevated when patients were treated with oral steroids while there was improvement of the regional airflow evidenced by a decrease in the number of ventilation defects (27). In many of these patients no abnormalities were shown with computed tomography (CT). Therefore, the cause of the ADC elevation in the patients with severe asthma is uncertain but may reflect permanent alterations of the airway structure or tissue remodeling.
In summary, with hyperpolarized 3He MR imaging the changes of airflow in the distal airways can be assessed in great detail and are depicted as ventilation defects. These defects can be markedly persistent in some areas of the lung suggesting a relative regional distribution of the disease. A focal distribution of disease is also suggested from the relative persistent, regional response that can occur following repeat methacholine challenge. While medications such as short acting bronchodilators and oral steroids lead to improvement of the regional airflow, evidenced by the decrease in number and size of the ventilation defects, persistent alterations in 3He diffusivity can be demonstrated in the lungs of severe asthmatics possibly reflecting permanent structural changes of the airways or tissue remodeling. Hyperpolarized helium-3 MR imaging may become an important tool for assessing the distal airways in patients with asthma.
Acknowledgments
Symposium funded by an unrestricted grant from Teva Pharmaceutical Industries.
The authors thank Drs. Michelle Zeidler, Eric Kleerup, Jonathan Goldin, Talissa Altes, Chengbo Wang and John Mugler for their contributions to the research presented in this article. The 3He MR imaging studies were funded by the National Institutes of Health/National Heart, Lung, and Blood Institute (grant RO1 HL66479) and by contributions from the Commonwealth of Virginia Technology Research Fund (grant IN2002–01) and Siemens Medical Solutions.
- ADC
apparent diffusion coefficient
- BDP
beclomethasone
- COPD
chronic obstructive pulmonary disease
- CRC
cat room challenge
- CT
computerized tomography
- CFC
chlorofluorocarbon
- FEF
forced expiratory flow
- FEV1
forced expiratory volume in 1 second
- FRC
functional residual capacity
- FVC
forced vital capacity
- H
hydrogen
- He
helium
- HFA
hydrofluoroalkane
- HRCT
high resolution computerized tomography
- HU
hounsfield units
- LAC
lung attenuation frequency
- MC
methacholine
- MCT
methacholine challenge test
- MR
magnetic resonance
- PC20
provocative concentration of methacholine that produces a 20% fall in FEV 1
- PEF
peak expiratory flow
- QIA
quantitative image analysis
- RV
residual volume
- VDS
ventilation defects per image slice
Footnotes
Publisher's Disclaimer: This is a PDF file of an unedited manuscript that has been accepted for publication. As a service to our customers we are providing this early version of the manuscript. The manuscript will undergo copyediting, typesetting, and review of the resulting proof before it is published in its final citable form. Please note that during the production process errors may be discovered which could affect the content, and all legal disclaimers that apply to the journal pertain.
References
- 1.McNitt-Gray MF, Goldin JG, Johnson TD, Tashkin DP, Aberle DR. Development and testing of image-processing methods for the quantitative assessment of airway hyperresponsiveness from high-resolution CT images. J Comput Assist Tomogr. 1997 Nov-Dec;21(6):939–47. doi: 10.1097/00004728-199711000-00017. [DOI] [PubMed] [Google Scholar]
- 2.Goldin JG, McNitt-Gray MF, Sorenson SM, Johnson TD, Dauphinee B, Kleerup EC, et al. Airway hyperreactivity: assessment with helical thin-section CT. Radiology. 1998 Aug;208(2):321–9. doi: 10.1148/radiology.208.2.9680554. [DOI] [PubMed] [Google Scholar]
- 3.Goldin JG, Tashkin DP, Kleerup EC, Greaser LE, Haywood UM, Sayre JW, et al. Comparative effects of hydrofluoroalkane and chlorofluorocarbon beclomethasone dipropionate inhalation on small airways: assessment with functional helical thin-section computed tomography. J Allergy Clin Immunol. 1999 Dec;104(6):S258–67. doi: 10.1016/s0091-6749(99)70043-6. [DOI] [PubMed] [Google Scholar]
- 4.Zeidler MR, Goldin JG, Kleerup EC, Kim HJ, Truong DA, Gjertson DW, et al. Small airways response to naturalistic cat allergen exposure in subjects with asthma. J Allergy Clin Immunol. 2006 Nov;118(5):1075–81. doi: 10.1016/j.jaci.2006.06.042. [DOI] [PubMed] [Google Scholar]
- 5.Middleton H, Black RD, Saam B, Cates GD, Cofer GP, Guenther R, et al. MR imaging with hyperpolarized 3He gas. Magn Reson Med. 1995 Feb;33(2):271–5. doi: 10.1002/mrm.1910330219. [DOI] [PubMed] [Google Scholar]
- 6.MacFall JR, Charles HC, Black RD, Middleton H, Swartz JC, Saam B, et al. Human lung air spaces: potential for MR imaging with hyperpolarized He-3. Radiology. 1996 Aug;200(2):553–8. doi: 10.1148/radiology.200.2.8685356. [DOI] [PubMed] [Google Scholar]
- 7.de Lange EE, Mugler JP, 3rd, Brookeman JR, Knight-Scott J, Truwit JD, Teates CD, et al. Lung air spaces: MR imaging evaluation with hyperpolarized 3He gas. Radiology. 1999 Mar;210(3):851–7. doi: 10.1148/radiology.210.3.r99fe08851. [DOI] [PubMed] [Google Scholar]
- 8.Moller HE, Chen XJ, Saam B, Hagspiel KD, Johnson GA, Altes TA, et al. MRI of the lungs using hyperpolarized noble gases. Magn Reson Med. 2002 Jun;47(6):1029–51. doi: 10.1002/mrm.10173. [DOI] [PubMed] [Google Scholar]
- 9.van Beek EJ, Wild JM, Kauczor HU, Schreiber W, Mugler JP, 3rd, de Lange EE. Functional MRI of the lung using hyperpolarized 3-helium gas. J Magn Reson Imaging. 2004 Oct;20(4):540–54. doi: 10.1002/jmri.20154. [DOI] [PubMed] [Google Scholar]
- 10.de Lange EE, Altes TA, Patrie JT, Gaare JD, Knake JJ, Mugler JP, 3rd, et al. Evaluation of asthma with hyperpolarized helium-3 MRI: correlation with clinical severity and spirometry. Chest. 2006 Oct;130(4):1055–62. doi: 10.1378/chest.130.4.1055. [DOI] [PubMed] [Google Scholar]
- 11.2 NAEaPPEPR; National Heart LaBI. Guidelines for the Diagnosis and Management of Asthma. NIH Publication; 1997. p. 4051. [Google Scholar]
- 12.Lung function testing: selection of reference values and interpretative strategies. American Thoracic Society. Am Rev Respir Dis. 1991 Nov;144(5):1202–18. doi: 10.1164/ajrccm/144.5.1202. [DOI] [PubMed] [Google Scholar]
- 13.Fonseca-Guedes CH, Cabral AL, Martins MA. Exercise-induced bronchospasm in children: comparison of FEV1 and FEF25-75% responses. Pediatr Pulmonol. 2003 Jul;36(1):49–54. doi: 10.1002/ppul.10309. [DOI] [PubMed] [Google Scholar]
- 14.Cosio M, Ghezzo H, Hogg JC, Corbin R, Loveland M, Dosman J, et al. The relations between structural changes in small airways and pulmonary-function tests. N Engl J Med. 1978 Jun 8;298(23):1277–81. doi: 10.1056/NEJM197806082982303. [DOI] [PubMed] [Google Scholar]
- 15.Petty TL. Simple office spirometry. Clin Chest Med. 2001 Dec;22(4):845–59. doi: 10.1016/s0272-5231(05)70070-8. [DOI] [PubMed] [Google Scholar]
- 16.de Lange EE, Altes TA, Patrie JT, Battiston JJ, Juersivich AP, Mugler JP, 3rd, et al. Changes in regional airflow obstruction over time in the lungs of patients with asthma: evaluation with 3He MR imaging. Radiology. 2009 Feb;250(2):567–75. doi: 10.1148/radiol.2502080188. [DOI] [PubMed] [Google Scholar]
- 17.Samee S, Altes TA, Powers P, de Lange EE, Knight-Scott J, Rakes G, et al. Imaging the lungs in asthmatic patients by using hyperpolarized helium-3 magnetic resonance: assessment of response to methacholine and exercise challenge. J Allergy Clin Immunol. 2003 Jun;111(6):1205–11. doi: 10.1067/mai.2003.1544. [DOI] [PubMed] [Google Scholar]
- 18.de Lange EE, Altes TA, Patrie JT, Parmar J, Brookeman JR, Mugler JP, 3rd, et al. The variability of regional airflow obstruction within the lungs of patients with asthma: assessment with hyperpolarized helium-3 magnetic resonance imaging. J Allergy Clin Immunol. 2007 May;119(5):1072–8. doi: 10.1016/j.jaci.2006.12.659. [DOI] [PubMed] [Google Scholar]
- 19.Gaare JD, Altes TA, Knake JJ, Brookeman JR, Mugler JP, de Lange EE. Hyperpolarized Helium-3 MR (H3-HeMR) Imaging of the Lung in Asthmatics: Ventilation Changes Following Treatment with Albuterol. Proc RSNA 90th meeting; 2004. p. 514. [Google Scholar]
- 20.Neda S, Altes TA, Mugler JP, Ruppert K, de Lange EE. Regional Response to Short-Acting Bronchodilator within the Lungs of Asthmatics as Depicted by Hyperpolarized Helium-3 MR imaging. Proc RSNA 94th meeting; 2008. p. 514. [Google Scholar]
- 21.Broski SE, Amundson DE. Paradoxical response to levalbuterol. J Am Osteopath Assoc. 2008 Apr;108(4):211–3. [PubMed] [Google Scholar]
- 22.Raghunathan K, Nagajothi N. Paradoxical bronchospasm: a potentially life threatening adverse effect of albuterol. South Med J. 2006 Mar;99(3):288–9. doi: 10.1097/01.smj.0000202699.93002.e8. [DOI] [PubMed] [Google Scholar]
- 23.Salerno M, de Lange EE, Altes TA, Truwit JD, Brookeman JR, Mugler JP., 3rd Emphysema: hyperpolarized helium 3 diffusion MR imaging of the lungs compared with spirometric indexes--initial experience. Radiology. 2002 Jan;222(1):252–60. doi: 10.1148/radiol.2221001834. [DOI] [PubMed] [Google Scholar]
- 24.Mata JF, Altes TA, Cai J, Ruppert K, Mitzner W, Hagspiel KD, et al. Evaluation of emphysema severity and progression in a rabbit model: comparison of hyperpolarized 3He and 129Xe diffusion MRI with lung morphometry. J Appl Physiol. 2007 Mar;102(3):1273–80. doi: 10.1152/japplphysiol.00418.2006. [DOI] [PubMed] [Google Scholar]
- 25.Fain SB, Altes TA, O’Halloran R, Sorkness RL, Evans MD, Korosec FR, et al. Comparison of diffusion weighted helium-3 MRI in patients with asthma versus those with COPD. Proc Intl Soc Mag Reson Med. 2006 [Google Scholar]
- 26.Wang C, Altes TA, Mugler JP, 3rd, Miller GW, Ruppert K, Mata JF, et al. Assessment of the lung microstructure in patients with asthma using hyperpolarized 3He diffusion MRI at two time scales: comparison with healthy subjects and patients with COPD. J Magn Reson Imaging. 2008 Jul;28(1):80–8. doi: 10.1002/jmri.21408. [DOI] [PMC free article] [PubMed] [Google Scholar]
- 27.Wang C, Sarti M, Olazagasti J, Altes TA, Mugler JP, de Lange EE. Effects of oral corticosteroid treatment on the ventilation and lung microstrucutre in patients with severe asthma: Assessment with hyperpolarized helium-3 MR imaging. Proc RSNA 94th meeting; 2008. p. 304. [Google Scholar]


