

Abstract
Prior investigations have reported that changes in the prefrontal electroencephalogram (EEG) precede symptom improvement from antidepressant medications, and could serve as a biomarker of treatment outcome in major depressive disorder (MDD). A new physiologically-defined region of interest, overlying the midline and right frontal (MRF) cortical area, was examined here for a relationship between early decreases in theta-band cordance and remission. Subjects were 72 adults with unipolar MDD who had completed placebo-controlled antidepressant treatment trials, with 37 randomized to medication and 35 to placebo. We assessed changes in cordance and absolute and relative power in the MRF region at 48 hours, 1 week, and 2 weeks after start of drug, as potential predictors of remission (final Ham-D17 ≤5). Eleven of 37 medication subjects (30%) remitted vs 6 of 35 placebo subjects (17%). Change in MRF cordance one and two weeks after start of drug was significantly associated with remission in medication subjects (P=0.02 at 1 week), with Receiver Operating Characteristic (ROC) analysis yielding 0.76 area under the curve. Decreases in MRF cordance at 1 week predicted remission with medication with 69% overall accuracy (90% sensitivity; 60% specificity). MRF cordance changes were not associated with remission with placebo. Absolute and relative power did not differentiate groups. These results suggest that remission may be predictable from physiologic measurements after 1 week of treatment, and that this region merits further investigation in the neurobiology of treatment response.
Additional Keywords: EEG, cordance, neurophysiology, biomarker, remission, major depression
1. Introduction
Achievement of remission has been identified as the key objective of treatment for major depressive disorder (MDD) (cf. Nierenberg and Wright, 1999; cf. Keller, 2004). Although some 85–90% of patients can eventually experience symptomatic improvement with antidepressant medications, attaining this objective remains elusive. In the STAR*D effectiveness study of “real world” patients with MDD (“Sequenced Treatment Alternative to Relieve Depression” http://star-d.org), less than a third achieved remission with the first antidepressant trial, despite aggressive dosing, close measurement-based monitoring, and a 12-week period to exhibit improvement (Trivedi et al., 2006a); at the end of a second level of randomized treatment, the total fraction of remitted subjects was approximately 50%, leaving almost half of subjects with incomplete responses (Rush et al., 2006; Trivedi et al., 2006b). Ominously, patients who do not achieve remission suffer not only ongoing symptoms, but also persistent impairments in psychosocial function (Miller et al., 1998; Papakostas et al., 2004), functional disability at work and home (Mojtabai, 2001; Ormel et al., 2004; Vos et al., 2004), and increased rates of relapse (Paykel et al., 1995; Judd et al., 1998; Nierenberg and Wright, 1999). In a comparison of long-term outcomes for individuals who entered follow-up after an acute course of treatment either with or without residual symptoms, Paykel and colleagues (1995) found that 76% of subjects who entered follow-up with residual symptoms (i.e., response but not remission) had relapsed by 15 months vs only 25% of those who had experienced an initial remission, giving added clinical significance to this distinction in outcome threshold. Means to achieve remission have been the focus of large-scale investigations. Algorithm-based approaches, such as studied in the TMAP (“Texas Medication Algorithm Project”, Rush et al., 1999; Trivedi et al., 2000) and STAR*D trials, provide an evidence base for selecting subsequent treatments, but these decisions are made for individual patients only after a remission has failed to occur despite an adequate trial of a particular intervention, a process which takes weeks to months for each sequential trial. The duration of algorithm-based treatment could be shortened if practitioners could identify, early in a treatment phase, those individuals who are unlikely to remit, and institute different, augmented, and/or more complex treatments sooner for those patients who need them.
We have previously reported data with the quantitative electroencephalography (QEEG) measure cordance that showed a relationship between changes in prefrontal brain activity in the first one-to-two weeks of treatment and later clinical outcome, considering a response threshold of 10 on the 17-item Hamilton Depression Rating Scale (Cook and Leuchter, 2001; Cook et al., 2002; 2005). Cordance is a continuous numerical measure of regional brain activity, described in a series of publications from our group and other independent, international researchers (e.g., Leuchter et al., 1999, 2002, 2004; Cook and Leuchter 2001; Cook et al., 2002, 2005; Stubbeman et al., 2004; Hunter et al., 2005, 2006, 2008; Bareš et al., 2007, 2008; Kopeček 2006, 2007, 2008; Morgan et al., 2007); it combines complementary information from absolute and relative power EEG spectral measures to yield a metric which had a stronger correlation with regional cerebral perfusion than either component alone (Leuchter et al., 1999), providing a physiologic framework for the interpretation of findings. These earlier studies examined an empirically-predefined region of interest (ROI) that included prefrontal EEG channels bilaterally and at the midline (FP1, FP2, and FPZ electrodes, figure 1a). This association between early prefrontal changes and later clinical outcome was independently replicated and extended by Bareš and colleagues (2007, 2008), expanding the evidence for use of cordance as a predictive biomarker in treatment for MDD. None of these trials, however, used remission as the clinical endpoint criterion.
Figure 1. Electrode Placements and Regions of Interest.
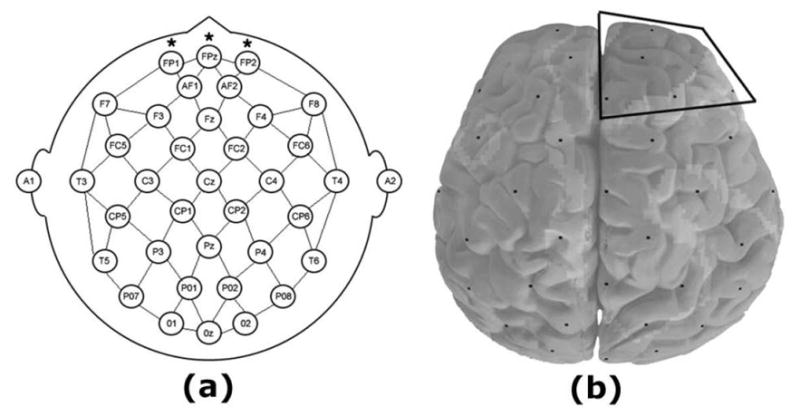
Panel (a) shows the placement of 35 electrodes in accordance with the International 10–20 system; previously examined Region of Interest (ROI) included FP1, FPz, and FP2 electrodes (marked with asterisks). In Panel (b), the Midline and Right Frontal Cortical (MRFC) ROI includes Fpz, Fz, Fp2, AF2, F4, and F8 electrodes, outlined with black lines. Images depict the head from above.
In addition to our prior studies of cordance during treatment in patients with MDD, we also have examined cordance in non-depressed individuals. In a separate investigation, a sample of psychiatrically-well adults were studied to determine the behavior of cordance during exposure to an antidepressant or placebo in never-depressed brains (Leuchter et al., 2008). In that study, we reported that cordance values in the prefrontal region did not change differently in the medication and placebo groups; however, a different region was identified via hierarchical cluster analysis (Milligan and Cooper, 1987; Mirkin, 1996; Mojena, 1977) that exhibited differential changes under medication vs placebo exposure. The cluster analysis method identifies groups of locations (e.g., voxels for positron emission tomography (PET) studies or electrodes for QEEG experiments) which exhibit a common trait, such as being characterized by significantly intercorrelated cordance values. Electrodes overlying a midline and right frontal cortical area were found uniquely to form such a cluster (figure 1b). In comparisons of medication and placebo exposure, this ROI exhibited significant differences at 48 hours and 1 week: healthy subjects receiving medication exhibited a decrease in cordance in that area, whereas the placebo-exposed subjects did not. This was the only identified region observed to exhibit this property (Leuchter et al., 2008).
Given the physiologically-determined basis of this new ROI (figure 1b), the present analysis was undertaken to examine the predictive properties of a midline and right frontal (MRF) cordance regional measure; we hypothesized that early decreases in cordance in this ROI would be associated with remission of symptoms from medication, but not placebo.
2. Methods
2.1 Subjects and trial design
Subjects were 72 adult outpatients with unipolar MDD, who had completed one of three 8-week, placebo-controlled antidepressant treatment trials conducted in our lab. All protocols had been reviewed and approved by the UCLA Institutional Review Board and subjects had given informed consent to participate in research, as per the provisions of the Declaration of Helsinki.
All three trials shared the same fundamental design and entry criteria, described fully in Cook et al. (2002), and summarized briefly here. After giving consent and enrolling, subjects were assessed clinically with a structured interview (including SCID-P (First et al., 1994)) to determine that they met criteria for the presence of unipolar MDD with a score 16 or greater on the 17-item Hamilton Depression Rating Scale (Ham-D17), and were without other psychiatric comorbidities except for anxiety-spectrum disorders. Exclusionary criteria included the presence of any poorly controlled medical illness that could affect brain function (e.g., untreated hypothyroidism), concurrent use of medications that could interfere with EEG activity (e.g., benzodiazepines), or any history of head trauma, brain surgery, or skull defect. These entry criteria had been established to allow enrollment of subjects with moderate to severe levels of depressive symptomatology (cf. Rush et al., 2003) who were seeking treatment, and excluding subjects for whom the EEG assessments of brain function would be compromised by extraneous factors. The average Ham-D17 score in our sample was a 21.9 (s.d. 3.4), which is similar to the severity of depression of subjects in the STAR*D project (21.8 (s.d. 5.2)) (Trivedi et al., 2006a). Demographically, the medication group was 62.2% female with a mean age of 42.7 (s.d. 12.3) years; the placebo group (n=35) was 51.7% female with a mean age of 40.6 (s.d. 11.9) years. Age, gender, and intake symptom severity did not different significantly among trial groups.
After clinical assessment, subjects began a 1-week single-blind placebo lead-in period. Subjects who still fulfilled entry criteria at the end of the lead-in period were then randomized to receive 8 weeks of placebo or antidepressant medication, administered under double-blind conditions. For the present analysis, we examined those subjects who completed the trial. Among the 37 medication subjects, 13 were assigned to fluoxetine (20 mg/d), and 24 to venlafaxine (150 mg/d). In the study with fluoxetine, doses were constant throughout the entire treatment period; in the venlafaxine studies, dosing began at 37.5 mg/d and was escalated to 150 mg/d by the end of week 2, and remained constant at that dose for the remaining weeks (with a matching increase in the number of placebo pills to maintain blinding).
2.2 EEG Methods
2.2.1 Data acquisition
Using procedures employed in our previous reports and summarized here, recordings were made with the QND System (Neurodata, Inc., Pasadena, CA). During recordings, subjects rested in the eyes-closed, maximally alert state, in a quiet room with subdued lighting. To avoid subject drowsiness, the technologists monitored the EEG data during the recording and re-alerted the subjects every 30–45 seconds as needed. Electrodes were placed with an electrode cap (ElectroCap, Eaton, OH) using 35 recording electrodes distributed across the head according to an extension of the International 10–20 System montage. Data were collected using a Pz referential montage and were digitized at 256 samples/channel/sec by the QND system (bandpass filtered 0.3 – 70 Hz). Each EEG recording was reviewed by a technologist who was blinded to subject identity, treatment condition, and clinical status; the first 20–32 seconds of artifact-free data were selected to be processed. These selections were confirmed by a second technologist.
2.2.2 Cordance calculations
Cordance values were calculated using an algorithm that has been detailed elsewhere (Leuchter et al., 1999) and may be summarized as follows. Cordance is computed by a normalization and integration of absolute and relative power values from all electrode sites for a given EEG recording; cordance values are calculated in three steps. First, EEG power values are computed using a re-attributional electrode montage in which power values from pairs of electrodes that share a common electrode are averaged together to yield the re-attributed power (Cook et al., 1998). This is similar to the single source method of Hjorth (1970, 1975), in which voltage signals are recombined, but the re-attributional montage approach has been shown to provide a higher association between QEEG measures and regional cortical perfusion than the Hjorth method (Cook et al., 1998). These absolute power values are used to derive relative power (percentage of power in each frequency band) for each electrode.
Second, these absolute and relative power values for each individual EEG recording are normalized across electrode sites, using a z-transformation statistic for each electrode site s in each frequency band f (yielding Anorm(s,f) and Rnorm(s,f) respectively). This normalization process places absolute and relative power values into a common unit (standard deviation or z-score units) which allows them to be combined. These z-scores are based on the average power values in each band for all electrodes within a given EEG recording (i.e., these are not z-scores referenced to a normative population).
Third, the cordance values are formed by summing the z-scores for normalized absolute and relative power (Z(s,f) = Anorm(s,f) + Rnorm(s,f), for each electrode site and in each frequency band). Cordance values have been shown to have higher correlations with regional cerebral blood flow than absolute or relative power alone (Leuchter et al., 1999), and thus this combination measure can be placed in context with prior work in depression that employed functional measures of brain activity such as PET scan data.
2.2.3 Midline and Right Frontal (MRF) Theta Cordance Measure
Cordance values at the FPz, Fz, FP2, AF2, F4, and F8 electrodes were averaged to form MRF regional measure for each subject at each assessment. In healthy adults receiving antidepressant medication (Leuchter et al., 2008), these electrodes uniquely had exhibited a significant intercorrelation in their change in cordance during medication exposure which was not present in subjects receiving placebo.
In this project we focused on theta-band cordance values because activity in the theta band has been consistently associated with depression and antidepressant medication effects in studies from our group and from others (Knott and Lapierre, 1987; Knott et al., 1996, 2000, 2001, 2002; Pizzagalli et al., 2001; Anderer et al., 2000; Ulrich et al., 1988a, 1988b, 1994; Bareš et al., 2007, 2008; Kopeček et al., 2007, 2008).
2.2.4 Power spectral measures
To allow post hoc comparisons of this work with prior studies employing traditional spectral power measures, absolute and relative power values were computed with a linked-ears montage, using the internal re-referencing of the QND system.
2.3 Data analysis
We used repeated measures ANOVA (SPSS version 15, SPSS Inc., Chicago IL) and logistic regression (LogXact 4.1, Cytel Software Corp, Cambridge MA) to assess changes in theta-band cordance in the MRFC region at 48 hours, 1 week, and 2 weeks after start of drug, as predictors of remission (final Ham-D17 ≤ 5). Though a threshold of 7 is commonly employed (cf Frank et al., 1991), a more stringent threshold of 5 was employed here because of work indicating that lower thresholds are associated with better functional outcomes (Zimmerman et al., 2007). Receiver operating characteristic (ROC) analyses were performed (with SPSS) to evaluate the classification accuracy of the MRF cordance measure.
3. Results
3.1 Clinical outcomes
Clinically, 11 of the 37 medication subjects (30%) met criteria for remission after 8 weeks of medication. Of the 35 subjects randomized to placebo, 6 (17%) remitted. Remission rate was not statistically different between treatment groups (Chi square 1.58, P = 0.21, 2-tailed). Group average Ham-D17 scores are plotted over time for the four groups (i.e., remitters and non-remitters, receiving medication or placebo) in Figure 2. The four outcome groups did not differ significantly on age (F(3,68)=1.50, P = 0.22) or gender (Chi square 1.25, P = 0.74, 2-tailed).
Figure 2. Clinical Symptoms Over Time.

Changes in Ham-D17 are plotted for the four groups (remitters and non-remitters on medication or placebo).
3.2 MRF cordance, MRF power, and symptom severity prior to treatment
The baseline values of cordance, absolute power, and relative power in the MRF ROI were compared for remitters vs non-remitters for medication subjects and for placebo subjects via ANOVA; no significant differences among the four groups were found (data not presented). Baseline severity on the Ham-D17 was similarly evaluated via ANOVA and no group differences were found.
3.3 MRF cordance and power changes with medication
The change in MRF cordance was significant in a repeated measures ANOVA with treatment outcome group (remission vs non-remission) as the between-subjects variable and time-point as a within-subjects variable. The model yielded a significant main effect of group (F(1,33) = 6.77, P = 0.014) and no significant effect of time or group-by-time interaction. Change in MRF cordance after one week of medication (n = 35) was significantly associated with remission (logistic regression coefficient = −1.10, SE = 0.49, exact P = 0.017). After two weeks of medication (n = 36), change in MRF cordance also showed a statistical significance in the same, decreasing direction (coefficient = −1.08, SE = 0.62, exact P = 0.049). Differences at 48 hours were not statistically different between groups. The time course of these MRF cordance changes in shown in Figure 3 and values are presented in the Table. A repeated measures ANOVA was then used to examine absolute and relative power in the MRF region. For absolute power, there was not a significant effect of group (F(1,19) = 0.58, P = 0.46) or time (F(2,19) = 2.12, P = 0.13), or group × time interaction (F(2,19) = 3.06, P = 0.059). In the analysis of relative power we again did not find a significant effect of group (F(1,19) = 3.48, P = 0.078) or time (F(2,19) = 0.46, P = 0.63), or group × time interaction (F(2,19) = 0.63, P = 0.54).
Figure 3. Time Course of MRFC Change.

Changes in MRFC at 48 hrs and 1 and 2 weeks of treatment, in subjects in remission (solid line with circles) and non-remission subjects (dashed line with squares) subjects. Groups show statistical separation at one and two weeks of exposure to medication. * p < 0.05
Table.
Cordance Values Over Time. Cordance values at baseline and changes over time are shown for the four groups.
| Baseline Cordance | Change at 48 hrs | Change at 1 week | Change at 2 weeks | |
|---|---|---|---|---|
| Medication Remitters | 0.42 (1.29) | − 0.53 (0.60) | −1.14 (0.77) | − 0.49 (0.61) |
| Medication Non-Remitters | 0.34 (1.05) | − 0.24 (0.76) | − 0.03 (0.76) | − 0.10 (0.87) |
| Placebo Remitters | 0.35 (0.99) | − 0.18 (0.89) | 0.01 (0.38) | − 0.10 (0.38) |
| Placebo Non-Remitters | −0.18 (0.96) | 0.07 (0.58) | 0.09 (0.84) | 0.07 (0.91) |
ROC analysis of the one-week MRF cordance as a predictor of remission in the medication subjects yielded an area under the curve (AUC) of 0.76. Using a threshold (“cutpoint”) of 0 to stratify the physiologic changes, decreases in MRF cordance predicted remission with 69% overall accuracy (90% sensitivity; 60% specificity). For medication subjects, for a cordance decrease at 1 week was associated with a positive predictive value of 0.45 (proportion of subjects with a decrease who remitted as predicted), and a negative predictive value of 0.94 (proportion of subjects without the decrease who did not remit).
3.4 Comparison with Placebo Subjects
As a control condition, we also evaluated data on the 35 subjects from these trials who had been assigned to receive placebo. Changes in MRF cordance at 48 hours, 1 week, or 2 weeks were not significantly associated with remission in our logistic regression models.
3.5 Post hoc consideration of handedness
Because hemispheric function may be lateralized differently in right-handed vs left-handed individuals, we conducted a post hoc analysis to evaluate this potential confound. Self-reported handedness did not differ between medication and placebo groups (MED: 29 right handed (RH) and 8 left handed (LH) subjects; PBO: 28 RH and 7 LH; Chi square 0.029, P = 0.87) or between remission and non-remission groups overall (remit: 14 RH and 3 LH, non-remit: 43 RH and 12 LH; Chi square 0.137, P = 0.71). There was no difference between remitters and non-remitters in the medication group in particular (remit: 8 RH and 3 LH, non-remit: 21 RH and 5 LH; Chi square 0.295, P = 0.59).
4. Discussion
Our primary finding was that changes in EEG cordance after one week of antidepressant medication were predictive of remission after 8 weeks on that medication. This result expands prior findings of EEG changes that precede symptomatic response to antidepressant treatment, by focusing on remission as the salient clinical endpoint and using an a priori region of interest derived from physiologic findings in never-depressed adults exposed to antidepressants. Our results suggest that remission with antidepressant medications may be predictable from measurements of brain function after 1 week of treatment.
This finding is consonant with other work about ROIs associated with depression. Prefrontal cortical regions have been implicated in the pathophysiology of MDD and in treatment response, particularly dorsolateral prefrontal cortex (PFC) (recently reviewed by: Brody et al., 2001; Davidson et al., 2002; Phillips et al., 2003; Rogers et al., 2004; Fitzgerald et al., 2006). A role for the anterior cingulate cortex (ACC) region has also been identified in the response to antidepressant treatment (Brody et al., 2001; Mayberg et al., 2000). The ACC is distant from the scalp electrodes used in this project, but studies which integrate EEG and magneto-encephalography (MEG) recordings have revealed correlations between the MEG signals from the ACC and simultaneous EEG activity recorded over PFC in the theta band (Asada et al., 1999; Ishii et al., 1999). We interpret the cordance values recorded from our MRF region of interest as likely reflecting both projected rhythms from ACC sources and intrinsic activity within the PFC.
Functional differences between the left and right cerebral hemispheres have been described by other researchers as well. In the “valence effect” theory of emotional processing by the brain, it has been suggested that the left hemisphere specializes in processing positively-valenced material, while the right hemisphere is adapted to the processing of negative stimuli (cf. Davidson, 1993, 2003). Our present findings suggest that, much as non-depressed healthy subjects exhibited a right frontal regional change in brain activity during exposure to antidepressant medication (Leuchter et al., 2008), the emergence of remission may be associated with a similar regional brain change. Our group (Cook and Leuchter 2001; Cook et al., 2002, 2005) and other researchers (Bareš et al., 2007, 2008; Kopeček 2006, 2007, 2008) have previously focused on a bilateral ROI involving the EEG electrodes overlying the most anterior portions of the prefrontal cortex, based on prior empiric observations. This new finding with this MRF ROI suggests that additional prospective investigations are needed to compare and refine the biomarkers to optimize potential application in treatment planning. For example, cluster analysis could be undertaken in depressed subjects as a method to identify region(s) of interest associated with outcome; such ROIs could then be evaluated prospectively in future datasets to test their validity.
We did not find an association between MRF cordance changes and outcome in subjects receiving placebo. This suggests that these early cordance changes are reflecting neither simply improvement in symptom severity nor exposure to medication, but rather some interplay between those two factors in those subjects who will exhibit a “specific response” (cf. Leuchter et al., 2002) to the administered pharmacotherapy. We interpret our findings as supporting measurement of changes in regional brain activity as a biomarker which is predictive of later attainment of remission with antidepressant treatment.
Limitations of this project include the modest sample size and the use of fluoxetine or venlafaxine as the only interventions. Regarding our clinical sample, subjects with comorbid anxiety were included to improve generalizability of findings to MDD patients seeking care, but we did not have sufficient information to perform a stratified analysis of MRF cordance changes in individuals with or without anxiety; because our ROI has been implicated in anxiety conditions as well as in MDD by some studies (Blackhart et al., 2006; Kline and Allen, 2008; Kim et al., 2008; Gotlib, 1998. Schmidt, 1999) though not by all (e.g., Warwick et al., 2008), future investigations may usefully record the presence and severity of comorbid anxiety-spectrum symptoms and disorders to permit such analyses. Additionally, while the MRF ROI showed encouraging overall accuracy (AUC), other parameters (e.g., positive predictive value) suggest that further refinement to the physiologic biomarker approach is desirable before clinical application could be considered.
The reliability, reproducibility, and generalizability of this potential biomarker of remission need to be tested prospectively, and in comparison to other ROI biomarkers, in a larger sample of “real world” subjects, using other antidepressant medications. If this biomarker’s utility is confirmed, algorithm-based treatment approaches could incorporate physiologic guidance so that patients predicted not to remit with a given treatment could to move on to subsequent treatment levels more rapidly than with sequential empirical trials. Additionally, future studies may focus on this ROI to assess its possible role in the neurobiological processes mediating response to treatment for MDD.
Acknowledgments
This work was supported by grant support from the National Institute of Mental Health, Eli Lilly and Company, Wyeth-Ayerst Laboratories, and Aspect Medical Systems, Inc.
Footnotes
Disclosures
In the past 5 years, Dr. Cook has received grant support from Aspect Medical Systems, Cyberonics, Eli Lilly and Company, the John A. Hartford Foundation, MedAvante, the National Institutes of Health, Neuronetics, Novartis, Pfizer, Vivometrics, and the West Coast College of Biological Psychiatry; has served as a consultant to Ascend Media, Bristol-Myers Squibb, Cyberonics, Eli Lilly and Company, Forest Laboratories, Janssen, Neuronetics, Scale Venture Partners, and the U.S. Department of Justice; and has been a member of the speakers’ bureau for Bristol-Myers Squibb, CME LLC, Medical Education Speakers Network, Pfizer, and Wyeth. Dr. Cook is not a shareholder in any pharmaceutical or medical device company; his patents are assigned to the University of California. Dr. Leuchter reports research grant support from Aspect Medical Systems, Eli Lilly and Company, MedAvante, Novartis, Pfizer, and Vivometrics. He has served as a consultant to Aspect Medical Systems, Eli Lilly and Company, MEDACorp, and Novartis; has been a member of the speakers’ bureau for Eli Lilly and Company and Wyeth; and has a minor equity interest in Aspect Medical Systems. His patents are assigned to the University of California. Dr. Hunter, Ms. Abrams, and Ms. Siegman report no competing interests.
Publisher's Disclaimer: This is a PDF file of an unedited manuscript that has been accepted for publication. As a service to our customers we are providing this early version of the manuscript. The manuscript will undergo copyediting, typesetting, and review of the resulting proof before it is published in its final citable form. Please note that during the production process errors may be discovered which could affect the content, and all legal disclaimers that apply to the journal pertain.
References
- Anderer P, Saletu B, Pascual-Marqui RD. Effect of the 5-HT(1A) partial agonist buspirone on regional brain electrical activity in man: a functional neuroimaging study using low-resolution electromagnetic tomography (LORETA) Psychiatry Research. 2000;100:81–96. doi: 10.1016/s0925-4927(00)00066-4. [DOI] [PubMed] [Google Scholar]
- Asada H, Fukuda Y, Tsunoda S, Yamaguchi M, Tonoike M. Frontal midline theta rhythms reflect alternative activation of prefrontal cortex and anterior cingulate cortex in humans. Neuroscience Letters. 1999;274:29–32. doi: 10.1016/s0304-3940(99)00679-5. [DOI] [PubMed] [Google Scholar]
- Bareš M, Brunovsky M, Kopeček M, Stopková P, Novák T, Kozeny J, Hoschl C. Changes in QEEG prefrontal cordance as a predictor of response to antidepressants in patients with treatment resistant depressive disorder: A pilot study. Journal of Psychiatric Research. 2007;41:319–335. doi: 10.1016/j.jpsychires.2006.06.005. [DOI] [PubMed] [Google Scholar]
- Bareš M, Brunovsky M, Kopeček M, Novák T, Stopková P, Kozeny J, Sos P, Krajca V, Höschl C. Early reduction in prefrontal theta QEEG cordance value predicts response to venlafaxine treatment in patients with resistant depressive disorder. European Psychiatry. 2008;23:350–355. doi: 10.1016/j.eurpsy.2008.03.001. [DOI] [PubMed] [Google Scholar]
- Blackhart GC, Minnix JA, Kline JP. Can EEG asymmetry patterns predict future development of anxiety and depression? A preliminary study. Biological Psychology. 2006;72:46–50. doi: 10.1016/j.biopsycho.2005.06.010. [DOI] [PubMed] [Google Scholar]
- Brody AL, Barsom MW, Bota RG, Saxena S. Prefrontal-subcortical and limbic circuit mediation of major depressive disorder. Seminars in Clinical Neuropsychiatry. 2001;6:102–112. doi: 10.1053/scnp.2001.21837. [DOI] [PubMed] [Google Scholar]
- Cook IA, Leuchter AF, Morgan M, Witte E, Stubbeman WF, Abrams M, Rosenberg S, Uijtdehaage SH. Early Changes in Prefrontal Activity Characterize Clinical Responders to Antidepressants. Neuropsychopharmacology. 2002;27:120–131. doi: 10.1016/S0893-133X(02)00294-4. [DOI] [PubMed] [Google Scholar]
- Cook IA, Leuchter AF, Morgan ML, Stubbeman W, Siegman B, Abrams M. Changes in prefrontal activity characterize clinical response in SSRI nonresponders: A pilot study. Journal of Psychiatric Research. 2005;39:461–466. doi: 10.1016/j.jpsychires.2004.12.002. [DOI] [PubMed] [Google Scholar]
- Cook IA, Leuchter AF. Prefrontal changes and treatment response prediction in depression. Seminars in Clinical Neuropsychiatry. 2001;6:113–120. doi: 10.1053/scnp.2001.21844. [DOI] [PubMed] [Google Scholar]
- Cook IA, O’Hara R, Uijtdehaage SHJ, Mandelkern M, Leuchter AF. Assessing the accuracy of topographic EEG mapping for determining local brain function. Electroencephalography and Clinical Neurophysiology. 1998;107:408–414. doi: 10.1016/s0013-4694(98)00092-3. [DOI] [PubMed] [Google Scholar]
- Davidson RJ, Pizzagalli D, Nitschke JB, Putnam K. Depression: Perspectives from affective neuroscience. Annual Review of Psychology. 2002;53:545–574. doi: 10.1146/annurev.psych.53.100901.135148. [DOI] [PubMed] [Google Scholar]
- Davidson R. Parsing affective space: Perspectives from neuropsychology and psychophysiology. Neuropsychology. 1993;7:464–475. [Google Scholar]
- Davidson RJ. Affective neuroscience and psychophysiology: Toward a synthesis. Psychophysiology. 2003;40:655–65. doi: 10.1111/1469-8986.00067. [DOI] [PubMed] [Google Scholar]
- First M, Spitzer R, Gibbon M, Williams J. Structured clinical interview for DSM-IV axis I disorders – patient edition. Biometrics Research Department, New York State Psychiatric Institute; 1994. [Google Scholar]
- Fitzgerald PB, Oxley TJ, Laird AR, Kulkarni J, Egan GF, Daskalakis ZJ. An analysis of functional neuroimaging studies of dorsolateral prefrontal cortical activity in depression. Psychiatry Research. 2006;148:33–45. doi: 10.1016/j.pscychresns.2006.04.006. [DOI] [PubMed] [Google Scholar]
- Frank E, Prien RF, Jarrett RB, Keller MB, Kupfer DJ, Lavori PW, Rush AJ, Weissman MM. Conceptualization and rationale for consensus definitions of terms in major depressive disorder. Remission, recovery, relapse, and recurrence. Archives of General Psychiatry. 1991;48:851–855. doi: 10.1001/archpsyc.1991.01810330075011. [DOI] [PubMed] [Google Scholar]
- Gotlib IH. EEG Alpha Asymmetry, Depression, and Cognitive Functioning. Cognition and Emotion. 1998;12:449–478. [Google Scholar]
- Hjorth B. EEG analysis based on time domain properties. Electroencephalography and Clinical Neurophysiology. 1970;29:306–310. doi: 10.1016/0013-4694(70)90143-4. [DOI] [PubMed] [Google Scholar]
- Hjorth B. An on-line transformation of EEG scalp potentials into orthogonal source derivations. Electroencephalography and Clinical Neurophysiology. 1975;39:526–530. doi: 10.1016/0013-4694(75)90056-5. [DOI] [PubMed] [Google Scholar]
- Hunter AM, Leuchter AF, Morgan ML, Cook IA, Abrams M, Siegman B, DeBrota DJ, Potter WZ. Neurophysiologic correlates of side effects in normal subjects randomized to venlafaxine or placebo. Neuropsychopharmacology. 2005;30:792–799. doi: 10.1038/sj.npp.1300652. [DOI] [PubMed] [Google Scholar]
- Hunter AM, Leuchter AF, Morgan ML, Cook IA. Changes in brain function (quantitative EEG cordance) during placebo lead-in and treatment outcomes in clinical trials for major depression. American Journal of Psychiatry. 2006;163:1426–1432. doi: 10.1176/ajp.2006.163.8.1426. [DOI] [PubMed] [Google Scholar]
- Hunter AM, Ravikumar S, Cook IA, Leuchter AF. Brain functional changes during placebo lead-in and changes in specific symptoms during pharmacotherapy for major depression. Acta Psychiatrrica Scandinavica. 2009;119:266–273. doi: 10.1111/j.1600-0447.2008.01305.x. [DOI] [PubMed] [Google Scholar]
- Ishii R, Shinosaki K, Ukai S, Inouye T, Ishihara T, Yoshimine T, Hirabuki N, Asada H, Kihara T, Robinson SE, Takeda M. Medial prefrontal cortex generates frontal midline theta rhythm. Neuroreport. 1999;10:675–679. doi: 10.1097/00001756-199903170-00003. [DOI] [PubMed] [Google Scholar]
- Judd LL, Akiskal HS, Maser JD, Zeller PJ, Endicott J, Coryell W, Paulus MP, Kunovac JL, Leon AC, Mueller TI, Rice JA, Keller MB. Major depressive disorder: A prospective study of residual subthreshold depressive symptoms as predictor of rapid relapse. Journal of Affective Disorders. 1998;50:97–108. doi: 10.1016/s0165-0327(98)00138-4. [DOI] [PubMed] [Google Scholar]
- Keller MB. Remission versus response: The new gold standard of antidepressant care. Journal of Clinical Psychiatry 65 Suppl. 2004;4:53–59. [PubMed] [Google Scholar]
- Kim SJ, Song SH, Kim JH, Kwak IS. Statistical parametric mapping analysis of the relationship between regional cerebral blood flow and symptom clusters of the depressive mood in patients with pre-dialytic chronic kidney disease. Annals of Nuclear Medicine. 2008;22:201–206. doi: 10.1007/s12149-007-0108-x. [DOI] [PubMed] [Google Scholar]
- Kline JP, Allen S. The failed repressor: EEG asymmetry as a moderator of the relation between defensiveness and depressive symptoms. International Journal of Psychophysiology. 2008;68:228–34. doi: 10.1016/j.ijpsycho.2008.02.002. [DOI] [PubMed] [Google Scholar]
- Knott VJ, Lapierre YD. Computerized EEG correlates of depression and antidepressant treatment. Progress in Neuropsychopharmacology and Biological Psychiatry. 1987;11:213–221. doi: 10.1016/0278-5846(87)90063-7. [DOI] [PubMed] [Google Scholar]
- Knott V, Mahoney C, Kennedy S, Evans K. Pre-treatment EEG and its relationship to depression severity and paroxetine treatment outcome. Pharmacopsychiatry. 2000;33:201–205. doi: 10.1055/s-2000-8356. [DOI] [PubMed] [Google Scholar]
- Knott V, Mahoney C, Kennedy S, Evans K. EEG power, frequency, asymmetry and coherence in male depression. Psychiatry Research. 2001;106:123–140. doi: 10.1016/s0925-4927(00)00080-9. [DOI] [PubMed] [Google Scholar]
- Knott V, Mahoney C, Kennedy S, Evans K. EEG correlates of acute and chronic paroxetine treatment in depression. Journal of Affective Disorders. 2002;69:241–249. doi: 10.1016/s0165-0327(01)00308-1. [DOI] [PubMed] [Google Scholar]
- Knott VJ, Telner JI, Lapierre YD, Browne M, Horn ER. Quantitative EEG in the prediction of antidepressant response to imipramine. Journal of Affective Disorders. 1996;39:175–184. doi: 10.1016/0165-0327(96)00003-1. [DOI] [PubMed] [Google Scholar]
- Kopeček M, Bareš M, Brunovsky M, Stopková P, Novák T, Kozeny J, Höschl C. EEG cordance as a predictor of response to antidepressive medication – pooled analysis. 14th European Congress of Psychiatry, AEP; March 2006; Nice, France. 2006. [Google Scholar]
- Kopeček M, Sos P, Brunovsky M, Bareš M, Stopková P, Krajca V. Can prefrontal theta cordance differentiate between depression recovery and dissimulation? Neuro Endocrinology Letters. 2007;28:524–526. [PubMed] [Google Scholar]
- Kopeček M, Tislerova B, Sos P, Bareš M, Novak T, Krajca V, Brunovsky M. QEEG changes during switch from depression to hypomania/mania: A case report. Neuro Endocrinology Letters. 2008;29:295–302. [PubMed] [Google Scholar]
- Leuchter AF, Cook IA, Witte EA, Morgan M, Abrams M. Changes in brain function of depressed subjects during treatment with placebo. American Journal of Psychiatry. 2002;159:122–129. doi: 10.1176/appi.ajp.159.1.122. [DOI] [PubMed] [Google Scholar]
- Leuchter AF, Cook IA, DeBrota DJ, Hunter AM, Potter WZ, McGrouther CC, Morgan ML, Abrams M, Siegman B. Changes in brain function during administration of venlafaxine or placebo to normal subjects. Clinical EEG and Neuroscience. 2008;39:175–181. doi: 10.1177/155005940803900405. [DOI] [PubMed] [Google Scholar]
- Leuchter AF, Morgan M, Cook IA, Dunkin J, Abrams M, Witte E. Pretreatment neurophysiological and clinical characteristics of placebo responders in treatment trials for major depression. Psychopharmacology (Berlin) 2004;177:15–22. doi: 10.1007/s00213-004-1919-2. [DOI] [PubMed] [Google Scholar]
- Leuchter AF, Uijtdehaage SH, Cook IA, O’Hara R, Mandelkern M. Relationship between brain electrical activity and cortical perfusion in normal subjects. Psychiatry Research Neuroimaging. 1999;90:125–140. doi: 10.1016/s0925-4927(99)00006-2. [DOI] [PubMed] [Google Scholar]
- Mayberg HS, Brannan SK, Tekell JL, Silva JA, Mahurin RK, McGinnis S, Jerabek PA. Regional metabolic effects of fluoxetine in major depression: Serial changes and relationship to clinical response. Biological Psychiatry. 2000;48:830–843. doi: 10.1016/s0006-3223(00)01036-2. [DOI] [PubMed] [Google Scholar]
- Miller IW, Keitner GI, Schatzberg AF, Klein DN, Thase ME, Rush AJ, Markowitz JC, Schlager DS, Kornstein SG, Davis SM, Harrison WM, Keller MB. The treatment of chronic depression, part 3: Psychosocial functioning before and after treatment with sertraline or imipramine. Journal of Clinical Psychiatry. 1998;59:608–619. doi: 10.4088/jcp.v59n1108. [DOI] [PubMed] [Google Scholar]
- Milligan GW, Cooper MC. Methodological review: Clustering methods. Applied Psychological Measurement. 1987;11:329–354. [Google Scholar]
- Mirkin B. Mathematical Classification and Clustering. Kluwer Academic Publishers; Dordrecht: 1996. [Google Scholar]
- Mojena R. Hierarchical grouping methods and stopping rules: An evaluation. Computer Journal. 1977;20:359–363. [Google Scholar]
- Mojtabai R. Residual symptoms and impairment in major depression in the community. American Journal of Psychiatry. 2001;158:1645–1651. doi: 10.1176/appi.ajp.158.10.1645. [DOI] [PubMed] [Google Scholar]
- Morgan ML, Cook IA, Rapkin AJ, Leuchter AF. Neurophysiologic changes during estrogen augmentation in perimenopausal depression. Maturitas. 2007;56:54–60. doi: 10.1016/j.maturitas.2006.05.010. [DOI] [PubMed] [Google Scholar]
- Nierenberg AA, Wright EC. Evolution of remission as the new standard in the treatment of depression. Journal of Clinical Psychiatry. 1999;60(Suppl 22):7–11. [PubMed] [Google Scholar]
- Ormel J, Oldehinkel AJ, Nolen WA, Vollebergh W. Psychosocial disability before, during, and after a major depressive episode: A 3-wave population-based study of state, scar, and trait effects. Archives of General Psychiatry. 2004;61:387–392. doi: 10.1001/archpsyc.61.4.387. [DOI] [PubMed] [Google Scholar]
- Papakostas GI, Petersen T, Denninger JW, Tossani E, Pava JA, Alpert JE, Nierenberg AA, Fava M. Psychosocial functioning during the treatment of major depressive disorder with fluoxetine. Journal of Clinical Psychopharmacology. 2004;24:507–511. doi: 10.1097/01.jcp.0000138761.85363.d5. [DOI] [PubMed] [Google Scholar]
- Paykel ES, Ramana R, Cooper Z, Hayhurst H, Kerr J, Barocka A. Residual symptoms after partial remission: An important outcome in depression. Psychological Medicine. 1995;25:1171–1180. doi: 10.1017/s0033291700033146. [DOI] [PubMed] [Google Scholar]
- Phillips ML, Drevets WC, Rauch SL, Lane R. Neurobiology of emotion perception II: Implications for major psychiatric disorders. Biological Psychiatry. 2003;54:515–528. doi: 10.1016/s0006-3223(03)00171-9. [DOI] [PubMed] [Google Scholar]
- Pizzagalli D, Pascual-Marqui RD, Nitschke JB, Oakes TR, Larson CL, Abercrombie HC, Schaefer SM, Koger JV, Benca RM, Davidson RJ. Anterior cingulate activity as a predictor of degree of treatment response in major depression: Evidence from brain electrical tomography analysis. American Journal of Psychiatry. 2001;158:405–415. doi: 10.1176/appi.ajp.158.3.405. [DOI] [PubMed] [Google Scholar]
- Rogers MA, Kasai K, Koji M, Fukuda R, Iwanami A, Nakagome K, Fukuda M, Kato N. Executive and prefrontal dysfunction in unipolar depression: A review of neuropsychological and imaging evidence. Neuroscience Research. 2004;50:1–11. doi: 10.1016/j.neures.2004.05.003. [DOI] [PubMed] [Google Scholar]
- Rush AJ, Rago WV, Crismon ML, Toprac MG, Shon SP, Suppes T, Miller AL, Trivedi MH, Swann AC, Biggs MM, Shores-Wilson K, Kashner TM, Pigott T, Chiles JA, Gilbert DA, Altshuler KZ. Medication treatment for the severely and persistently mentally ill: the Texas Medication Algorithm Project. Journal of Clinical Psychiatry. 1999;60:284–291. doi: 10.4088/jcp.v60n0503. [DOI] [PubMed] [Google Scholar]
- Rush AJ, Trivedi MH, Ibrahim HM, Carmody TJ, Arnow B, Klein DN, Markowitz JC, Ninan PT, Kornstein S, Manber R, Thase ME, Kocsis JH, Keller MB. The 16-item Quick Inventory of Depressive Symptomatology (QIDS) Clinician Rating (QIDS-C) and Self-Report (QIDS-SR): A psychometric evaluation in patients with chronic major depression. Biological Psychiatry. 2003;54:573–583. doi: 10.1016/s0006-3223(02)01866-8. [DOI] [PubMed] [Google Scholar]
- Rush AJ, Trivedi MH, Wisniewski SR, Stewart JW, Nierenberg AA, Thase ME, Ritz L, Biggs MM, Warden D, Luther JF, Shores-Wilson K, Niederehe G, Fava M STAR*D Study Team. Bupropion-SR, sertraline, or venlafaxine-XR after failure of SSRIs for depression. New England Journal of Medicine. 2006;354:1231–1242. doi: 10.1056/NEJMoa052963. [DOI] [PubMed] [Google Scholar]
- Schmidt LA. Frontal brain electrical activity in shyness and sociability. Psychological Science. 1999;10:316–320. [Google Scholar]
- Stubbeman WF, Leuchter AF, Cook IA, Shurman BD, Morgan M, Gunay I, Gonzalez S. Pretreatment neurophysiologic function and ECT response in depression. Journal of ECT. 2004;20:142–144. doi: 10.1097/00124509-200409000-00004. [DOI] [PubMed] [Google Scholar]
- Trivedi MH, Fava M, Wisniewski SR, Thase ME, Quitkin F, Warden D, Ritz L, Nierenberg AA, Lebowitz BD, Biggs MM, Luther JF, Shores-Wilson K, Rush AJ STAR*D Study Team. Medication augmentation after the failure of SSRIs for depression. New England Journal of Medicine. 2006b;354:1243–1252. doi: 10.1056/NEJMoa052964. [DOI] [PubMed] [Google Scholar]
- Trivedi MH, Kern JK, Baker SM, Altshuler KZ. Computerizing medication algorithms and decision support systems for major psychiatric disorders. Journal of Psychiatric Practice. 2000;6:237–246. doi: 10.1097/00131746-200009000-00004. [DOI] [PubMed] [Google Scholar]
- Trivedi MH, Rush AJ, Wisniewski SR, Nierenberg AA, Warden D, Ritz L, Norquist G, Howland RH, Lebowitz B, McGrath PJ, Shores-Wilson K, Biggs MM, Balasubramani GK, Fava M STAR*D Study Team. Evaluation of outcomes with citalopram for depression using measurement-based care in STAR*D: Implications for clinical practice. American Journal of Psychiatry. 2006a;163:28–40. doi: 10.1176/appi.ajp.163.1.28. [DOI] [PubMed] [Google Scholar]
- Ulrich G, Haug HJ, Fahndrich E. Acute versus chronic EEG effects of maprotiline- and in clomipramine-treated depressive inpatients and the prediction of therapeutic outcome. Journal of Affective Disorders. 1994;32:213–217. doi: 10.1016/0165-0327(94)90020-5. [DOI] [PubMed] [Google Scholar]
- Ulrich G, Haug H, Stieglitz R, Fahndrich E. Are there distinct biochemical subtypes of depression? EEG characteristics of clinically defined on-drug responders and non-responders. Journal of Affective Disorders. 1988a;15:181–185. doi: 10.1016/0165-0327(88)90088-2. [DOI] [PubMed] [Google Scholar]
- Ulrich G, Haug HJ, Stieglitz RD, Fahndrich E. EEG characteristics of clinically defined on-drug-responders and non-responders--a comparison clomipramine vs. maprotiline. Pharmacopsychiatry. 1988b;21:367–368. doi: 10.1055/s-2007-1017011. [DOI] [PubMed] [Google Scholar]
- Vos T, Haby MM, Barendregt JJ, Kruijshaar M, Corry J, Andrews G. The burden of major depression avoidable by longer-term treatment strategies. Archives of General Psychiatry. 2004;61:1097–1103. doi: 10.1001/archpsyc.61.11.1097. [DOI] [PubMed] [Google Scholar]
- Warwick JM, Carey P, Jordaan GP, Dupont P, Stein DJ. Resting brain perfusion in social anxiety disorder: A voxel-wise whole brain comparison with healthy control subjects. Progress in Neuropsychopharmacology and Biological Psychiatry. 2008;32:1251–1256. doi: 10.1016/j.pnpbp.2008.03.017. [DOI] [PubMed] [Google Scholar]
- Zimmerman M, Posternak MA, Chelminski I. Heterogeneity among depressed outpatients considered to be in remission. Comprehensive Psychiatry. 2007;48:113–117. doi: 10.1016/j.comppsych.2006.10.005. [DOI] [PubMed] [Google Scholar]