

Abstract
The catabolic pathway for branched-chain amino acids includes deamination followed by oxidative decarboxylation of the deaminated product branched-chain α-keto acids, catalyzed by the mitochondrial branched-chain aminotransferase (BCATm) and branched-chain α-keto acid dehydrogenase enzyme complex (BCKDC). We found that BCATm binds to the E1 decarboxylase of BCKDC, forming a metabolon that allows channeling of branched-chain α-keto acids from BCATm to E1. The protein complex also contains glutamate dehydrogenase (GDH1), 4-nitrophenylphosphatase domain and non-neuronal SNAP25-like protein homolog 1, pyruvate carboxylase, and BCKDC kinase. GDH1 binds to the pyridoxamine 5′-phosphate (PMP) form of BCATm (PMP-BCATm) but not to the pyridoxal 5′-phosphate-BCATm and other metabolon proteins. Leucine activates GDH1, and oxidative deamination of glutamate is increased further by addition of PMP-BCATm. Isoleucine and valine are not allosteric activators of GDH1, but in the presence of 5′-phosphate-BCATm, they convert BCATm to PMP-BCATm, stimulating GDH1 activity. Sensitivity to ADP activation of GDH1 was unaffected by PMP-BCATm; however, addition of a 3 or higher molar ratio of PMP-BCATm to GDH1 protected GDH1 from GTP inhibition by 50%. Kinetic results suggest that GDH1 facilitates regeneration of the form of BCATm that binds to E1 decarboxylase of the BCKDC, promotes metabolon formation, branched-chain amino acid oxidation, and cycling of nitrogen through glutamate.
Introduction
It has been proposed that the enzymes that are responsible for catalyzing sequential reactions in several metabolic pathways are highly organized in supramolecular complexes termed metabolons (1). The concept of metabolic enzymes associating to form a supramolecular complex was hypothesized 50 years ago (2). Recently, Benkovic and co-workers (3) have shown the in vivo assembly of six proteins in the purine catabolic pathway to form a “purinosome.” The formation of the purinosome appears to be dynamically regulated by stimulation of de novo purine biosynthesis in response to changes in purine levels. Another group (4) also has shown that glycolytic enzymes (“glycosome”) are organized into complexes, and this assembly is regulated by the oxidation and phosphorylation states of the proteins. The advantages of such a supramolecular assembly include efficient channeling of substrates between enzymes in a pathway, regulating pathway flux by association and dissociation, and by targeting the assembly of the interacting proteins to the appropriate intracellular structures. Previously, using liver mitochondrial extracts and purified BCATm,2 we showed that the first two enzymes in BCAA catabolism, mitochondrial branched-chain aminotransferase (BCATm) and branched-chain α-keto acid decarboxylase (E1) of the BCKDC, associate in vitro (5). It is not yet known if this BCAA metabolon forms in tissues expressing BCATm, and if other associated proteins are functionally involved in the metabolon.
BCATs (mitochondrial and cytosolic isozymes) catalyze reversible transamination of BCAAs (leucine, isoleucine, and valine) to form the branched-chain α-keto acids (BCKAs) (6). Transamination results in transfer of the α-amino group from BCAA to α-ketoglutarate (α-KG) to form glutamate (Glu) as shown in Reactions 1 and 2.
 |
 |
Here, BCAT·PLP and BCAT·PMP denote the pyridoxal 5′-phosphate (PLP) and pyridoxamine 5′-phosphate (PMP) forms of BCAT, respectively. R1 is the side chain of BCAAs or BCKAs, and R2 is the side chain of α-KG. The α-amino group temporarily resides on the coenzyme PLP forming PMP (6–9). BCKA transamination products are α-ketoisocaproate (KIC), α-keto-β-methylvalerate, and α-ketoisovalerate. In the second half-reaction, the PMP cofactor donates its nitrogen to α-KG to form Glu (10). Once BCAA nitrogen enters the large glutamate pool, it is available for synthesis of alanine and glutamine. The forward nitrogen transfer is favored by oxidation of the BCKA products by BCKDC. Net nitrogen transfer from BCAAs to glutamate occurs when the carbon skeleton of the BCAA is irreversibly lost via the BCKDC step (oxidation) (11).
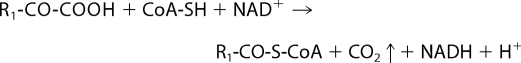
The second enzyme in BCAA metabolism is BCKDC, which is a member of a family of highly conserved macromolecular enzyme complexes. The other two protein complexes in this family are pyruvate dehydrogenase and α-ketoglutarate dehydrogenase (12–14). The catalytic reaction of all these three protein complexes is similar and leads to the oxidative decarboxylation of α-ketoacids (BCKAs, pyruvate, and α-KG) giving rise to branched-chain acyl-CoAs, acetyl-CoA, or succinyl-CoA, respectively (Reaction 3).
 |
We have shown that the deaminated BCKA product of BCATm is directly transferred to the E1 decarboxylase of BCKDC through complex formation between the two enzymes and substrate channeling (15). The association between BCATm and E1 is specific for the PLP form of the BCATm isozyme, requires a reduced CXXC center, is inhibited by phosphorylation of E1, and is dissociated by the BCKDC reaction product NADH (5). The E1 enzyme catalyzes the ThDP-mediated decarboxylation of BCKAs (12). The product of the reaction, carbanion-ThDP, undergoes the E1-catalyzed reductive transfer of carbanion to the lipoyl moiety, which is covalently bound to dihydrolipoyl transacylase (E2) (16). The dihydrolipoyl residue is reoxidized by the FAD moiety of dihydrolipoamide dehydrogenase (E3), and NAD+ is the ultimate electron acceptor. This reaction is the committed step in BCAA oxidation.
In this study, we have identified other proteins found in the complex in tissues expressing BCATm and have explored potential functions of GDH1 on BCAA metabolism. Leucine has been reported to allosterically activate GDH1, which is important for the stimulation of insulin secretion by this amino acid (17–19). We demonstrate that GDH1 is the protein partner for PMP-BCATm. Facilitating the recycling of BCATm to form metabolon, GDH1 acts as a catalytic machine.
EXPERIMENTAL PROCEDURES
Chemicals
Plasmid pCR 2.1 TA cloning vector and pcDNA3. 1/Zeo(+) were purchased from Invitrogen, and pET28-a(+) plasmid was purchased from Novagen (Madison, WI). Bacterial strains were purchased from Novagen (Escherichia coli BL21(DE3)pLys-competent cells). The anti-His monoclonal antibody and anti-FLAG M2 monoclonal antibodies were purchased from Sigma. The anti-rat BCATm antibody has been described previously (20), and the antisera raised against components of the BCKDC complex were the kind gift of Dr. Yoshi Shimomura (Nagoya, Japan). Restriction endonucleases and other DNA modification enzymes were purchased from Promega. DNA sequencing was done at the DNA sequencing laboratory of the Comprehensive Cancer Center at Wake Forest University School of Medicine. The medium used for bacterial growth contained 0.5% yeast extract, 1% polypeptone, and 0.5% NaCl and was from Fisher. Nickel-nitrilotriacetic acid resin was purchased from Qiagen (Chatsworth, CA). Sequencing grade-modified trypsin was purchased from Promega (Madison, WI). Bovine GDH1 is available commercially and was purchased from Sigma. All other chemicals were of the highest grade commercially available.
Animals
Male Sprague-Dawley rats (200–300 g) were housed three to four per cage and maintained with standard chow food diets and water in a temperature and light controlled environment. The animals were sacrificed under a mixture of ketamine/xylazine anesthesia, and the tissues were collected in MSE buffer (225 mm d-mannitol, 75 mm sucrose, 1 mm EDTA, pH 7.0).
Preparation of Mitochondria and Mitoplasts
The mitochondria from different rat tissues were prepared according to methods described previously (5, 21). Mitochondria from rat pancreas were prepared as described in MacDonald et al. (22). To prepare mitoplasts from liver mitochondria, the mitochondrial pellets were diluted to 100 mg/ml with H medium (75 mm sucrose, 225 mm d-mannitol, 50 mm HEPES, and 1 mm bovine serum albumin) (23). An equal volume of extraction mixture (12 mg/ml digitonin and 0.5 mg/ml bovine serum albumin) was added and diluted by a 3-fold volume of H medium and centrifuged at 12,500 rpm for 10 min. The pellets were then resuspended in H medium, and centrifugation was then repeated. The pellets were then resuspended in a minimal volume of H medium. The respiratory control ratio was determined separately in the presence of magnesium by measuring the ratio of the respiratory rate in the presence of ADP (0.5 mm) to the rate measured after cessation of ADP phosphorylation with 20 mm glutamate and 1 mm malate as substrates (24). No mitochondrial preparation with a ratio less than 6 was used. Protein was determined using the Biuret assay. The mitochondria and mitoplasts (100 mg) were allocated into separate tubes and centrifuged, and the pellets were either used immediately or stored at −80 °C. Pellets could be stored frozen for up to 4 weeks. Mitochondrial proteins were extracted using solubilizing buffer (SB buffer: 50 mm potassium phosphate, 0.2 mm EDTA, 0.75% CHAPS, 25 mm KCl, 1 mm DTT, pH 7.4, and protease inhibitor mixture set III (Calbiochem)) as described previously (5).
Purification of Recombinant BCAT Proteins
The overexpression and purification of the wild type and mutant BCAT proteins were performed according to the method of Conway et al. (25, 26). Mutant (C315A, C318A, and C315A/C318A) and oxidized BCATm were prepared according to the method of Yennawar et al. (27). The recombinant human E1, E2, and E3 proteins were expressed as described previously (28, 29).
Preparation of Protein and Antibody Affinity Columns
To prepare the protein columns, recombinant BCAT (1 mg/ml in 2 ml) was dialyzed against bicarbonate buffer (0.2 m NaHCO3 and 0.5 m NaCl, pH 8.0) overnight. Two g of activated CH-Sepharose® 4B (Sigma) were suspended in 200 ml of cold 1 mm HCl for 10–15 min. The rest of the protocol for this ligand-resin coupling was performed according to the manufacturer's instructions. The columns were stored at 4 °C in phosphate-buffered saline with 0.02% sodium azide, and 5 mm DTT was added to the BCATm column. To prepare antibody columns, affinity-purified human BCATm antibody was coupled to recombinant protein A beads and cross-linked with disuccinimidyl suberate (Pierce) following the protocol provided by the manufacturer.
Isolation of BCATm-bound Proteins
Isolation of BCATm-bound proteins from the protein columns was performed as described previously with some modification (5). The BCAT affinity columns were equilibrated with the SB buffer (containing 1 mm DTT for BCATm), and the filtered mitochondrial extract was passed through the column. The column was then washed with SB buffer with addition of 100 mm KCl. Bound proteins were eluted with 10 or 5 mm NADH in SB buffer without DTT. The eluted proteins were precipitated using acetone at −20 °C overnight, and the protein pellet was washed with 10% trichloroacetic acid followed by ether/ethanol (1:1 v/v). The protein pellets were dried under nitrogen, resuspended in SDS loading buffer, and analyzed by SDS-PAGE. For the antibody columns, the mitochondrial extract in SB buffer was applied to the column. The bound proteins were eluted using the RC buffer (4 m urea, 0.5 m NaCl in 0.1 m sodium acetate, pH 4.0). The rest of the steps were exactly as described above.
Cell Lines and Dithiobis(succinimidyl Propionate) (DSP) Cross-linking
CHO cell lines were grown in Dulbecco's modified Eagle's medium supplemented with 10% fetal calf serum. When the cells reached confluency (80–90%), they were transfected with pcDNA3.1/Zeo(+) containing BCATm cDNA, and expression of the protein was evaluated using an established assay (26). To cross-link protein complexes, the cells were washed with phosphate-buffered saline and then incubated with the thiol-cleavable cross-linker DSP at 1 mm concentration in dimethyl sulfoxide (DMSO) and with occasional shaking for 30 min at room temperature. The reaction was quenched for 15 min with 10 mm Tris, pH 8.6. After washing with phosphate-buffered saline, the cells were lysed in HEPES buffer (50 mm HEPES, pH 8.0) containing 0.2 mm NaCl, 1 mm EDTA, 1% Triton X-100, and protease inhibitor mixture. The lysate was passed through a BCATm antibody column, and the bound proteins were eluted RC buffer containing a high concentration of urea. The eluted proteins were identified using nonreducing SDS-PAGE and Western blotting (20 μg of proteins were loaded in −BCATm and +BCATm lanes, and 4 μg of proteins were loaded in complex lanes) and MALDI-mass spectrometry.
Protein Identification by Tandem Mass Spectrometry and N-terminal Edman Degradation
To identify the proteins in the affinity chromatographic eluate, the IP pellet was resuspended in 50 μl of the reaction mixture (6 m guanidine HCl, 50 mm Tris-HCl, pH 8.0, and 4 mm DTT), which was followed by a standard in-solution trypsin digestion protocol following the manufacturer's instructions. Proteins were alkylated with iodoacetamide, and enzymatic digestion was performed using sequencing grade trypsin gold (Promega, Madison, WI). The extent of digestion was determined by SDS-PAGE, and then 20 μl of the digested sample was purified on a C18 peptide trap (Michrom Bioresources, Auburn, CA) and concentrated in a SpeedVac apparatus followed by resuspension in 20 μl of 0.1% MS grade formic acid. One-half of the sample (10 μl) was diluted 1:20, and ∼4 μl (∼200 ng of peptide mixture) was injected onto a Thermo Surveyor high pressure liquid chromatography tied to a Thermo LTQ ion trap mass spectrometer with a nano-electrospray source (Thermo Electron, San Jose, CA). The liquid chromatography conditions and search parameters were run using conditions published previously (30). Data were searched against the NCBInr mammalian data base using SEQUEST with common filtering cutoff values, i.e. cross-correlation (Xcorr) values >1.8 for doubly charged ions and >2.5 for triply charged ions. In addition, ranking of preliminary score values of <5 and preliminary score values of >350 also were required for positive peptide identifications. A number of significant hits were observed for each protein with Xcorr above 5 as reported under “Results.”
Spectrophotometric Kinetic Analysis
GDH1 enzymatic assays were performed using a Beckman Coulter DU-800 spectrophotometer at 30 °C equipped with a Beckman Coulter temperature controller, and the reaction was monitored using the coenzyme absorbance changes at 340 nm. The reactions were performed in 1 ml of 0.1 m sodium phosphate buffer, pH 8.0, for oxidative deamination in the presence of 50 mm glutamate and 0.2 mm NAD+ and at pH 7.0 for reductive amination in the presence of 0.1 mm NADH, 50 mm NH4Cl, and 5 mm α-ketoglutarate (31).
Kinetics of the E1 decarboxylase reaction in presence of GDH1 and BCATm were determined in the presence of an artificial electron acceptor 2,6-dichlorophenolindophenol (DCPIP) as in Ref. 5. The assay mixture contained 100 mm potassium phosphate, pH 7.5, 2.0 mm MgCl2, 0.2 mm ThDP, and 0.1 mm DCPIP. E1 was reconstituted with BCATm at a 1:1 molar ratio, and GDH1 was added at varied molar ratios to BCATm. The rate of decarboxylation at 30 °C was measured by monitoring the reduction of the dye at 600 nm (15, 33).
For the overall assay of the BCAA metabolon complex (Reaction 3) in the presence of GDH1, the enzymes were exchanged into phosphate buffer (30 mm potassium phosphate, pH 7.5) containing 5 mm DTT using a PD-10 column, and the enzyme concentrations were calculated from the absorption maxima at 280 nm (27). The protein complex was reconstituted with BCATm, E1, and lipoylated E2 and E3 at a molar ratio of 12:12:1:55, in which lipoylated E2 exist as a 24-mer. NIPSNAP1 and GDH1 were added in different molar ratios to BCATm. The assay mixture contained 30 mm potassium phosphate, pH 7.5, 100 mm NaCl, 3 mm NAD+, 0.4 mm CoA, 2 mm MgCl2, 2 mm DTT, 0.1% Triton X-100, and 2 mm ThDP. The overall reaction was monitored by formation of NADH at 340 nm. Replacement of NaCl salt with the more physiological relevant KCl salt did not show any difference in the kinetic rate constants for BCKDC. However, KCl inhibited the activity of GDH1 (34). Therefore, we always used NaCl in the overall reaction mixture.
The apparent rate constants (kapp) at different substrate concentrations for all of the above assays were determined from the absorption changes at the individual wavelength maximum. The kapp rate constants were fit using the following Equation 1,
The kcat and Km values were obtained from the fitted curves and are shown in Tables 3–5.
GTP inhibition curves in the absence or presence of PMP-BCATm were analyzed using the following mathematical Equation 2,
where [GTP] is the concentration of GTP; Ki is the inhibition constants of GTP, and M1 is the factor associated with maximum extent of GTP inhibition. All calculations and analyses were performed using IGOR Pro software (WaveMetrics Inc.).
E1 Phosphorylation Assay
The phosphorylation of E1 was carried out in the phosphorylation reaction mixture (30 mm HEPES, pH 7.4, 2 mm DTT, 1.5 mm MgCl2, and 0.2 mm EGTA). BCATm, E1, E2, and E3 proteins were mixed at 12:12:1:55 molar ratio in 0.1 ml of reaction mixture, and 0.1 μg of maltose-binding protein-tagged rat BCKDC kinase (BDK) was added. The mixture was preincubated at room temperature for 15 min. The phosphorylation reaction was started after addition of 0.4 mm ATP to the reaction mixture, and the reaction was terminated at different time points by addition of higher salt concentration (15). Overall BCKDC activity was measured as described above.
CD Spectroscopic Analysis
Allosteric changes of GDH1 were analyzed by CD spectroscopic measurements using a Jasco J-720 spectropolarimeter equipped with a variable temperature accessory. The spectra (350 to 190 nm) were acquired using a protein concentration of 20 μm in 10 mm potassium phosphate buffer, pH 7.0, and a 0.01-cm path length. CD spectra of BCATm were used as the blank to obtain the GDH1 spectra. Values were measured as Δϵ = ΔA·c·l (where c is molar concentration and l is path length in centimeters). Differences in CD spectra were calculated by ΔA′ = ΔAsolution − ΔAreference and were obtained by numerical subtraction. Allosteric changes in GDH1 were detected at 260 nm, and the binding constant was determined from the curve fitting of ΔA′260 versus [BCATm]. The final spectra were the average of three different accumulations.
RESULTS
Tissue Distribution of BCAA Metabolon Protein Partners
Using rat liver mitochondrial extracts, we have shown previously the potential for a BCAA supramolecular complex consisting of BCATm and BCKDC proteins (5). As shown in Fig. 1, other proteins were also found in the liver mitochondrial complex. These non-BCKDC liver mitochondrial proteins, which bound to the BCATm affinity column, were GDH1, pyruvate carboxylase (PC), BDK, and NIPSNAP1 (Fig. 1). To determine the potential metabolon composition in tissues that express BCATm, BCATm-specific antibodies were used to isolate associating proteins from mitochondria prepared from the pancreas, kidney, heart, skeletal muscle, and brown adipose tissue. The proteins found in these tissues are shown in Table 1. There were tissue-specific differences in metabolon composition that were consistent with differences in expression of the individual proteins in these tissues. For example, PC is a binding partner in all tissues except heart. It is the prominent band in the liver complex (Fig. 1). Proteomic studies of tissue mitochondria also show that PC is abundant in other tissues like brown adipose tissue and kidney, whereas there are low levels expressed in skeletal muscle, and it is absent in heart (35). BCKDC proteins were found in the metabolon in all tissues except skeletal muscle. All five subunits of BCKDC are found in skeletal muscle; however, the high phosphorylation state of E1 may prevent metabolon formation (see below). We used chow-fed animals where liver E1 is highly dephosphorylated and the skeletal muscle E1 is highly phosphorylated (36, 37). NIPSNAP1 was found only in heart and kidney tissues. BDK was associated with metabolon proteins in pancreas and kidney mitochondria and was not observed in brown adipose tissue mitochondria. Association of BDK with the metabolon was variable. When BDK was present, GDH1 was not found in the associated proteins. Published mitochondrial protein array data show that the tissue-specific expression of GDH1 protein is consistent with its presence in the BCAA metabolon in the tissues shown in Table 1 (38).
FIGURE 1.

Human BCATm-associated proteins in rat liver mitochondria. Rat liver mitochondria were extracted in SB Buffer. The extract was applied to a BCATm-Sepharose affinity column, and the column was washed with SB Buffer until no more UV-absorbing material was eluted, followed by washing with SB Buffer plus 100 mm KCl. The BCATm bound proteins were eluted with SB Buffer containing 10 mm NADH and identified by tandem mass spectrometry as described under “Experimental Procedures.” Lower band immediately under PC is a degraded fragment of PC.
TABLE 1.
Identification of metabolon proteins in extrahepatic tissues
SEQUEST was used for liquid chromatography/tandem mass spectrometry analysis, and MASCOT was used for matrix-assisted laser desorption ionization time-of-flight/time-of-flight analysis, although in most cases both were used. Data were searched against the NCBInr mammalian data base using SEQUEST using common filtering cutoff values, i.e. cross-correlation (Xcorr) values >1.8 for doubly charged ions and >2.5 for triply charged ions. In addition, ranking of preliminary score values of <5 and preliminary score values of >350 also were required for positive peptide identifications. Replicate experiments were carried out with similar results. +, present; +/−, lower content; −, absent; NC, not confirmed.
| MASCOT ID | Mitochondrial source |
||||
|---|---|---|---|---|---|
| Pancreas | Skeletal muscle | Brown adipose tissue | Heart | Kidney | |
| PC | + | +/− | + | − | + |
| E3 | + | − | + | + | + |
| GDH1 | + | + | NC | + | + |
| E2 | + | − | + | + | + |
| BCKD-E1α | + | − | + | + | + |
| BCKD-E1β | + | − | + | + | + |
| NIPSNAP1 | − | − | − | + | + |
| BDK | + | − | NC | − | + |
Previously (5), we demonstrated channeling of the BCATm transamination product to the E1 component of BCKDC that enhanced E1-catalyzed decarboxylation of the BCKAs and overall BCKDC activity. Addition of α-KG stimulated activity further by regenerating the PLP form of BCATm that binds to E1, i.e. cycling versus single turnover reaction. If GDH1 is a metabolon protein, it could potentially supply α-KG for BCATm through oxidative deamination of glutamate. In this study, we focused on potential functions of GDH1 in the BCAA metabolon and identified its binding partner.
Identification of the Protein Complex Using Chemical Cross-linking and Affinity Chromatography
To identify the BCAA metabolon proteins in in situ, we used CHO cell lines. The freshly prepared cell lines (Fig. 2A, −BCATm) were transfected with pcDNA vector containing the BCATm gene DNA (Fig. 2A, +BCATm), and the BCATm overexpressed cell lines were harvested in the presence of the cell-permeable chemical cross-linker DSP. BCATm-bound proteins were captured using a BCATm antibody column and eluted from the column with RC buffer (Fig. 2A, complex), and the complex proteins were identified using MALDI-mass spectrometry. Analysis of the proteins in the nonreducing SDS-PAGE demonstrates that all BCAA metabolon proteins (BCATm, BCKDC, GDH1, PC, and NIPSNAP1) were present in this DSP-cross-linked complex. Western blotting of the gel with anti-BCATm antibody demonstrated that there was some endogenous BCAT in CHO cell lines (Fig. 2A, light band, −BCATm), and CHO cell lines showed overexpressed the BCATm after transfection with BCATm cDNA (Fig. 2A, +BCATm). The thick band at 200 kDa (Fig. 2A, complex) indicated that BCATm is associated with other proteins in a supramolecular complex.
FIGURE 2.

DSP cross-linking of the complex proteins (A) and identification of binding partner of GDH1 (B). A, CHO cell lines were transfected with pcDNA3.1/Zeo(+) containing BCATm gene DNA and incubated with DSP. The BCATm-associated proteins were isolated using a BCATm antibody column, and the complex proteins were identified by mass spectrometry or Western blotting using anti-BCATm antibody. Lanes are as follows: −BCATm, cell extract from untransfected cell lines; +BCATm, cell extract of BCATm transfected cell lines; complex, BCATm-associated proteins eluted using the BCATm antibody column. All experiments were performed under nonreducing conditions. B, GDH1 was coupled to Profound co-immunoprecipitation beads and incubated with PLP-BCATm, PMP-BCATm, E1, E2, pyruvate dehydrogenase-E2, E3, PC, or NIPSNAP1. Flow-through (F) and bound proteins eluted with NADH (E) were analyzed by SDS-PAGE. PMP-BCATm was bound to GDH1. Although a small amount of PLP-BCATm appeared to bind with GDH1, it could represent PMP-BCATm contamination of the purified PLP-BCATm preparation.
To identify the binding partner(s) of GDH1, PMP-BCATm, PLP-BCATm, E1, E2, E3, and PC were used as bait proteins. Affinity chromatography was performed using NADH containing SB buffer to elute bound proteins. As shown in Fig. 2B, only the PMP form of BCATm clearly bound to GDH1.
PMP-BCATm Induces Allosteric Changes in GDH1
Mammalian GDH1 is a homohexamer. Each subunit is characterized by an N-terminal glutamate-binding domain, NAD-binding domain, and a special antenna domain. The residues in the antenna region are characteristic for mammalian GDH1 and are involved in allosteric regulation of this enzyme (39, 40). GDH1 forms abortive complexes with NAD(P)H·Glu and NAD(P)·αKG. Mammalian GDH1 exhibits complex allosteric regulation by a large number of allosteric effectors. The main allosteric activators are leucine and ADP, which act by destabilizing the abortive complex of GDH1. GTP is a potent inhibitor that acts through stabilization of the abortive complexes (41–44). Changes in the allosteric conformation of GDH1 can be analyzed using CD spectroscopy (45, 46). To determine whether addition of BCATm affects the conformation of GDH1, GDH1 (20 μm) was incubated with increasing concentrations of BCATm (10–200 μm), and CD spectra were recorded (see Fig. 3A). The intense CD spectral change associated with addition of PMP-BCATm is clearly visible at 260 nm. Neither PLP-BCATm (data not shown), the CXXC mutant (Fig. 3C) or oxidized BCATm (Fig. 3D), nor cytosolic BCATc (data not shown) affected the CD spectra. Plotting ΔA260 versus [PMP-BCATm] suggested a 1:3 complex with a calculated Kd of 2 μm (Fig. 3B), which is similar to the calculated Kd value for the BCATm-E1 interaction (5).
FIGURE 3.

PMP-BCATm induces allosteric changes in GDH1. A, CD changes at 260 nm show a conformational change in GDH1 on addition of increasing concentrations of PMP-BCATm. B, GDH1 and BCATm interact at a molar ratio of 1:3 which corresponds to a 1:1 active site ratio of the GDH1 hexamer and BCATm dimers. Titration of GDH1 in the presence of C315A/C318A BCATm (C) or oxidized BCATm (D) showed no significant allosteric changes in GDH1, indicating there is no interaction between GDH1 and the mutant or oxidized BCATm.
PMP-BCATm Accelerates the Oxidative Deamination Reaction of GDH1
GDH1 catalyzes the oxidative deamination of l-glutamate using NAD+ or NADP+ as coenzyme. It can also catalyze reductive amination of α-KG. However, in vivo reductive amination is not the favored direction, because the Km value for ammonium (50 mm) is considerably higher than physiological concentrations of ammonia (34). To evaluate the kinetic properties of GDH1 in the presence of BCATm, we have determined the kapp of GDH1-catalyzed glutamate deamination. Leucine alone enhanced the rate of GDH1-catalyzed deamination of GDH1 ∼60–65% (Fig. 4A). On addition of PLP-BCATm, the rate of oxidation of GDH1 was enhanced an additional ∼30–35% in the presence of leucine. Isoleucine or valine did not have any effect on GDH1 catalysis when added alone. However, addition of PLP-BCATm to the reaction mixture accelerated GDH1-catalyzed deamination by 75–80% and 70–75% (Fig. 4, B and C). These results suggest that addition of PLP-BCATm plus a BCAA destabilizes the abortive complex of GDH1 by converting PLP-BCATm to the PMP form, releasing the BCKA product α-ketoacid. The PMP-BCATm then binds GDH1 facilitating catalysis. The association of PMP-BCATm with GDH1 results in an allosteric conformational change that enhances the rate of oxidative deamination of glutamate and suggests substrate channeling of the α-KG product to PMP-BCATm, reforming glutamate and PLP-BCATm. We have performed similar experiments using CXXC center oxidized and mutated BCATm and cytosolic BCATc (data not shown). No apparent changes in GDH1 catalysis were found with these proteins suggesting that the interaction between GDH1 and PMP-BCATm is enzyme-specific and requires reduced active BCATm.
FIGURE 4.

Oxidative deamination of glutamate by GDH1 is stimulated by PMP-BCATm. Activity was measured with (closed circles) and without (open circles) PLP-BCATm. A, leucine (Leu) alone stimulates GDH1 activity, which is enhanced by further addition of PLP-BCATm. Isoleucine (B) and valine (C) do not affect activity in the absence of BCATm.
Reductive Amination Reaction of GDH1 Is Not Affected by PMP-BCATm
The effect of BCATm on reductive amination was also evaluated. Addition of leucine to the GDH1 reaction mixture increased the reductive amination of α-KG by ∼10–15% (data not shown). Addition of PLP-BCATm did not result in a significant increase in the rate of reductive amination (18–22%) compared with leucine alone. Neither isoleucine nor valine had any effect on reductive amination catalyzed by GDH1 (data not shown). Addition of PLP-BCATm to the reaction mixture containing isoleucine or valine did not change the rate of reductive amination. Similarly, addition of PMP-BCATm to CXXC center oxidized or mutated BCATm or cytosolic BCATc had no effect on the GDH1 reductive amination. These results suggest that allosteric changes in GDH1 are specific for the deamination reaction.
Effects of BCATm on Phosphorylation of E1α by BDK
Human BCATm binds directly to E1 and promotes channeling of substrate from BCATm to E1. The structural integrity of the phosphorylation loop of E1 (Tyr-α286 to Glu-α312) is required for the binding of E1 with BCATm (5). Mutation or phosphorylation of this loop results in a disordered conformation of the loop inactivating E1 and interfering with binding to BCATm. To determine whether BCATm affects the rate of E1α phosphorylation, we incubated BDK and BCKDC with ATP in the presence or absence of BCATm and monitored the rate of BCKDC activity. When the E1α subunit is fully phosphorylated, overall BCKDC activity is zero. Addition of BCATm to E1 at a 1:1 molar ratio inhibited the BDK catalyzed inhibition of BCKDC activity by 45% (Fig. 5). The data suggest that in the presence of an equal molar ratio of E1 and BCATm, BDK cannot fully phosphorylate and inactivate E1α. However, when E1 is not associated with BCATm (such as in the presence of CXXC center oxidized or mutated BCATm or cytosolic BCATc), BDK was able to fully phosphorylate the E1 component and inhibit total BCKDC activity greater than 90% (Fig. 5).
FIGURE 5.
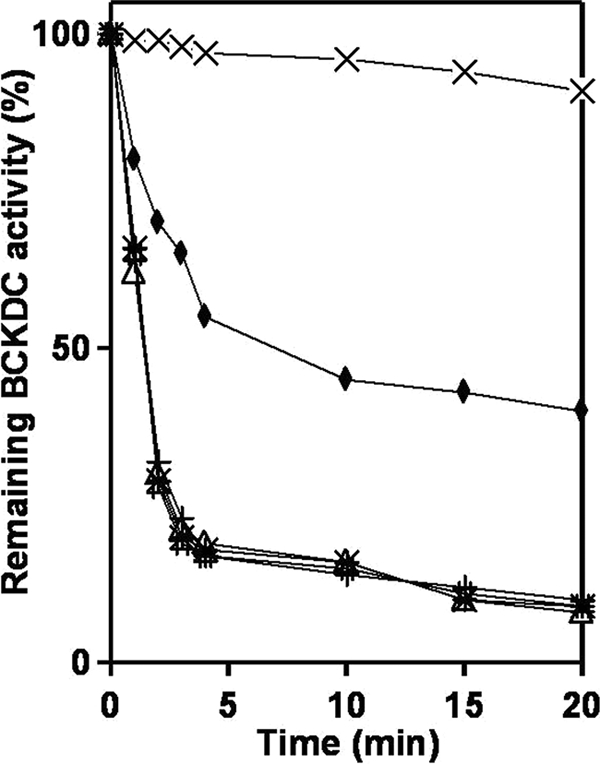
Protection of BCKD (E1) kinase-induced inhibition of BCKDC by BCATm. Overall activity of BCKDC was carried out in a 0.1-ml volume in the presence of BCATm, E1, E2, and E3 components of BCKDC in a 12:12:1:53 molar ratio. Phosphorylation of E1 was initiated by the addition of 2 mm MgCl2 and 1 mm ATP. Aliquots were taken at different time intervals, and the activity of the whole complex was assayed as described under “Experimental Procedures.” Phosphorylation of wild type E1 was performed in the absence of BCATm (*), in presence of BCATm (♦), CXXC center oxidized BCATm (Δ), CXXC center double mutant BCATm (#), and cytosolic BCATc (+). In all cases BCKDC activity in the absence of BDK was used as control (×).
Effects of PMP-BCATm on the Allosteric Regulation of GDH1 Activity
Kinetic analysis shows that ADP induces an allosteric conformational change in GDH1 (39). At 100 μm ADP, oxidative deamination was enhanced by 2-fold. Addition of PMP-BCATm to this reaction mixture (1:6 molar ratio with GDH1, equal number of active sites) did not produce any further enhancement of oxidative deamination (Fig. 6A). The data suggest that in presence of ADP, GDH1 is probably already in the maximum open state, and PMP-BCATm has no further effect on active site opening and/or suggests that BCATm does not bind in the presence of ADP.
FIGURE 6.

Effect of BCATm on the allosteric regulation of GDH1 activity in the oxidative deamination reaction. A, ADP activation of GDH1 activity (○). Presence of PMP-BCATm (1:6 molar ratios) had no effect on the ADP-induced activation of GDH1. ▿, 1 molar ratio; 224, 2 molar ratio; Δ, 4 molar ratio; ·, 6 molar ratio. B, GTP is an allosteric inhibitor of GDH1 activity (○). Addition of PMP-BCATm at (▿), 1 molar ratio; (224), 2 molar ratio; Δ, 4 molar ratio; (●), 6 molar ratio antagonizes the GTP induced allosteric inhibition of GDH1. C, ribbon diagram of the two subunits of hexameric mammalian GDH1 (bovine, Protein Data Bank code 1NR7). BCATm likely competes with GTP and enhances the opening of the catalytic cleft.
GTP is a strong allosteric inhibitor of GDH1 (Fig. 6B). At 1 mm GTP, GDH1 lost ∼90% of its activity. Addition of increasing concentrations of PMP-BCATm to the reaction mixture resulted in increasing protection from GTP inhibition. At a 3 or higher molar ratio of PMP-BCATm to GDH1, no further protection was observed. GDH1 is a homohexameric protein containing three active sites formed from each homodimer. Each dimer contains one GTP-binding site, one ADP-binding site, and one NADH-binding site. One GDH1 could potentially bind three BCATm. The Ki (inhibition constant) value for GTP was 52 nm in the absence of PMP-BCATm (Table 2). Increasing the molar ratio of PMP-BCATm to GDH1 in the reaction mixture resulted in increased Ki values for GTP with a maximum value of 8 μm. The data suggest that binding of PMP-BCATm changes the conformation of GDH1, and this abrogates the GDH1 abortive complex.
TABLE 2.
Effect of PMP-BCATm on the GTP inhibition constant (Ki) of GDH1
Kinetics of GTP inhibition of bovine GDH1 activity were performed in the direction of oxidative deamination reaction. At each fixed molar ratio of PMP-BCATm and GDH1 (left column), GTP concentrations were increased gradually up to saturation. The Ki values for GTP were calculated using the nonlinear kinetic equation, % activity = 100·(M1([GTP])/(Ki + [GTP])), where [GTP] is the concentration of GTP; Ki is the inhibition constant of GTP, and M1 is the factor associated with maximum extent of GTP inhibition (39).
| PMP-BCATm/GDH1 molar ratio | Ki |
|---|---|
| μm | |
| 0 | 0.05 ± 0.00 |
| 1 | 1.56 ± 0.15 |
| 2 | 3.12 ± 0.40 |
| 4 | 8.06 ± 0.86 |
| 6 | 7.95 ± 1.00 |
Interaction between BCATm and GDH1 Markedly Stimulates the Transamination Reaction of PMP-BCATm
Human BCATm is a PLP-dependent enzyme, and the PLP cofactor is covalently attached to the Lys-202 in the active site of the enzyme. After transamination with BCAAs (the first half-reaction shown in Reaction 1), the PLP form of the enzyme is converted to the PMP form of the enzyme. The PLP-BCATm form can be regenerated from PMP-BCATm by direct interaction with GDH1 and channeling of α-KG produced from GDH1-catalyzed oxidative deamination or by free α-KG. To characterize this interaction, the fast reaction kinetics of PMP-BCATm in the presence of α-KG were performed in either the presence or absence of GDH1. Results are shown in Table 3. Addition of GDH1 enhanced the kcat value of PMP-BCATm-catalyzed reamination of α-KG by 15-fold and reduced the Km by 4.5-fold. However, there were no changes in the kinetic constants for PMP-BCATc transamination in the presence of GDH1, indicating that the interaction between GDH1 and PMP-BCATm is specific. These results are consistent with increased catalytic efficiency as a result of the interaction between BCATm and GDH1.
TABLE 3.
Pre-steady state kinetics constants of PMP-BCAT
Conditions were 50 mm NaHEPES buffer at pH 8.0, 0.1 m KCl, and 1 mm EDTA. GDH1 was added in the reaction mixture with 0.2 mm NAD+. The fast reaction kinetics of BCATs were performed using a stopped-flow spectrophotometer (Applied Photophysics, Leatherhead, UK). Enzymes (80 μm) and ligands were placed in different syringes, and the reactions were initiated by injecting the enzymes and ligands in the reaction chamber. The apparent rate constants at 330 nm were performed using the software provided with the instrument.
| Substrate | GDH1 | Enzymes | kcat | Km | kcat/Km |
|---|---|---|---|---|---|
| s−1 | mm | m−1s−1 × 10⁴ | |||
| α-KG | − | PMP-BCATm | 375 ± 20 | 7.9 ± 1.2 | 4.7 |
| α-KG | + | PMP-BCATm | 5600 ± 89 | 1.8 ± 0.4 | 3110 |
| α-KG | − | PMP-BCATc | 430 ± 15 | 3.8 ± 0.2 | 3.8 |
| α-KG | + | PMP-BCATc | 444 ± 13 | 3.5 ± 0.3 | 3.5 |
Decarboxylation Catalytic Activity of E1 Is Accelerated by the Association between PMP-BCATm and GDH1
E1 uses the BCKA product of BCAA deamination reaction catalyzed by PLP-BCATm. As mentioned previously, PLP-BCATm is regenerated from PMP-BCATm by direct interaction with GDH1. To further understand the significance of the association, we measured the kinetics of E1 decarboxylation reaction either in the presence or absence of GDH1 and using DCPIP as an electron acceptor. If the association between PMP-BCATm and GDH1 results in more efficient regeneration of PLP-BCATm and this step can be limiting, the rate of E1-catalyzed oxidative decarboxylation reaction might proceed faster in the presence of GDH1 than the absence of GDH1. The increase would result in a higher kcat values, Km values for BCAAs and BCKAs are not directly comparable, because they are specific for specific substrates for their respective enzymes. As shown in Table 4, in the presence of leucine and PLP-BCATm, there was a 12-fold increase of calculated kcat values for E1-catalyzed decarboxylation, when compared with E1 plus KIC. However, addition of GDH1 further enhanced the kcat value by 8-fold compared with the absence of GDH1 in the reaction mixture. When PMP-BCATm was used instead of PLP-BCATm, the decarboxylation activity was still higher but was lower than in the presence of PLP-BCATm. Similarly, if GDH1 was added to the PMP-BCATm reaction mixture, kcat was accelerated, although lower than in the presence of PLP-BCATm. PLP-BCATm rapidly converts the leucine to KIC so that it rapidly enters in E1-catalyzed decarboxylation reaction. However, PMP-BCATm should convert to PLP-BCATm before transaminating leucine, and this extra step reaction slowed down the reaction in the PMP-BCATm reaction mixture. These results suggest that GDH1 binds and facilitates regeneration of PLP-BCATm, which ultimately enhanced the overall reactions of BCATm and E1.
TABLE 4.
Addition of GDH1 increases the kcat of E1-catalyzed decarboxylation reaction
The DCPIP assays were carried out with 1 mm ThDP and varying concentrations of amino acids (5 μm to 5 mm leucine) or α-keto acids (KIC, 0.5 mm to 1 mm; α-KG, 0.5 mm to 20 mm). The pH of the DCPIP buffers was 8.0, and the reactions were performed at 30 °C. GDH1 was added in the reaction mixture with 0.2 mm NAD+. All values are the average of three independent experiments.
| Additions | Variable substrates | kcat values | Km values |
|---|---|---|---|
| min−1 | μm | ||
| DCPIP assays | |||
| None | KIC | 7.7 ± 1 | 40 ± 2 |
| None | α-KG | NDa | ND |
| α-KG | KIC | 7.6 ± 1 | 40 ± 3 |
| α-KG + PLP-BCATm | Leucine | 90 ± 4 | 259 ± 15 |
| α-KG + PLP-BCATm + GDH1 | Leucine | 720 ± 13 | 240 ± 7 |
| α-KG + PMP-BCATm | Leucine | 70 ± 3 | 280 ± 18 |
| α-KG + PMP-BCATm + GDH1 | Leucine | 566 ± 14 | 275 ± 15 |
a ND indicates not detectable.
GDH1 Alone Does Not Change the Rate of BCKDC Catalysis
To see if there is an effect of GDH1 alone on BCKDC catalytic activities, we determined the kinetic constants of E1 and BCKDC overall catalysis in the presence of GDH1. As shown in the Table 5, addition of GDH1 (1:6 molar ratio of E1) resulted in no apparent change in rate constants, kcat or dissociation constants, or Km values of the E1 decarboxylation reaction. The results are consistent with the absence of direct association between E1 and GDH1 and the specificity of E1 for BCKAs (α-KG is not a substrate for E1) (5). After the first cycle of transamination and decarboxylation, PMP-BCATm was produced which was recycled to PLP-BCATm by α-KG. Because GDH1 produces α-KG through oxidative deamination of glutamate, E1 decarboxylation assays were performed in the presence of PLP-BCATm, BCAAs, GDH1, and glutamate (no added α-KG or BCKA). As shown in Table 5, facilitating regeneration of PLP-BCATm by GDH1 plus glutamate enhanced the calculated kcat by 10–12-fold when compared with E1 plus BCKAs alone. The Km values for BCAAs were also lower in the presence of GDH1 and glutamate as compared with native BCATm enzyme (Table 5) (27, 47). There were no detectable changes in kinetic constants for E1 decarboxylation in the presence of CXXC mutated or oxidized BCATm and GDH1, indicating the importance of the reduced redox center for BCATm binding to E1 or GDH1.
TABLE 5.
Effect of GDH1 on the kinetics of E1 and BCKDC catalysis
In both the DCPIP assay and the overall assay, ThDP (1 mm) concentrations were kept constant. With GDH1 addition, glutamate (20 mm) was used to produce α-ketoglutarate. The maximum concentration of the substrates used in the titration was always 10-fold higher than the Km values of the substrates for each individual reaction. All values are the average of three independent experiments.
| DCPIP assay |
Overall assay |
|||||||||||
|---|---|---|---|---|---|---|---|---|---|---|---|---|
|
kcat |
Km |
kcat |
Km |
|||||||||
| min−1 | μm | min−1 | μm | |||||||||
| Addition | Leu | Ile | Val | Leu | Ile | Val | Leu | Ile | Val | Leu | Ile | Val |
| BCKAa | 7.7 ± 1 | 8.0 ± 1 | 13 ± 1 | 41 ± 4 | 35 ± 5 | 50 ± 4 | 149 ± 13 | 180 ± 10 | 215 ± 18 | 42 ± 7 | 35 ± 6 | 53 ± 3 |
| GDH1a | 7.6 ± 1 | 7.9 ± 1 | 14 ± 1 | 39 ± 3 | 34 ± 3 | 52 ± 6 | 157 ± 10 | 175 ± 11 | 199 ± 12 | 39 ± 5 | 37 ± 3 | 50 ± 3 |
| PLP-BCATmb + GDH1 | 89 ± 5 | 99 ± 5 | 165 ± 5 | 280 ± 15 | 255 ± 13 | 690 ± 25 | 250 ± 9 | 279 ± 7 | 390 ± 17 | 210 ± 23 | 189 ± 20 | 640 ± 18 |
| BCATm-Oxc + GDH1 | 7.0 ± 1 | 7.2 ± 1 | 14 ± 1 | 15,800 ± 20 | 9060 ± 25 | 45000 ± 80 | 123 ± 8 | 135 ± 13 | 177 ± 12 | 8600 ± 14 | 8900 ± 33 | 47,000 ± 60 |
a The kinetic values are for corresponding α-ketoacids of leucine, α-ketoisocaproate, isoleucine, α-keto-β-methylvalerate, valine, and α-ketoisovalerate.
b The Km values for the BCAAs in the transamination reaction with PLP-BCATm alone are 1.6 mm Leu, 1.3 mm Ile, and 7.7 mm Val (27).
c The Km values for the BCAAs are 10-fold higher in oxidized BCATm than WT-BCATm, and oxidized BCATm (BCATm-Ox) does not form protein complex with other metabolon protein partners (27).
To see if GDH1 affected the other components of BCKDC, overall BCKDC activity was measured in the presence or absence of GDH1. GDH1 did not have a significant effect on BCKDC (Table 5) activity. However, addition of GDH1 and glutamate enhanced the calculated kcat value by 40–45% with BCATm present when compared with BCKDC plus BCKAs alone (Table 5). As with E1, Km values for BCAAs in the overall reaction were lower in the presence of GDH1 and glutamate as compared with native BCATm enzyme (27, 47). Neither the CXXC mutants nor oxidized BCATm had any effect on the overall kinetic parameters of BCKDC.
DISCUSSION
In this study we have identified additional proteins in the “BCAA metabolon.” Several metabolic enzymes such as GDH1, PC, and a protein with unknown function, NIPSNAP1, were found in the multiprotein complex (Figs. 1 and 2). We show that GDH1 can participate functionally by regenerating the form of BCATm that binds to E1, creating a kinetically more efficient channeling of BCATm products to the oxidative pathway. Not only is the metabolon kinetically more efficient, but metabolon formation results in lower Km values for BCAAs and glutamate that are in line with physiologically observed concentrations of these amino acids in cells. In cells, the concentrations of the α-keto acids (BCKAs and α-KG) are significantly lower than their respective amino acids. Our results suggest that changes in flux will occur in response to physiologically relevant changes in the amino acids.
In the model shown in Fig. 7, the PLP form of BCATm binds to the E1 component of BCKDC, and after the first transamination half-reaction reaction, PMP-BCATm is released from the complex. It needs to be converted to PLP-BCATm to complete the catalytic cycle (Fig. 7). GDH1 is a binding partner for PMP-BCATm. Kinetic results provide the evidence that the association between PMP-BCATm and GDH1 enhanced the allosteric activation of GDH1 oxidative deamination. This physical association between these two proteins facilitates the channeling of α-KG to PMP-BCATm to generate the PLP-BCATm, which then restarts the cycle (Fig. 7).
FIGURE 7.

Proposed model of BCAA metabolon. PLP-BCATm binds to E1, promoting channeling of KIC from BCATm to E1, leading to decarboxylation of KIC, and release of CO2. PMP-BCATm dissociates from E1. Product isovaleryl-CoA is released from E2. E3 reoxidizes the lipoamide cofactor (data not shown), forming NADH. GDH1 binds PMP-BCATm and regenerates PLP-BCATm through oxidative deamination of Glu by GDH1 and reamination of α-KG by PMP-BCATm. Regenerated PLP-BCATm binds E1 to restart the reaction cycle. Abbreviations used are as follows: PLP-BCATm, pyridoxal form of mitochondrial branched-chain aminotransferase; PMP-BCATm, pyridoxamine form of mitochondrial branched-chain aminotransferase; LBD, lipoyl-bearing mutation; SBD, subunit-binding domain.
The interaction between GDH1 and BCATm can occur in the absence of BCKDC. In the presence of a BCAA, glutamate, BCATm, and GDH1, BCAA nitrogen is efficiently channeled to glutamate, and BCKA, ammonia, and NAD+ are the reaction products. α-KG produced by GDH1-catalyzed oxidative deamination of glutamate produces α-KG, which is converted back to glutamate as it receives the BCAA nitrogen group and no net change in α-ketoglutarate or glutamate concentrations occur. The interaction between BCATm and GDH1 also enhances leucine stimulation of GDH1 activity. In the presence of BCATm, leucine is an effective activator of GDH1 at physiologically relevant concentrations of this BCAA (≤1 mm, see Fig. 4). In the presence of BCATm, all BCAAs could activate GDH1 presumably by promoting an allosteric change in GDH1 that occurs on binding of PMP-BCATm formed during the first transamination half-reaction. Increased kinetic efficiency achieved by substrate channeling of the product α-KG to the active site of BCATm may also contribute. BCATm had no effect on reductive amination. Thus the presence of BCATm and BCAAs promotes glutamate nitrogen shuttling and ammonia formation. Fixation of ammonia into glutamic acid yields glutamine, and glutamine is used in the synthesis of purines and pyrimidines through the formation of carbamyl phosphate. In the presence of active BCKDC, the BCKA that is produced in the PLP-BCATm half-reaction is oxidized by BCKDC, which is facilitated by PLP-BCATm binding to the E1 decarboxylase. Because NADH used in the GDH reaction is regenerated in the BCKDC reaction, the net reaction products of the combined GDH1, BCATm, and BCKDC reactions are branched-chain acyl-CoAs and ammonia. Further oxidation of leucine produces acetyl-CoA and acetoacetate. Because glutamate is regenerated by reamination of the GDH1 product α-KG in the PMP-BCATm half-reaction, the relative amount and activities of GDH1 and BCATm (availability of PMP-BCATm) will affect the net amount of α-ketoglutarate that is produced and available for oxidation. A high GDH1/PMP-BCATm favors glutamate oxidation. If, for example, reaction rates are equal, then full operation of the cycle produces an increase in leucine catabolic metabolites. Regardless, BCAA nitrogen is transferred into the large glutamate pool. However, actual net transfer of BCAA nitrogen occurs when BCKDC is active (BCAAs are oxidized) and is promoted by BCATm-E1α complex formation and substrate channeling of BCKA from BCATm to E1.
In humans and rodents, the pancreas has one of the highest concentrations of BCATm in the body (48). Leucine is a known insulin secretagogue (19, 49). It has been hypothesized that leucine stimulation of GDH1 activity and leucine metabolism to acetyl-CoA and acetoacetate are both involved in the leucine stimulation of insulin secretion (51). Our results suggest that activation of GDH1 oxidative deamination of glutamate in the mitochondria is likely modulated by leucine and BCATm concentrations as well as factors influencing complex formation such as NAD+/NADH, ADP, and GTP concentrations. Glutamate oxidation would be favored by limiting BCATm availability or stimulating glutamate nitrogen transfer via other aminotransferases (alanine aminotransferase and aspartate aminotransferase) to produce α-KG. Interestingly, in freshly isolated rat islets, we found limited amounts of BCATm protein on Western blots.3 Immunohistochemical results suggest the highest concentration of BCATm is actually in the exocrine pancreas (acinar cells), not in the islets (52), and KIC is also an insulin secretagogue. One might speculate that in vivo both leucine and KIC produced in the acinus play a role in the physiological response to leucine.
We have shown that metabolon formation antagonizes phosphorylation of E1 and inhibition of BCKDC activity while increasing the NADH/NAD+ ratio, and phosphorylation of E1α serves to shut down oxidation and promote BCKA release. Thus, the presence of BCATm in a tissue may play a role in regulating the phosphorylation state of BCKDC. In rat skeletal muscle where BDK expression is higher than in other rodent tissues, the enzyme is highly phosphorylated at all times, which promotes BCKA release. There is active uptake of glutamate by skeletal muscle (53, 54). GDH1 is present in low concentrations in skeletal muscle compared with liver (55), and alanine is the major product of BCAA nitrogen transfer (56). Conditions that promote PMP-BCATm and GDH1 binding and activation of GDH1 could result in a transient increase in ammonia production. In the congenital hyperinsulinism syndrome that results from mutation of the GDH1 GTP-binding site rendering the enzyme insensitive to GTP inhibition, transient hyperammonia has been observed in association with a protein meal, and skeletal muscle was hypothesized as the main source of the excess ammonia (57). The clinical consequences of these mutations suggest that GDH1 plays a significant role in the overall control of amino acid catabolism and ammonia metabolism integrating responses to changes in intracellular energy potential and amino acid levels (57).
Proteins show large structural heterogeneity at the molecular level that permits them to recognize and adapt to the structure of the binding partners. The “induced fit” and “conformational selection” mechanisms are well developed hypotheses for conformational change in proteins bound in complexes as compared with unbound proteins (32, 58). The conformational changes of GDH1 upon complex formation with PMP-BCATm support the conformational selection mechanism of complex formation between these two proteins. Detailed structural analysis of GDH1 using activators and inhibitors has been described by Smith et al. (40) (see in Fig. 7C) (50). A special allosteric regulation site antenna domain regulates the open/closed conformation of the catalytic cleft. The six glutamate-binding domains form the catalytic core of this enzyme. Upon substrate and cofactor binding, the NADH-binding domain clamps down on the glutamate-binding domain. Apo-GDH1 is usually in an open conformation. However, when substrate and cofactor bind, it forms a ternary complex with an energetically favorable closed catalytic cleft. Activators, like ADP, have no direct effect on closing the catalytic cleft, rather they facilitate the opening of the catalytic cleft. Upon ADP binding, one of the arginine residues rotates toward the antenna region that facilitates the interaction with the β-phosphate of ADP and ultimately enhances the opening of the active site (40). Inhibitors like GTP bind to a different binding site and form an energetically unfavorable abortive complex where the catalytic cleft is in a super-closed state. Our results suggest that there is competition between GTP and PMP-BCATm to bind GDH1. On the other hand, PMP-BCATm does not have a direct effect on ADP binding to GDH1. These results suggest that either PMP-BCATm binds to the GTP-binding site of GDH1 or binding of PMP-BCATm changes the conformation of the GTP-binding site of GDH1, which ultimately disrupts GTP binding to GDH1. The open conformation of PMP-BCATm and GDH1 during catalysis facilitates the channel formation between these two enzymes just as the open conformation of unphosphorylated E1α promotes binding to PLP-BCATm (5).
Why then does only the PMP form of BCATm interact with GDH1? BCATm is a homodimeric protein containing two active sites. The cofactor is at the bottom of the active site. The PLP cofactor is bound to Lys-202 via a Schiff base. The PMP form is held only by ionic interactions. The large conformational change of Lys-202 and rotation of PMP cofactor in the active site make space for proper positioning of α-KG, which only binds to the PMP form of the enzyme. The free amino group of both PMP and the Lys-202 side chain remain in the protonated state, which creates a net positive charge at the active site of PMP-BCATm. The electrostatic nature of the residues at the opening of the active site pocket and next to the GTP-binding site, specifically Glu-439 and Asp-442, are negatively charged. Thus ionic interactions between the active sites of PMP-BCATm and GDH1 may facilitate binding and transfer of α-KG from PMP-BCATm to GDH1.
In summary, we have found direct interaction between BCAA metabolic enzymes in tissues that express BCATm. We have provided evidence that GDH1 can play a functional role in BCAA metabolism. Further studies will be required to determine function of other metabolon proteins.
This work was supported, in whole or in part, by National Institutes of Health Grants DK34738 (to S. M. H.) and DK26758 (to D. T. C.) from the USPHS.
A. J. Sweatt and S. M. Hutson, unpublished data.
- BCATm
- mitochondrial branched-chain aminotransferase
- BCAA
- branched-chain amino acid
- BCKA
- branched-chain α-ketoacid
- BCKDC
- branched-chain α-ketoacid dehydrogenase complex
- BCAT
- branched-chain aminotransferase
- BCATc
- cytosolic branched-chain aminotransferase
- DCPIP
- 2,6-dichlorophenolindophenol
- DTT
- dithiothreitol
- E1
- branched-chain α-keto acid decarboxylase/dehydrogenase
- E2
- dihydrolipoyltransacylase
- E3
- dihydrolipoamide dehydrogenase
- KIC
- α-ketoisocaproate
- α-KG
- α-ketoglutarate
- NIPSNAP1
- 4-nitrophenylphosphatase domain and non-neuronal SNAP25-like protein homolog 1
- PLP
- pyridoxal 5′-phosphate
- PMP
- pyridoxamine 5′-phosphate
- ThDP
- thiamine diphosphate
- BDK
- BCKDC kinase
- CHO
- Chinese hamster ovary
- MALDI
- matrix-assisted laser desorption ionization
- CHAPS
- 3-[(3-cholamidopropyl)dimethylammonio]-1-propanesulfonic acid
- DSP
- dithiobis(succinimidyl propionate)
- PC
- pyruvate carboxylase.
REFERENCES
- 1.Srere P. A. (2000) Trends Biochem. Sci. 25, 150–153 [DOI] [PubMed] [Google Scholar]
- 2.Srere P. A. (1985) Trends Biochem. 10, 109–110 [Google Scholar]
- 3.An S., Kumar R., Sheets E. D., Benkovic S. J. (2008) Science 320, 103–106 [DOI] [PubMed] [Google Scholar]
- 4.Campanella M. E., Chu H., Low P. S. (2005) Proc. Natl. Acad. Sci. U.S.A. 102, 2402–2407 [DOI] [PMC free article] [PubMed] [Google Scholar]
- 5.Islam M. M., Wallin R., Wynn R. M., Conway M., Fujii H., Mobley J. A., Chuang D. T., Hutson S. M. (2007) J. Biol. Chem. 282, 11893–11903 [DOI] [PubMed] [Google Scholar]
- 6.Hayashi H., Inoue K., Nagata T., Kuramitsu S., Kagamiyama H. (1993) Biochemistry 32, 12229–12239 [DOI] [PubMed] [Google Scholar]
- 7.Conway M. E., Hutson S. M. (2000) Methods Enzymol. 324, 355–365 [DOI] [PubMed] [Google Scholar]
- 8.Yennawar N. H., Conway M. E., Yennawar H. P., Farber G. K., Hutson S. M. (2002) Biochemistry 41, 11592–11601 [DOI] [PubMed] [Google Scholar]
- 9.Yennawar N., Dunbar J., Conway M., Hutson S., Farber G. (2001) Acta Crystallogr. D Biol. Crystallogr. 57, 506–515 [DOI] [PubMed] [Google Scholar]
- 10.Kagamiyama H., Hayashi H. (2000) Methods Enzymol. 324, 103–113 [DOI] [PubMed] [Google Scholar]
- 11.Hutson S. M., Sweatt A. J., Lanoue K. F. (2005) J. Nutr. 135, (Suppl. 6) 1557–1564 [DOI] [PubMed] [Google Scholar]
- 12.Reed L. J., Damuni Z., Merryfield M. L. (1985) Curr. Top. Cell Regul. 27, 41–49 [DOI] [PubMed] [Google Scholar]
- 13.Reed L. J., Hackert M. L. (1990) J. Biol. Chem. 265, 8971–8974 [PubMed] [Google Scholar]
- 14.Reed L. J. (2001) J. Biol. Chem. 276, 38329–38336 [DOI] [PubMed] [Google Scholar]
- 15.Li J., Wynn R. M., Machius M., Chuang J. L., Karthikeyan S., Tomchick D. R., Chuang D. T. (2004) J. Biol. Chem. 279, 32968–32978 [DOI] [PubMed] [Google Scholar]
- 16.Machius M., Wynn R. M., Chuang J. L., Li J., Kluger R., Yu D., Tomchick D. R., Brautigam C. A., Chuang D. T. (2006) Structure 14, 287–298 [DOI] [PubMed] [Google Scholar]
- 17.Gao Z., Young R. A., Li G., Najafi H., Buettger C., Sukumvanich S. S., Wong R. K., Wolf B. A., Matschinsky F. M. (2003) Endocrinology 144, 1949–1957 [DOI] [PubMed] [Google Scholar]
- 18.Hutton J. C., Sener A., Malaisse W. J. (1980) J. Biol. Chem. 255, 7340–7346 [PubMed] [Google Scholar]
- 19.Sener A., Malaisse W. J. (1980) Nature 288, 187–189 [DOI] [PubMed] [Google Scholar]
- 20.Wallin R., Hall T. R., Hutson S. M. (1990) J. Biol. Chem. 265, 6019–6024 [PubMed] [Google Scholar]
- 21.Hutson S. M. (1986) J. Biol. Chem. 261, 4420–4425 [PubMed] [Google Scholar]
- 22.MacDonald M. J., Smith A. D., 3rd, Hasan N. M., Sabat G., Fahien L. A. (2007) J. Biol. Chem. 282, 30596–30606 [DOI] [PubMed] [Google Scholar]
- 23.Pedersen P. L., Greenawalt J. W., Reynafarje B., Hullihen J., Decker G. L., Soper J. W., Bustamente E. (1978) Methods Cell Biol. 20, 411–481 [DOI] [PubMed] [Google Scholar]
- 24.Hutson S. M. (1989) Ann. N.Y. Acad. Sci. 573, 230–239 [DOI] [PubMed] [Google Scholar]
- 25.Conway M. E., Poole L. B., Hutson S. M. (2004) Biochemistry 43, 7356–7364 [DOI] [PubMed] [Google Scholar]
- 26.Conway M. E., Yennawar N., Wallin R., Poole L. B., Hutson S. M. (2002) Biochemistry 41, 9070–9078 [DOI] [PubMed] [Google Scholar]
- 27.Yennawar N. H., Islam M. M., Conway M., Wallin R., Hutson S. M. (2006) J. Biol. Chem. 281, 39660–39671 [DOI] [PubMed] [Google Scholar]
- 28.Chuang J. L., Davie J. R., Wynn R. M., Chuang D. T. (2000) Methods Enzymol. 324, 192–200 [DOI] [PubMed] [Google Scholar]
- 29.Wynn R. M., Davie J. R., Song J. L., Chuang J. L., Chuang D. T. (2000) Methods Enzymol. 324, 179–191 [DOI] [PubMed] [Google Scholar]
- 30.Zimmerman L. J., Wernke G. R., Caprioli R. M., Liebler D. C. (2005) J. Proteome Res. 4, 1672–1680 [DOI] [PubMed] [Google Scholar]
- 31.Fang J., Hsu B. Y., MacMullen C. M., Poncz M., Smith T. J., Stanley C. A. (2002) Biochem. J. 363, 81–87 [DOI] [PMC free article] [PubMed] [Google Scholar]
- 32.Ma B., Kumar S., Tsai C. J., Nussinov R. (1999) Protein Eng. 12, 713–720 [DOI] [PubMed] [Google Scholar]
- 33.Wynn R. M., Kato M., Machius M., Chuang J. L., Li J., Tomchick D. R., Chuang D. T. (2004) Structure 12, 2185–2196 [DOI] [PubMed] [Google Scholar]
- 34.McCarthy A. D., Tipton K. F. (1985) Biochem. J. 230, 95–99 [DOI] [PMC free article] [PubMed] [Google Scholar]
- 35.Wallace J. C., Jitrapakdee S., Chapman-Smith A. (1998) Int. J. Biochem. Cell Biol. 30, 1–5 [DOI] [PubMed] [Google Scholar]
- 36.Harris R. A., Powell S. M., Paxton R., Gillim S. E., Nagae H. (1985) Arch. Biochem. Biophys. 243, 542–555 [DOI] [PubMed] [Google Scholar]
- 37.Lynch C. J., Halle B., Fujii H., Vary T. C., Wallin R., Damuni Z., Hutson S. M. (2003) Am. J. Physiol. Endocrinol. Metab. 285, E854–E863 [DOI] [PubMed] [Google Scholar]
- 38.Johnson D. T., Harris R. A., French S., Blair P. V., You J., Bemis K. G., Wang M., Balaban R. S. (2007) Am. J. Physiol. Cell Physiol. 292, C689–C697 [DOI] [PubMed] [Google Scholar]
- 39.Allen A., Kwagh J., Fang J., Stanley C. A., Smith T. J. (2004) Biochemistry 43, 14431–14443 [DOI] [PubMed] [Google Scholar]
- 40.Smith T. J., Schmidt T., Fang J., Wu J., Siuzdak G., Stanley C. A. (2002) J. Mol. Biol. 318, 765–777 [DOI] [PubMed] [Google Scholar]
- 41.Kawajiri M., Okano Y., Kuno M., Tokuhara D., Hase Y., Inada H., Tashiro F., Miyazaki J., Yamano T. (2006) Pediatr. Res. 59, 359–364 [DOI] [PubMed] [Google Scholar]
- 42.Choi M. M., Huh J. W., Yang S. J., Cho E. H., Choi S. Y., Cho S. W. (2005) FEBS Lett. 579, 4125–4130 [DOI] [PubMed] [Google Scholar]
- 43.Newsholme P., Brennan L., Rubi B., Maechler P. (2005) Clin. Sci. 108, 185–194 [DOI] [PubMed] [Google Scholar]
- 44.Yoon H. Y., Cho E. H., Yang S. J., Lee H. J., Huh J. W., Choi M. M., Cho S. W. (2004) Biochimie 86, 261–267 [DOI] [PubMed] [Google Scholar]
- 45.Bayley P. M., O'Neill K. T. (1980) Eur. J. Biochem. 112, 521–531 [DOI] [PubMed] [Google Scholar]
- 46.Zeiri L., Reisler E. (1979) Biopolymers 18, 2289–2301 [DOI] [PubMed] [Google Scholar]
- 47.Davoodi J., Drown P. M., Bledsoe R. K., Wallin R., Reinhart G. D., Hutson S. M. (1998) J. Biol. Chem. 273, 4982–4989 [DOI] [PubMed] [Google Scholar]
- 48.Suryawan A., Hawes J. W., Harris R. A., Shimomura Y., Jenkins A. E., Hutson S. M. (1998) Am. J. Clin. Nutr. 68, 72–81 [DOI] [PubMed] [Google Scholar]
- 49.Gylfe E. (1976) Acta Diabetol. 13, 20–24 [DOI] [PubMed] [Google Scholar]
- 50.Smith T. J., Peterson P. E., Schmidt T., Fang J., Stanley C. A. (2001) J. Mol. Biol. 307, 707–720 [DOI] [PubMed] [Google Scholar]
- 51.Macdonald M. J., Hasan N. M., Longacre M. J. (2008) Biochim. Biophys. Acta 1780, 966–972 [DOI] [PMC free article] [PubMed] [Google Scholar]
- 52.Sweatt A. J., Wood M., Suryawan A., Wallin R., Willingham M. C., Hutson S. M. (2004) Am. J. Physiol. Endocrinol. Metab. 286, E64–E76 [DOI] [PubMed] [Google Scholar]
- 53.Felig P., Wahren J., Ahlborg G. (1973) Proc. Soc. Exp. Biol. Med. 142, 230–231 [DOI] [PubMed] [Google Scholar]
- 54.Hutson S. M., Cree T. C., Harper A. E. (1978) J. Biol. Chem. 253, 8126–8133 [PubMed] [Google Scholar]
- 55.Palmer T. N., Caldecourt M. A., Snell K., Sugden M. C. (1985) Biosci. Rep. 5, 1015–1033 [DOI] [PubMed] [Google Scholar]
- 56.Hutson S. M., Lieth E., LaNoue K. F. (2001) J. Nutr. 131, 846S–850S [DOI] [PubMed] [Google Scholar]
- 57.Stanley C. A., Lieu Y. K., Hsu B. Y., Burlina A. B., Greenberg C. R., Hopwood N. J., Perlman K., Rich B. H., Zammarchi E., Poncz M. (1998) N. Engl. J. Med. 338, 1352–1357 [DOI] [PubMed] [Google Scholar]
- 58.Koshland D. E. (1958) Proc. Natl. Acad. Sci. U.S.A. 44, 98–104 [DOI] [PMC free article] [PubMed] [Google Scholar]