Abstract
CD38 is a type II glycoprotein that is responsible for the synthesis and hydrolysis of cyclic ADP-ribose (cADPR) and nicotinic acid adenine dinucleotide phosphate (NAADP), Ca2+-mobilizing second messengers. The activation of hepatic stellate cells (HSCs) is a critical event in hepatic fibrosis because these cells are the main producers of extracellular matrix proteins in the liver. Recent evidence indicates that the renin-angiotensin system plays a major role in liver fibrosis. In this study, we showed that angiotensin II (Ang II) evoked long lasting Ca2+ rises and induced NAADP or cADPR productions via CD38 in HSCs. Inositol 1,4,5-trisphosphate as well as NAADP-induced initial Ca2+ transients were prerequisite for the production of cADPR, which was responsible for later sustained Ca2+ rises in the Ang II-treated HSCs. Ang II-mediated inositol 1,4,5-trisphosphate- and NAADP-stimulated Ca2+ signals cross-talked in a dependent manner with each other. We also demonstrated that CD38 plays an important role in Ang II-induced proliferation and overproduction of extracellular matrix proteins in HSCs, which were reduced by an antagonistic cADPR analog, 8-bromo-cADPR, or in CD38−/− HSCs. Moreover, we presented evidence to implicate CD38 in the bile duct ligation-induced liver fibrogenesis; infiltration of inflammatory cells and expressions of α-smooth muscle actin, transforming growth factor-β1, collagen αI(1), and fibronectin were reduced in CD38−/− mice compared with those in CD38+/+ mice. These results demonstrate that CD38-mediated Ca2+ signals contribute to liver fibrosis via HSCs activation, suggesting that intervention of CD38 activation may help prevent hepatic fibrosis.
Keywords: Diseases, G Proteins/Coupled Receptors (GPCR), Signal Transduction/Calcium, CD38, Cyclic ADP-ribose (cADPR), Hepatic Fibrosis, Hepatic Stellate Cells, Nicotinic Acid Adenine Dinucleotide Phosphate (NAADP)
Introduction
Hepatic fibrosis represents a major medical problem worldwide with significant morbidity and mortality. Chronic stimuli like alcohol consumption, viral infection, cholestasis, or metabolic disorders result in the deposition of scar tissue and the development of cirrhosis. Hepatic stellate cells (HSCs)3 are the major players during liver fibrogenesis (1). Upon liver injury, normally quiescent HSCs become activated, undergo profound morphological changes, and transdifferentiate into myofibroblast-like cells. This process is termed “HSC activation,” in which de novo expression of α-smooth muscle actin (SMA), enhanced cell proliferation, and excessive production of extracellular matrix (ECM) are the most characteristic features (2). HSCs are activated by a variety of hormones or growth factors, including angiotensin II (Ang II) (3–6). There is evidence that the renin-angiotensin system components are up-regulated in HSCs isolated from human cirrhotic livers and in cultured HSCs (7). Moreover, previous studies have revealed that an activated HSC expresses Ang II type 1 receptor (7), and blockade of Ang II type 1 receptor has been shown to attenuate hepatic fibrosis in an animal model (8). Furthermore, therapeutic efficacy of an Ang II type 1 receptor blocker in a patient with nonalcoholic steatohepatitis has also been reported (9).
Cells possess multiple Ca2+ stores and multiple Ca2+-mobilizing messenger molecules (10–13). These include inositol 1,4,5-trisphosphate (IP3), cyclic adenosine diphosphoribose (cADPR), and nicotinic acid adenine dinucleotide phosphate (NAADP). It is generally accepted that Ca2+ stores for IP3 and cADPR are located in endoplasmic reticulum (ER) in most mammalian cells, whereas Ca2+ stores for NAADP are localized in acidic organelles (11–13). The IP3 receptor (IP3R) and receptor for cADPR (ryanodine receptor) have been well characterized (13, 14); however, one isoform of two-pore channels (TPC2) has recently been proposed as a receptor for NAADP (15). Intriguingly, the receptor for NAADP has a property of desensitization with a high concentration of NAADP (16). The multifunctional ectoenzyme CD38 synthesizes cADPR and NAADP (17). Recently, CD38 was identified as a key regulator of HSC activation (18). However, the precise mechanism underlying the association between CD38 and HSC activation in liver fibrosis remains to be resolved.
In this study, we studied whether Ang II-mediated CD38 activation can induce an increase of intracellular Ca2+ concentration ([Ca2+]i) in HSCs via NAADP and/or cADPR production, ECM protein accumulation, and proliferation. We also attempted to elucidate the mechanism of CD38 involvement in Ang II-induced HSC activation and evaluated preventive potential of genetic ablation of CD38 in the development and progression of liver fibrosis in a mouse model induced by bile duct ligation (BDL).
EXPERIMENTAL PROCEDURES
Animals and Materials
All animal experiments and materials were described. C57BL/6J and CD38−/− male mice were purchased from The Jackson Laboratory (Bar Harbor, ME). All animals received humane care in compliance with the guidelines from the Animal Care and Use Committee of Chonbuk National University. Ang II, 8-Br-cADPR, bafilomycin A1, nicotinamide guanine dinucleotide (NGD+), and other chemicals were purchased from Sigma-Aldrich. Xestosphonsin C (XeC) was purchased from Calbiochem, and losartan was purchased from Merck.
Animal Treatments
Liver fibrosis was induced in two-month-old CD38−/− or CD38+/+ male mice by BDL, as described previously (9). Briefly, after a midline laparotomy, the common bile duct was doubly ligated by 4-0 silk and transected between the two ligations. The sham operation was similarly performed except the bile duct was not ligated and transected. Mice were randomized to undergo a BDL or sham operation. Six mice were used in each group. All animals were sacrificed 4 weeks after surgery, and blood and liver samples were obtained.
Serum Biochemical Measurements
Serum alanine aminotransferase, aspartate aminotransferase, and alkaline phosphatase activities were measured using the diagnostic kit (Sigma) following manufacturer's instructions. Their activity was detected on an ultraviolet/visible scanning spectrophotometer (Beckman DU-640, Beckman Instrument, Inc., Fullerton, CA).
Isolation of Mouse Stellate Cells
Mouse hepatic stellate cells were isolated as described previously (8). In brief, livers of 6- to 8-week-old male mice (20–25 g body mass) were perfused first with a Ca2+/Mg2+-free solution (137 mm NaCl, 5.4 mm KCl, 0.6 mm NaH2PO4·2H2O, 0.8 mm Na2HPO4·12H2O, 10 mm Hepes, 0.5 mm EGTA, 4.2 mm NaHCO3, and 5 mm glucose, pH 7.4) at 37 °C and next with 0.015% collagenase A (Roche Applied Science) and 0.1% Pronase E (Roche Applied Science) solution (137 mm NaC1, 5.4 mm KC1, 0.6 mm NaH2PO4·2H2O, 0.8 mm Na2HPO4·12H2O, 3.8 mm CaCl2, 10 mm Hepes, 4.2 mm NaHCO3, pH 7.4) at 37 °C. The digested liver was excised, dispersed in Ca2+/Mg2+-free solution, and filtered through gauzes. Residual hepatocytes were removed twice by a low speed centrifugation (50 × g, 4 °C, 2 min). The nonparenchymal cells were pelleted by centrifugation (450 × g, 4 °C, 10 min). A stellate cell-enriched fraction was obtained by the use of centrifugation with a triple-layered (9, 11, and 17%) Nycodenz cushion (Sigma-Aldrich, 1,400 × g, 4 °C, 20 min). The cells in the upper layer were washed by centrifugation (450 × g, 4 °C, 10 min) and suspended in Dulbecco's modified Eagle's medium (Invitrogen) supplemented with 10% fetal calf serum (Invitrogen) and antibiotics. After plating, the culture medium was changed every other day.
[3H]Thymidine Incorporation Assay
DNA synthesis was measured by the incorporation of methyl-[3H]thymidine (Amersham Biosciences) as described previously (19). Before measuring the incorporation, HSCs were pretreated with 8-Br-cADPR or losartan for 30 min and then incubated with Ang II for 24 h. HSCs were then incubated in the same medium with 1.0 μCi/ml [3H]thymidine for 6 h at 37 °C. The cells were then washed once with phosphate-buffered saline treated with ice-cold 5% trichloroacetic acid at 4 °C for 15 min, and then washed twice in 5% trichloroacetic acid. The acid-insoluble material was dissolved in 2 n NaOH at room temperature and counted for radioactivity by liquid scintillation counting. All experiments were performed in triplicate.
Immunoblotting
Whole-cell extracts and liver extracts were prepared as described previously (19). Proteins (20 μg/lane) were resolved on 8 or 12% SDS-PAGE gel and transferred to polyvinylidine difluoride membranes (GE Healthcare). Antibodies against α-SMA (DakoCytomation, Carpentaria, CA), TGF-β1, collagen αI(1) (Col-I), and fibronectin (Santa Cruz Biotechnology, Santa Cruz, CA) were used. Horseradish peroxide-conjugated secondary antibodies (Santa Cruz Biotechnology) were used and visualized using enhanced chemiluminescence. All immunoreactive signals were analyzed by densitometric scanning (Fuji Photo Film Co., Tokyo, Japan).
Measurement of [Ca2+]i
The measurement method is described. Changes of [Ca2+]i in HSCs were determined as described previously (20). HSCs grown to near confluence were made quiescent by serum deprivation overnight at 37 °C. Serum-starved cells were incubated with 5 μm Fluo-3 AM (Molecular Probes) in Hank's balanced salt solution (2 mm CaCl2, 145 mm NaCl, 5 mm KCl, 1 mm MgCl2, 5 mm d-glucose, and 20 mm HEPES, pH 7.3) at 37 °C for 40 min. The cells were washed three times with Hank's balanced salt solution. Changes of [Ca2+]i were determined at 488 nm excitation/530 nm emission by air-cooled argon laser system. The emitted fluorescence at 530 nm was collected using a photomultiplier. The image was scanned using a confocal microscope (Nikon). For the calculation of [Ca2+]i, the method of Tsien et al. (21) was used with the following equation: [Ca2+]i = Kd(F − Fmin)/(Fmax − F), where Kd is 450 nm for fluo-3, and F is the observed fluorescence level. Each tracing was calibrated for the maximal intensity (Fmax) by addition of ionomycin (8 μm) and for the minimal intensity (Fmin) by addition of EGTA 50 mm at the end of each measurement.
Measurement of Intracellular cADPR Concentration
The sample extraction was performed as described previously (20, 21). cADPR was measured by some modification of the cycling method described previously (20). Briefly, cells were treated with 0.3 ml of 0.6 m-perchloric acid under sonication. Precipitates were removed by centrifugation at 20,000 × g for 10 min. Perchloric acid was removed by mixing the aqueous sample with a solution containing 3 volumes of 1,1,2-trichlorotrifluoroethane to 1 volume of tri-n-octylamine. After centrifugation for 10 min at 1,500 × g, the aqueous layer was collected and neutralized with 20 mm sodium phosphate pH 8.0. To remove all contaminating nucleotides, the samples were incubated with the following hydrolytic enzymes overnight at 37 °C: 0.44 unit/ml nucleotide pyrophosphatase, 12.5 units/ml alkaline phosphatase, 0.0625 units/ml NAD glycohydrolase, and 2.5 mm MgCl2 in 20 mm sodium phosphate buffer, pH 8.0. Enzymes were removed by filtration using a Centricon-3 filter (Amicon). To convert cADPR to β-NAD+, the samples (0.1 ml/tube) were incubated with 50 μl of cycling reagent containing 0.3 μg/ml Aplysia ADP-ribosyl cyclase, 30 mm nicotinamide, and 100 mm sodium phosphate, pH 8.0, at room temperature for 30 min. The samples were further incubated with the cycling reagent (0.1 ml) containing 2% ethanol, 100 μg/ml alcohol dehydrogenase, 20 μm resazurin, 10 μg/ml diaphorase, 10 μm riboflavin 5′-phosphate, 10 mm nicotinamide, 0.1 mg/ml BSA, and 100 mm sodium phosphate, pH 8.0, at room temperature for 2 h. An increase in the resorufin fluorescence was measured at an excitation of 544 nm and an emission of 590 nm using a SpectraMax gemini fluorescence plate reader (Molecular Devices Corp.). Various known concentrations of cADPR were also included in the cycling reaction to generate a standard curve.
Measurement of Intracellular NAADP Concentration
The level of NAADP was measured using a cyclic enzymatic assay as described previously (21).
Measurement of IP3
Intracellular IP3 was measured as described previously (22). Briefly, HSCs were incubated with [3H]inositol (PerkinElmer Life Sciences, 0.4 μCi/ml) in inositol-free Dulbecco's modified Eagle's medium for 40–48 h. Prior to assay, the medium was removed and the cells were incubated in phosphate-buffered saline containing 10 mm lithium for 10 min. The assay was initiated by the addition of test compounds and terminated after incubation at 37 °C for 20 min by the addition of 1 ml of ch1oroform:methanol:HCl (100:200:2). To separate the phases, 0.3 ml each of chloroform and 0.1 n HCl were added. The aqueous phase was subjected to chromatography on Dowex AG 1-X8 (formate form). Total inositol phosphates (sum of inositol monophosphate, inositol bisphosphate, and inositol trisphosphate) were eluted.
Histological Analysis
Formalin-fixed liver tissues were decalcified in EDTA for 5–7 days, dehydrated, and embedded in paraffin. Serial sections (4 μm) were stained with hematoxylin-eosin. The extent of inflammation was evaluated on blinded slides by digital images using a computer-assisted color image analyzer (LUZEX F, Nikon, Tokyo, Japan).
Immunohistochemistry
Tissue sections were cut and placed on glass slides, deparaffinized with xylene, and rehydrated with graded ethanol. Endogenous peroxidase was blocked with 3% hydrogen peroxide for 20 min, and slides were rinsed with phosphate-buffered saline. After protein blocking, slides were incubated overnight at 4 °C with a primary antibody for α-SMA (1:100; DakoCytomation). The stained sections were then incubated with biotinylated secondary antibody (DakoCytomation), and the immune complexes were detected using an ABC kit according to manufacturer's instructions. The sections were finally counterstained with hematoxylin before mounting. The area of positive staining was determined by computerized image analysis (LUZEX F, Nikon).
Statistical Analysis
Data represent means ± S.E. of at least three separate experiments. Statistical comparisons were performed using one-way analysis of variance followed by Scheffe's test. Statistical significance of difference between groups was determined using Student's t test. Differences were considered significant if the p value was <0.05.
RESULTS
Ang II-mediated cADPR Production by CD38 Is Essential in HSC Activation, Proliferation, and ECM Protein Accumulation
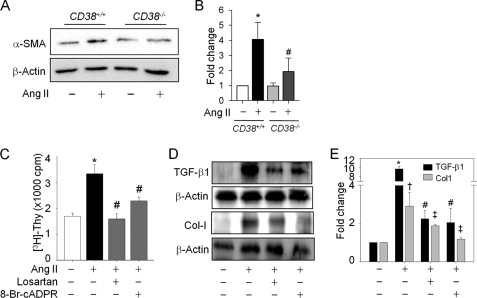
Because α-SMA is a sensitive marker of activated HSCs in situ, it has increasingly been used as an early indicator of fibrogenetic activity in human liver disease, even before ECM accumulates (23). To elucidate a possibility of an association between CD38 and HSC activation in liver fibrosis, we compared the α-SMA expression in HSCs isolated from CD38+/+ and CD38−/− mice after 48 h of treatment with Ang II. As seen in Fig. 1, A and B, the increase of α-SMA protein in CD38−/− HSCs in response to Ang II was consistently lower than in CD38+/+ HSCs. Treatment of HSCs with Ang II stimulated proliferative responses as demonstrated by an increase in [3H]thymidine uptake (Fig. 1C). Pretreatment of HSCs for 30 min with 8-Br-cADPR, an antagonistic analog of cADPR, significantly inhibited Ang II-induced DNA synthesis. We also confirmed the inhibitory effect of losartan, an Ang II type 1 receptor blocker, on HSCs proliferation. Ang II treatment up-regulated TGF-β1 and Col-I levels and that these up-regulations were abrogated by pretreatment of HSCs with 8-BrcADPR or losartan (Fig. 1, D and E).
FIGURE 1.
Ang II-induced CD38 activation is the main mediator of HSC activation, proliferation, and collagen αI(1) expression. A, expression of α-SMA in CD38+/+ or CD38−/− HSCs after Ang II (100 nm) treatment for 48 h. β-Actin was used to evaluate equal protein loading. B, relative expression of α-SMA expression is arbitrarily presented. *, p < 0.001 versus control in CD38+/+ HSCs; #, p < 0.01 versus Ang II in CD38+/+ HSCs. C, Ang II-induced DNA synthesis was blocked by losartan (10 μm) and 8-Br-cADPR (100 μm) pretreatment. HSCs were treated with Ang II (100 nm) for 48 h after pretreatment of each inhibitor. *, p < 0.001 versus control; #, p < 0.01 versus Ang II. D and E, TGF-β1 and Col-I expression were changed in response to Ang II in the presence of losartan and 8-Br-cADPR. *, p < 0.001 versus control; #, p < 0.05 versus Ang II. Values are means ± S.E. of three independent experiments. Thy, thymidine; cpm, counts per minutes.
CD38 Ablation Attenuates Ang II-induced Sustained Intracellular Ca2+ Increases in HSCs
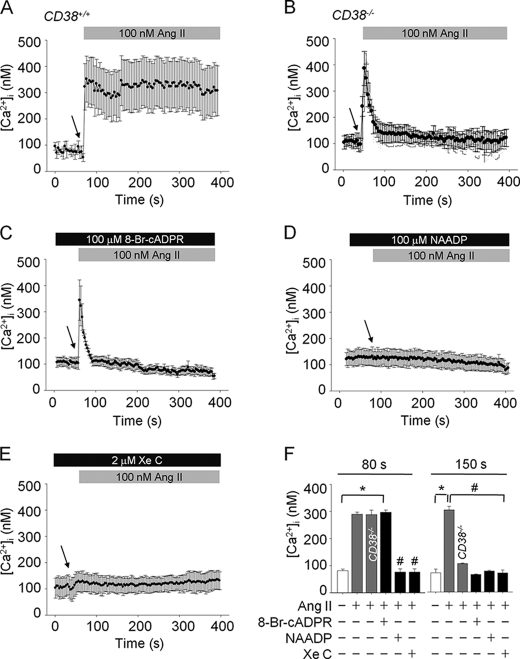
To explore the role of CD38 in Ang II-mediated Ca2+ signaling in HSCs, we compared Ca2+ signaling in HSCs from CD38+/+ and CD38−/− mice. Ang II evoked sustained intracellular Ca2+ increase in CD38+/+ HSCs; however, the later phase of sustained Ca2+ signal was not detected in the Ang II-treated HSCs from CD38−/− mice (Fig. 2, A and B). Pretreatment of HSCs with 8-Br-cADPR blocked the sustained Ca2+ increase, similar to that shown in CD38−/− HSCs (Fig. 2C), suggesting that Ang II-mediated long lasting Ca2+ signaling in HSCs is due to the action of cADPR. Pretreatment of HSCs with high concentration of NAADP or XeC, an IP3R blocker, led to a complete blockade of the Ang II-induced intracellular Ca2+ response, including initial Ca2+ transient in HSCs (Fig. 2, D and E). Thus, the Ang II-mediated Ca2+ signal in HSCs consists of two phases of Ca2+ signals; initial Ca2+ transient is dependent on both IP3 and NAADP, whereas later sustained Ca2+ signal on cADPR (Fig. 2F).
FIGURE 2.
Ang II-evoked [Ca2+]i rise is mediated by IP3/NAADP/cADPR. A, increases of [Ca2+]i by Ang II in CD38+/+ HSCs. B, the later phase of [Ca2+]i was abolished in CD38−/− HSCs by Ang II. C, Ang II-mediated sustained [Ca2+]i increases were inhibited by pretreatment with 8-Br-cADPR (100 μm). D and E, pretreatment of HSCs with NAADP (100 μm) and XeC (2 μm) completely blocked Ang II-induced [Ca2+]i. F, changes in [Ca2+]i at 80 and 150 s. *, p < 0.001 versus basal [Ca2+]i; #, p < 0.05 versus Ang II. Values are means ± S.E. of three independent experiments. The arrow indicates the time of Ang II addition.
Ang II Stimulates cADPR Production following NAADP Production in HSCs
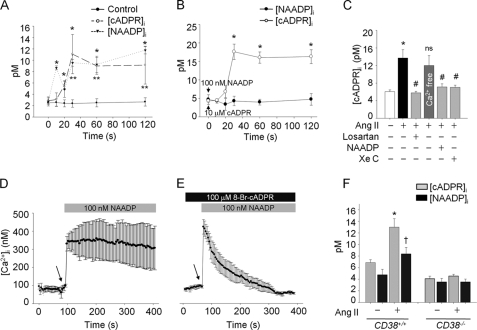
To elucidate whether cADPR and NAADP are produced in Ang II-treated HSCs, we measured intracellular cADPR or NAADP concentrations before and after treatment of HSCs with Ang II. As shown in Fig. 3A, NAADP was produced ∼10 s earlier than cADPR with its initial peak at 10 s following Ang II treatment, and the levels of NAADP and cADPR were sustained with similar patterns until 120 s. Moreover, exogenous NAADP evoked cADPR production directly in HSCs, whereas exogenous cADPR did not induce NAADP production (Fig. 3B), indicating that NAADP-mediated initial Ca2+ increase is required for cADPR production. Ang II-mediated cADPR production was blocked by pretreatment of the cells with high concentrations of NAADP, XeC, and losartan, but not by the Ca2+-free condition (Fig. 3C). Therefore, it is highly likely that exogenous NAADP could induce a Ca2+ signal similar to that of Ang II-mediated Ca2+ increase in HSCs. Indeed, NAADP was found to elicit a Ca2+ increase similar to that of Ang II-treated HSCs (Fig. 3D). Pretreatment of HSCs with 8-Br-cADPR blocked the NAADP-induced late phase of long-lasting Ca2+ increase, but not initial Ca2+ signal (Fig. 3E). Next, we examined whether Ang II-induced cADPR or NAADP production in HSCs is due to CD38, and therefore, we compared cADPR and NAADP production in HSCs from CD38+/+ and CD38−/− mice before and after treatment with Ang II. HSCs from CD38−/− mice did not produce cADPR as well as NAADP in response to Ang II (Fig. 3F), indicating that CD38 is responsible for the production of cADPR and NAADP HSCs in response to Ang II.
FIGURE 3.
NAADP-induced [Ca2+]i stimulates cADPR production by Ang II in HSCs. A, kinetics of cADPR and NAADP production by Ang II in CD38+/+ HSCs. *, p < 0.05 versus basal intracellular cADPR concentration ([cADPR]i); **, p < 0.05 versus basal intracellular NAADP concentration ([NAADP]i). B, exogenous cADPR0-mediated (10 μm) or NAADP-mediated (100 nm) [NAADP]i or [cADPR]i increase in CD38+/+ HSCs is presented in a time course. *, p < 0.01 versus basal [cADPR]i. C, Ang II-mediated cADPR production was inhibited by losartan, XeC, and a high concentration of NAADP, but not in the absence of extracelluar Ca2+. D, NAADP-induced (100 nm) increase of [Ca2+]i in HSCs. E, NAADP-evoked sustained Ca2+ increase was abolished in the presence of 8-Br-cADPR. F, Ang II-stimulated cADPR or NAADP production was measured in CD38−/− HSCs. *, p < 0.001 versus basal [cADPR]i; †, p < 0.05 versus basal [NAADP]i. Values are means ± S.E. of three independent experiments.
Characterization of the Ang II-induced Initial Phase of Ca2+ Signals in HSCs
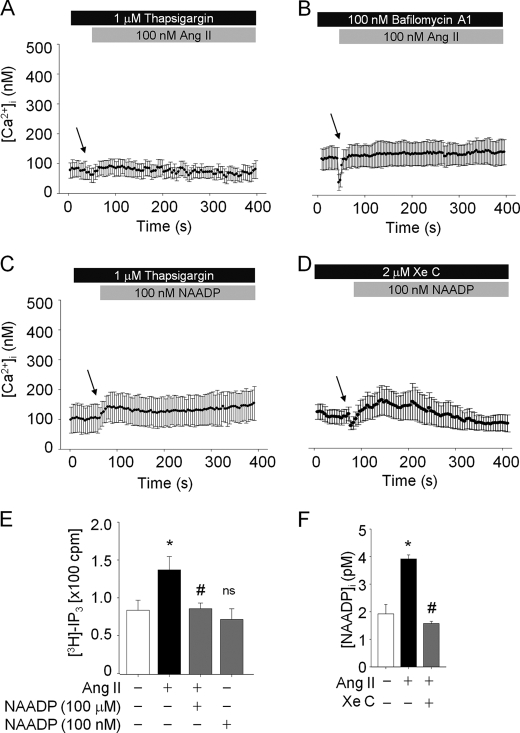
Figs. 2 and 3 show that NAADP and IP3 contributed to initial phase of Ca2+ increase and cADPR formation in the Ang II-treated HSCs. When the Ca2+ pool in the ER was emptied by inhibiting the sarcoplasmic/endoplasmic reticulum Ca2+ ATPase pumps with thapsigargin, the Ang II-induced Ca2+ increase was not detected (Fig. 4A). In addition, bafilomycin A1, which is known to block the vacuolar H+ ATPase (24), also completely prevented Ang II-mediated Ca2+ increases (Fig. 4B). Fig. 4, C and D show that the NAADP-evoked Ca2+ response was blocked by pretreatment of the cells with thapsigargin as well as XeC. These findings suggest that the NAADP-mediated Ca2+ signal requires IP3-induced Ca2+ release from ER, and the IP3-mediated Ca2+ signal requires NAADP-induced Ca2+ release from the acidic store. Therefore, we tested the effect of a high concentration of NAADP on Ang II-mediated intracellular IP3 production and the effect of IP3R blocker on NAADP formation induced by Ang II. After pretreatment with a high concentration of NAADP for 30 min, Ang II was unable to induce intracellular IP3 increase (Fig. 4E). Furthermore, in the presence of IP3R blocker, Ang II did not induce NAADP production in HSCs (Fig. 4F). These data indicate that Ang II-mediated IP3 production can be affected by NAADP-induced Ca2+ increase and that Ang II-mediated NAADP production depends also on IP3-mediated Ca2+ release in HSCs. Taken together, these results suggest that NAADP and IP3-elicited Ca2+ releases from the acidic organelles and ER Ca2+ stores, respectively, have a cross-talk in the Ang II-mediated Ca2+ signals in HSCs.
FIGURE 4.
NAADP- or IP3-induced Ca2+ signals closely interact in Ang II-mediated mechanism. A and B, thapsigargin and bafilomycin A1 abolished Ang II-evoked Ca2+ increase. C and D, NAADP failed to increase [Ca2+]i in the presence of thapsigargin and XeC. E, Ang II-stimulated IP3 synthesis was blocked in the presence of a high concentration of NAADP (100 μm). Exogenous NAADP (100 nm) did not affect IP3 production. High concentration of NAADP (100 μm) was preincubated prior to Ang II treatment. Ang II (100 nm) or NAADP (100 nm) was treated for 15 s. *, p < 0.01 versus basal [3H]-IP3; #, p < 0.05 versus Ang II. F, Ang II-induced NAADP production was inhibited by XeC pretreatment. *, p < 0.01 versus basal [NAADP]i; #, p < 0.01 versus Ang II; ns, non-significant. Values are means ± S.E. of three independent experiments.
Liver Fibrosis Is Markedly Attenuated in CD38−/− Mice after BDL
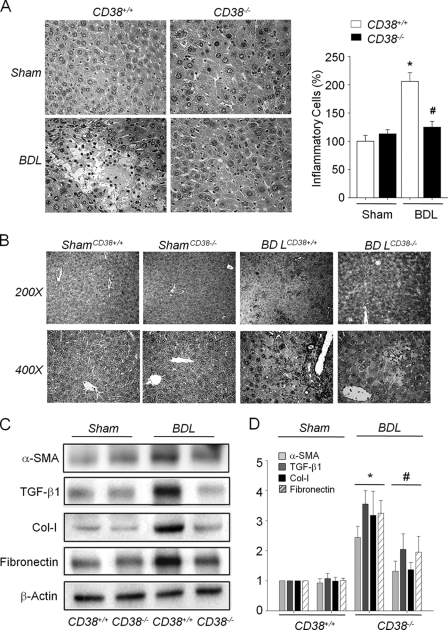
Because blockade of the Ang II receptor has been previously reported to attenuate BDL-induced hepatic fibrosis and our present findings showed that Ang II receptor signaling in HSCs was mediated by CD38, we examined the role of CD38 played in liver fibrosis, by applying the BDL-induced fibrosis model in CD38+/+ and CD38−/− mice. Following BDL for 4 weeks, the degree of liver injury was attenuated in CD38−/− mice, as demonstrated by lower serum liver enzymes levels (Table 1) and lower hepatocytes necrosis and inflammatory cell infiltration than those in CD38+/+ mice (Fig. 5A). Because α-SMA is primarily responsible for the overproduction of ECM at pathogenic conditions and also indicates HSC activation, we investigated the activation of HSCs by assessing the expression after BDL. Fig. 5B illustrates the expression of hepatic α-SMA protein in sham and BDL livers of CD38+/+ and CD38−/− mice. Compared with sham controls, α-SMA expression in the BDL-CD38+/+ mice liver was markedly increased, suggesting the activation of hepatic myofibroblasts following BDL-induced injury. However, the induction of α-SMA in the ligated CD38−/− mice liver was largely blocked (Fig. 5B). This was validated by Western blot analysis of α-SMA protein (Fig. 5, C and D). Hepatic expression of TGFβ-1, Col-I, and fibronectin in BDL-CD38−/− mice was significantly attenuated compared with that in CD38+/+ mice (Fig. 5, C and D). These results indicate that CD38 is an important mediator in liver fibrosis.
TABLE 1.
Comparison of liver enzymes in bile duct-ligated CD38+/+ and CD38−/− mice
| Sham |
BDL |
|||
|---|---|---|---|---|
| CD38+/+ | CD38−/− | CD38+/+ | CD38−/− | |
| ALT (U/L)a | 30.56 ± 6.43 | 30.64 ± 3.33 | 347.98 ± 66.94b | 290.20 ± 34.11 |
| AST (U/L) | 72.81 ± 10.56 | 76.96 ± 6.74 | 282.07 ± 58.20b | 180.10 ± 43.68c |
| ALP (U/L) | 50.00 ± 3.96 | 48.92 ± 5.94 | 141.64 ± 13.68b | 110.07 ± 7.90c |
aALT, alanine aminotransferase; AST, aspartate aminotransferase; ALP, alkaline phosphatase; U/L, units per liter.
bp < 0.01 compared with the sham-operated CD38+/+ mice group.
c p < 0.05 compared with the bile duct-ligated CD38+/+ mice group. Values are means ± S.E.
FIGURE 5.
Genetic ablation of CD38 attenuates BDL-induced liver fibrosis. A, hematoxylin and eosin staining of liver specimens. BDL-induced necrosis and inflammatory cell infiltration in the liver of CD38+/+ and CD38−/− mice (original magnification ×400). Quantification of inflammatory cells in liver specimens. 25 fields (×400) were studied in each liver sample. *, p < 0.01 versus in sham-operated CD38+/+ mice liver. #, p < 0.05 versus bile duct-ligated CD38+/+ mice liver. B, immunohistochemical examination of α-SMA expression in livers of CD38+/+ and CD38−/− mice (original magnification ×200 on upper panel and ×400 on lower panel). C, comparison of expression of α-SMA, TGF-β1, Col-I, and fibronectin in the livers from CD38+/+ and CD38−/− mice following BDL. D, relative expression of each protein compared with β-actin. *, p < 0.01 versus in sham-operated CD38+/+ mice. #, p < 0.05 versus bile duct-ligated CD38+/+ mice. Values are means ± S.E. of three independent experiments.
DISCUSSION
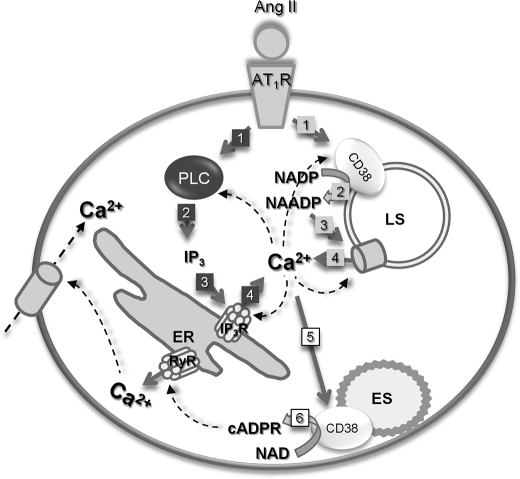
A recent study documented CD38 as a regulator of activation and effector functions of HSCs (18). CD38-immunopositive HSCs were found to increase following the progression of hepatic fibrosis, which was shown in liver biopsies from patients with chronic liver disease (25). CD38 is one of the ADP-ribosyl cyclases, a family of multifunctional enzymes that are seemingly ubiquitous in eukaryotic cells, and ADP-ribosyl cyclases play a key role in several physiological processes, including cell proliferation, muscle contraction, stem cell regeneration, and hormone secretion (17). We previously reported activation mechanisms of Ang II-mediated ADP-ribosyl cyclase in mouse mesangial cells or adult rat cardiomyocytes (19, 26) and also showed that ADP-ribosyl cyclase inhibitions could provide a protective effect on chronic renal and cardiac failure (27, 28). In the present study, we proposed a link between Ang II and CD38 activation during liver fibrosis and presented evidence that Ang II induces fibrogenic actions through CD38 activation in activated HSCs. Our present results showed that the profibrogenic effect of Ang II is associated with an increased concentration of TGF-β1. Previous studies have demonstrated that Ang II induces the expression of TGF-β1 (29, 30) and that TGF-β1 has powerful fibrogenic action. By using cADPR antagonistic analogs, several laboratories have shown that cADPR regulates numerous Ca2+ signaling pathways in plants, invertebrates, and vertebrates (13, 31). Our present data revealed that treatment of HSCs with 8-Br-cADPR inhibited Ang II-mediated expression of TGF-β1, Col-I deposition, and cell proliferation. Furthermore, Ang II-mediated sustained Ca2+ increase was not observed in CD38−/− HSCs as well as in HSCs pretreated with 8-Br-cADPR, indicating that CD38-mediated Ca2+ signals regulate HSC activation, proliferation, and ECM accumulation. The present study identified an Ang II-evoked Ca2+ signaling in HSCs with a complex pattern of Ca2+ spiking induced by NAADP and IP3. The Ang II-mediated initial phase of Ca2+ increase was abolished completely by either a high concentration of NAADP (100 μm), which is used to desensitize NAADP receptors (32) or by XeC, an IP3R blocker. Furthermore, NAADP (100 nm)-induced Ca2+ signals as well as Ang II-induced NAADP production were blocked by XeC pretreatment. These data together with the result that NAADP-induced Ca2+ increase was abolished by pretreatment with thapsigargin indicate that NAADP-induced Ca2+ signals require ER Ca2+ stores and IP3 production. Interestingly, pretreatment with bafilomycin A1 also completely blocked Ang II-mediated Ca2+ signals in HSCs, and Ang II in the presence of a high NAADP concentration failed to evoke IP3 production, suggesting that IP3R-mediated Ca2+ release is also dependent on NAADP-sensitive store and NAADP production. Taken together, we hypothesize that the Ang II-mediated initial phase of Ca2+ signals may arise through a combination of cross-talk between Ca2+ release from ER or acidic organelles, like Ca2+-induced Ca2+ release and a close network between CD38 and PLC activation for the production of NAADP or IP3 (Fig. 6). In the Ang II-treated HSCs, as we have demonstrated in other cells, cADPR was responsible for the later sustained Ca2+ rises. Moreover, IP3- as well as NAADP-induced initial Ca2+ transients were prerequisite for the production of cADPR because cADPR production was dependent on NAADP- as well as IP3-induced Ca2+ increase. In summary, the current study explored the CD38 activation mechanisms by Ang II, which exerts fibrogenic effects in HSCs. We have demonstrated that activated CD38 modulates cell activation, proliferation, TGF-β1 expression, and collagen synthesis. Furthermore, we assessed the role of CD38 in liver fibrogenesis by applying BDL to CD38−/− mice because Ang II is secreted by activated HSCs, and the renin-angiotensin system is overexpressed in bile duct-ligated livers (33). Our data showed a remarkable preservation of the hepatic architecture and less fibrosis and reduced expression of α-SMA, TGF-β1, Col-I, and fibronectin following BDL in CD38−/− mice, compared with CD38+/+. These in vivo results indicate that CD38 plays a crucial role in liver fibrosis.
FIGURE 6.
Proposed schematic model of CD38 activation mechanism in HSCs; in HSCs, Ang II binds to the Ang II type 1 receptor and signals to activate CD38 and PLC. Activated CD38 produces NAADP, which, in turn, stimulates Ca2+ release from acidic organelles. IP3, a product of PLC, also evokes Ca2+ release from ER. Activations of CD38 and PLC are most likely interdependent on each Ca2+ signals, which, in turn, stimulate cADPR production. The numbers denote sequence of events. ES, endosome; LS, lysosome; IP3R, IP3 receptor; PLC, phospholipase C; RyR, ryanodine receptor.
This work was supported by a grant of the Korea Healthcare Technology R&D Project, Ministry for Health, Welfare & Family Affairs, Republic of Korea (A090476; to U.-H. K.).
- HSC
- hepatic stellate cell
- Ang II
- angiotensin II
- HCS
- hepatic stellate cells
- cADPR
- cyclic ADP-ribose
- NAADP
- nicotinic acid adenine dinucleotide phosphate
- IP3
- inositol 1,4,5-trisphosphate
- BDL
- bile duct ligation
- α-SMA
- α-smooth muscle actin
- TGF-β1
- transforming growth factor β1
- ECM
- extracellular matrix
- ER
- endoplasmic reticulum
- Col-I
- collagen αI(1)
- Br
- bromo.
REFERENCES
- 1.Bataller R., Brenner D. A. (2001) Semin. Liver Dis. 21, 437–451 [DOI] [PubMed] [Google Scholar]
- 2.Bataller R., Brenner D. A. (2005) J. Clin. Invest. 115, 209–218 [DOI] [PMC free article] [PubMed] [Google Scholar]
- 3.Mao T. K., Kimura Y., Kenny T. P., Branchi A., Gishi R. G., Van de Water J., Kung H. J., Friedman S. L., Gershwin M. E. (2002) Autoimmunity 35, 521–529 [DOI] [PubMed] [Google Scholar]
- 4.Breitkopf K., Roeyen C., Sawitza I., Wickert L., Floege J., Gressner A. M. (2005) Cytokine 31, 349–357 [DOI] [PubMed] [Google Scholar]
- 5.Marra F., DeFranco R., Grappone C., Milani S., Pinzani M., Pellegrini G., Laffi G., Gentilini P. (1998) Hepatology 27, 462–471 [DOI] [PubMed] [Google Scholar]
- 6.Bataller R., Sancho-Bru P., Ginès P., Lora J. M., Al-Garawi A., Solé M., Colmenero J., Nicolás J. M., Jiménez W., Weich N., Gutiérrez-Ramos J. C., Arroyo V., Rodés J. (2003) Gastroenterology 125, 117–125 [DOI] [PubMed] [Google Scholar]
- 7.Yokohama S., Yoneda M., Haneda M., Okamoto S., Okada M., Aso K., Hasegawa T., Tokusashi Y., Miyokawa N., Nakamura K. (2004) Hepatology 40, 1222–1225 [DOI] [PubMed] [Google Scholar]
- 8.Yoshiji H., Kuriyama S., Yoshii J., Ikenaka Y., Noguchi R., Nakatani T., Tsujinoue H., Fukui H. (2001) Hepatology 34, 745–750 [DOI] [PubMed] [Google Scholar]
- 9.Kurikawa N., Suga M., Kuroda S., Yamada K., Ishikawa H. (2003) Br. J. Pharmacol. 139, 1085–1094 [DOI] [PMC free article] [PubMed] [Google Scholar]
- 10.Pozzan T., Rizzuto R., Volpe P., Meldolesi J. (1994) Physiol. Rev. 74, 595–636 [DOI] [PubMed] [Google Scholar]
- 11.da Silva C. P., Guse A. H. (2000) Biochim. Biophys. Acta 1498, 122–133 [DOI] [PubMed] [Google Scholar]
- 12.Churchill G. C., Okada Y., Thomas J. M., Genazzani A. A., Patel S., Galione A. (2002) Cell 111, 703–708 [DOI] [PubMed] [Google Scholar]
- 13.Lee H. C. (1997) Physiol. Rev. 77, 1133–1164 [DOI] [PubMed] [Google Scholar]
- 14.Foskett J. K., White C., Cheung K. H., Mak D. O. (2007) Physiol. Rev. 87, 593–658 [DOI] [PMC free article] [PubMed] [Google Scholar]
- 15.Calcraft P. J., Ruas M., Pan Z., Cheng X., Arredouani A., Hao X., Tang J., Rietdorf K., Teboul L., Chuang K. T., Lin P., Xiao R., Wang C., Zhu Y., Lin Y., Wyatt C. N., Parrington J., Ma J., Evans A. M., Galione A., Zhu M. X. (2009) Nature 459, 596–600 [DOI] [PMC free article] [PubMed] [Google Scholar]
- 16.Guse A. H., Lee H. C. (2008) Sci. Signal 1, re10. [DOI] [PubMed] [Google Scholar]
- 17.Malavasi F., Deaglio S., Funaro A., Ferrero E., Horenstein A. L., Ortolan E., Vaisitti T., Aydin S. (2008) Physiol. Rev. 88, 841–886 [DOI] [PubMed] [Google Scholar]
- 18.March S., Graupera M., Sarrias M. R., Lozano F., Pizcueta P., Bosch J., Engel P. (2007) Am. J. Pathol. 170, 176–187 [DOI] [PMC free article] [PubMed] [Google Scholar]
- 19.Kim S. Y., Gul R., Rah S. Y., Kim S. H., Park S. K., Im M. J., Kwon H. J., Kim U. H. (2008) Am. J. Physiol. Renal. Physiol. 294, F982–F989 [DOI] [PubMed] [Google Scholar]
- 20.Graeff R., Lee H. C. (2002) Biochem. J. 361, 379–384 [DOI] [PMC free article] [PubMed] [Google Scholar]
- 21.Gasser A., Bruhn S., Guse A. H. (2006) J. Biol. Chem. 281, 16906–16913 [DOI] [PubMed] [Google Scholar]
- 22.Kim U. H., Fink D., Jr., Kim H. S., Park D. J., Contreras M. L., Guroff G., Rhee S. G. (1991) J. Biol. Chem. 266, 1359–1362 [PubMed] [Google Scholar]
- 23.Russo M. W., Firpi R. J., Nelson D. R., Schoonhoven R., Shrestha R., Fried M. W. (2005) Liver Transplant. 11, 1235–1241 [DOI] [PubMed] [Google Scholar]
- 24.Bowman E. J., Siebers A., Altendorf K. (1988) Proc. Natl. Acad. Sci. U.S.A. 85, 7972–7976 [DOI] [PMC free article] [PubMed] [Google Scholar]
- 25.Abdeen S. M., Olusi S. O., Askar H. A., Thalib L., Al-Azemi A., George S. (2009) Acta Histochem. 111, 520–530 [DOI] [PubMed] [Google Scholar]
- 26.Gul R., Kim S. Y., Park K. H., Kim B. J., Kim S. J., Im M. J., Kim U. H. (2008) Am. J. Physiol. Heart Circ. Physiol. 295, H77–H88 [DOI] [PubMed] [Google Scholar]
- 27.Kim S. Y., Park K. H., Gul R., Jang K. Y., Kim U. H. (2009) Am. J. Physiol. Renal Physiol. 296, F291–F297 [DOI] [PubMed] [Google Scholar]
- 28.Gul R., Park J. H., Kim S. Y., Jang K. Y., Chae J. K., Ko J. K., Kim U. H. (2009) Cardiovasc. Res. 81, 582–591 [DOI] [PubMed] [Google Scholar]
- 29.Castilla A., Prieto J., Fausto N. (1991) N. Eng. J. Med. 324, 933–940 [DOI] [PubMed] [Google Scholar]
- 30.Gressner A. M., Weiskirchen R., Breitkopf K., Dooley S. (2002) Front. Biosci. 7, d793–807 [DOI] [PubMed] [Google Scholar]
- 31.Potter B. V., Walseth T. F. (2004) Curr. Mol. Med. 4, 303–311 [DOI] [PubMed] [Google Scholar]
- 32.Aarhus R., Dickey D. M., Graeff R. M., Gee K. R., Walseth T. F., Lee H. C. (1996) J. Biol. Chem. 271, 8513–8516 [DOI] [PubMed] [Google Scholar]
- 33.Paizis G., Cooper M. E., Schembri J. M., Tikellis C., Burrell L. M., Angus P. W. (2002) Gastroenterology 123, 1667–1676 [DOI] [PubMed] [Google Scholar]


