Abstract
Reactive oxygen species (ROS) are involved in several cell death processes, including cerebral ischemic injury. We found that glutamate-induced ROS accumulation and the associated cell death in mouse hippocampal cell lines were delayed by pharmacological inhibition of autophagy or lysosomal activity. Glutamate, however, did not stimulate autophagy, which was assessed by a protein marker, LC3, and neither changes in organization of mitochondria nor lysosomal membrane permeabilization were observed. Fluorescent analyses by a redox probe PF-H2TMRos revealed that autophagosomes and/or lysosomes are the major sites for basal ROS generation in addition to mitochondria. Treatments with inhibitors for autophagy and lysosomes decreased their basal ROS production and caused a burst of mitochondrial ROS to be delayed. On the other hand, attenuation of mitochondrial activity by serum depletion or by high cell density culture resulted in the loss of both constitutive ROS production and an ROS burst in mitochondria. Thus, constitutive ROS production within mitochondria and lysosomes enables cells to be susceptible to glutamate-induced oxidative cytotoxicity. Likewise, inhibitors for autophagy and lysosomes reduced neural cell death in an ischemia model in rats. We suggest that cell injury during periods of ischemia is regulated by ROS-generating activity in autophagosomes and/or lysosomes as well as in mitochondria.
Introduction
Oxidative stress-induced cell death has been implicated in several diseases and in acute injury such as ischemia. Oxidative stress results from increased levels of reactive oxygen species (ROS),3 which include free radicals such as superoxide and hydroxyl radical, and nonradical species such as hydrogen peroxide (1). Due to their high reactivity, ROS can oxidize cell constituents such as lipids, proteins, and DNA and thus damage cell structures and integrity. In addition to their potentially lethal effects, previous studies have shown that they are implicated in a variety of cell death processes (1). For example, ROS disrupt the integrity of the lysosomes, and this lysosomal membrane permeabilization then triggers caspase-mediated apoptosis or cathepsin-mediated necrotic cell death (2–4). Furthermore, ROS induce cell death associated with autophagosome accumulation (5), and this form of autophagic cell death is activated in the nervous system in response to oxidative stress (6). In mammalian cells, chaperone-mediated autophagy has been shown to act in the degradation of oxidized proteins during oxidative stress (7), and the selective degradation of mitochondria was proposed to decrease the potential oxidative damage from defective mitochondria (8). Thus, autophagy may have a dual role in regulating cell death in response to oxidative stress.
The susceptibility of the brain to oxidative stress may be related to its high oxygen consumption rate, abundant lipid content, and relative paucity of antioxidant enzymes (9). The hippocampal cell line HT22 is an excellent model for studying the mechanism of oxidative glutamate toxicity (10, 11). In this model, glutamate treatment leads to intracellular glutathione depletion and subsequent accumulation of ROS (12). A variety of signaling pathways has been implicated in oxidative toxicity in HT22 cells including arachidonic acid metabolites, protein kinase Cδ, and extracellular signal-regulated kinases-1/2 (ERK1/2) cascade, and calcium (11–16). In addition, the antioxidant agent ebselen, which is effective for neuroprotection against ischemic damage (17) has been shown to inhibit HT22 cell death through the activation of heme oxygenase-1 protein (18).
To determine other pathways or molecules involved in oxidative toxicity, various chemical compounds were evaluated for their ability to protect HT22 cells from death. In this study, we demonstrated that inhibitors for autophagy and/or lysosomes repressed cell death through reduction of basal ROS generation at these compartments. We further showed that these inhibitors were effective for neuroprotection against permanent focal cerebral ischemia in vivo.
EXPERIMENTAL PROCEDURES
Cell Culture and Glutamate Treatment
HT22 cells (19) were cultured in Dulbecco's modified Eagle's medium with 10% fetal bovine serum. For glutamate treatment, cells were plated at 1 × 10⁵ cells per dish on 35-mm dishes and cultured for 24 h. For nutrient starvation, cells were incubated in Krebs-Ringer buffer (118.5 mm NaCl, 4.74 mm KCl, 1.18 mm KH2PO4, 23.4 mm NaHCO3, 6 mm glucose, 2.5 mm CaCl2, 1.18 mm Mg SO4, pH 7.6) at 37 °C for 4 h. Cell death was determined by trypan blue dye exclusion assay as described previously (20).
Inhibitors
Aspartic proteases inhibitor pepstatin A-Me and an inhibitor of c-Jun N-terminal kinase SP600125 were purchased from Calbiochem. LY294002 was from Cayman Chemical. Bafilomycin A1, an inhibitor of vacuolar H+-ATPase, was purchased from Wako (Osaka, Japan). Free radical scavenger MCI-186 was supplied by Mitsubishi Tanabe Pharma (Osaka). All other reagents were purchased from Sigma.
Plasmids
Full-length cDNAs of cation-dependent mannose 6-phosphate receptor and damage-regulated autophagy modulator were generated by PCR using the MIN6 cDNA library as a template and were subcloned into pcDNA3 with EGFP (21). The plasmid of mStrawberry-Atg4B mutant (C74A) was kindly provided by Dr. Yoshimori. All of the subcloned PCR products were directly sequenced. Transfections were performed with Lipofectamine 2000 reagent (Invitrogen), and 75% transfection efficiency was observed with a reporter gene.
Fluorescence Microscopy
The HT22 cells were incubated on poly-l-lysine (Sigma)-coated coverslips in the dark at 37 °C with 5 μm 5-(and-6-)-chloromethyl-2′, 7′-dichlorodihydrofluorescein diacetate (CM-H2DCFDA) for 5 min or with 5 μm PF-H2TMROS (Invitrogen) for 30 min. The cells were mounted on a glass slide with Hanks' buffer. The fluorescence of DCF and PF-TMRos was observed with a LSM5 PASCAL confocal microscope (Carl Zeiss, Jena, Germany), or with an epifluorescence microscope (Olympus BX-50) equipped with a SenSysTM charge-coupled device camera (Photometrics), as described previously (20). To avoid photooxidation of the indicator dye, the fluorescence images were collected by a single rapid scan with identical parameters, such as contrast and brightness, for all samples. The intensity of fluorescence was quantified using ImageJ 1.40 g program (National Institutes of Health). Immunofluorescence analysis was performed as described previously (21).
Western Blot Analysis
Immunoblotting was performed as described previously (21). The blotted membranes were blocked with 2% bovine serum albumin or 5% skim milk for 30 min and were incubated with primary antibodies (1:4000 rabbit anti-LC-3 (MBL, Nagoya, Japan), 1:8000 rabbit anti-catalase (Calbiochem)).
Induction of Focal Cerebral Ischemia
All procedures were performed according to the rules governing animal experimentation and the guidelines for the Care and Use of Laboratory Animals, Gunma University. Male Sprague-Dawley rats (300–350 g) (Charles River, Tsukuba, Japan) were anesthetized with halothane in nitrous oxide-oxygen (70:30), intubated, and artificially ventilated. The femoral artery was cannulated for recording arterial pressure and blood gases. The rats were maintained normotensive, normocapnic, adequately oxygenated, and normothermic during anesthesia. Focal cerebral ischemia was induced using a modification of the permanent middle cerebral artery (MCA) occlusion method (17). Briefly, a 2-cm skin incision was made, and then a small subtemporal craniectomy was made. Cerebral ischemia was induced by electrocoagulation of the MCA from a point proximal to the origin of the lenticulostrate artery to the point crossing the inferior cerebral vein. The MCA was then transected at the olfactory tract to ensure completeness of occlusion.
Drug Treatment to Rats
The rats were randomly divided into four groups and were given MCI-186 (3 mg/kg, n = 7), 3-methyl adenine (3MA) (100 mg/kg, n = 6), bafilomycin A1 (24 μg/kg, n = 7), or vehicle (control group, n = 8). MCI-186 solution (1.5 mg/ml) was injected into the rats via the femoral vein at 20 min after MCA occlusion. 3MA, bafilomycin A1 (dissolved in 5% dimethyl sulfoxide containing phosphate-buffered saline) and phosphate-buffered saline for vehicle were intraperitoneally injected into the rats. During this period, physiological variables were continuously monitored, and rat behavior was carefully observed.
Tissue Processing and Ischemic Damage Assessment
After perfusion with heparinized saline, the brain was quickly and carefully removed, and the forebrain was sliced in eight coronal sections per 2 mm.
Sections were treated with 1% 2,3,5,-triphenyltetrazolium chloride (TTC) solution for 15 min to detect any ischemic damage. TTC-stained sections were delineated on scale diagrams (3.36× actual size) of the forebrain on 8 predetermined coronal planes from anterior 10.50 mm to anterior 1.02 mm. The areas of brain damage were then measured with an image analyzer (Adobe Photoshop software; Adobe Systems) and were integrated using the known distance between each coronal level to determine the total volume of ischemic damage in each specimen.
Statistical Analysis
Parametric data were compared between multiple groups by 1-factor analysis of variance, followed by a Tukey-Kramer test. Data are presented as mean ± S.E. Nonparametric data were compared between the Kruskal-Wallis test, followed by the Steel test.
RESULTS
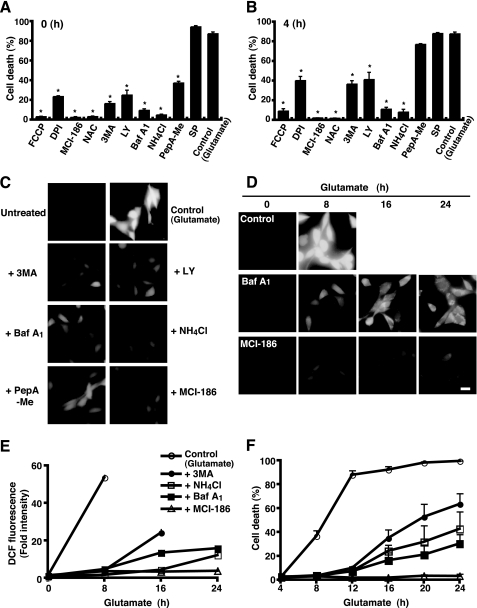
We first examined the effects of a variety of compounds on glutamate-induced oxidative toxicity in the HT22 cells. Treatment of 5 mm glutamate drove 87.3% of cells to death within 12 h, as determined by trypan blue dye exclusion assays. As previously suggested (10, 12, 19), ROS scavengers such as MCI-186 and N-acetylcysteine completely prevented glutamate-induced cell death even when added after glutamate treatment, whereas an inhibitor of NADPH oxidase, diphenylene iodonium chloride, displayed less of an effect (Fig. 1, A and B). Thus, ROS accumulation is essential for the glutamate-induced HT22 cell death. 3MA and LY294002, inhibitors for phosphatidylinositol 3-phosphate kinase, bafilomycin A1 (BafA1), and ammonium chloride (NH4Cl), compounds for neutralizing acidic organelles, also protected cells from glutamate-induced oxidative toxicity (Fig. 1, A and B). When a lysosomal enzyme (aspartic proteases) inhibitor pepstatin A (PepA-Me) was added together with glutamate, a significant amount of protection from cell death was also observed (Fig. 1A). Because 3MA is generally used as an inhibitor for autophagy, these results suggest that autophagic and/or lysosomal activities are involved in the glutamate-induced HT22 cell death.
FIGURE 1.
Lysosome inhibitors delay ROS accumulation and cell death. A and B, HT22 cells were treated with 5 mm glutamate for 12 h, and then cell death was assessed by trypan blue dye exclusion assay. Each inhibitor was added simultaneously (A) or 4 h (B) after the glutamate treatment. Data were shown as the means ± S.E. of four independent experiments. *, p < 0.05; Kruskal-Wallis test followed by Steel test. Carbonyl cyanide p-trifluoromethoxyphenyl-hydrazone (FCCP; 5 μm); diphenyleneiodonium chloride (DPI; 0.5 μm); MCI-186 (0.2 mm); N-acetylcysteine (NAC; 1 mm); 3MA (5 mm); LY294002 (LY; 25 μm); BafA1 (0.4 μm); NH4Cl (15 mm); pepstatin A-Me (PepA-Me; 20 μm); SP, SP600125 (5 μm). C, HT22 cells were treated as in A for 8 h. The cells were incubated in the dark with 5 μm CM-H2DCFDA in Hanks' buffer and generated a DCF fluorescent signal visualized by microscopy with constant fluorescent parameters. Experiments were repeated three times with reproducible results. D, cells were treated with glutamate in the presence or absence of each inhibitor for an indicated time. Intracellular ROS generation was detected as in C. E, for each experiment, a total of 20 cells was unambiguously picked up, and the intensity of DCF fluorescence in each cell was quantified with the densitometric imager. The results from three independent experiments are presented as fold increases ± S.E. compared with time 0. F, cell death rate was determined by trypan blue dye-exclusion assay. Results are the means ± S.E. of three independent experiments. Bar, 20 μm.
Because the glutamate-induced HT22 cell death is accompanied by a rapid burst in mitochondrial ROS production (12), we placed the cells for 8 h in the glutamate culture with or without inhibitors and examined the increase in the fluorescence of an oxidant indicator dye, CM-H2DCF-DA, by fluorescence microscopy. As shown in Fig. 1C, the glutamate culture evoked intense DCF fluorescence. Expectedly, the fluorescence intensity remained at quite a low level in the cells treated by MCI-186. Consistent with their protective effects on cell toxicity, treatments of 3MA, LY, BafA1, or NH4Cl significantly reduced intracellular ROS production, whereas PepA-Me moderately weakened it (Fig. 1C). We further assessed the effects of inhibitors on ROS production and cell death by a time course analysis. As shown in the fluorescent images in Fig. 1D, BafA1 delayed glutamate-induced ROS accumulation, whereas MCI-186 strongly prevented it up to 24 h. Correlated with ROS production, glutamate-induced cell death occurred gradually in BafA1-treated cells (Fig. 1, E and F) (30.3% cell death rate at the 24-h time point), although treatment with BafA1 alone did not show any toxicity on HT22 cells (data not shown). Similar observations were made in cells by other inhibitors such as 3MA and NH4Cl (Fig. 1, E and F). Therefore, inhibitors for autophagy and lysosomes were shown to reduce glutamate-induced HT22 cell death through the retardation of ROS accumulation.
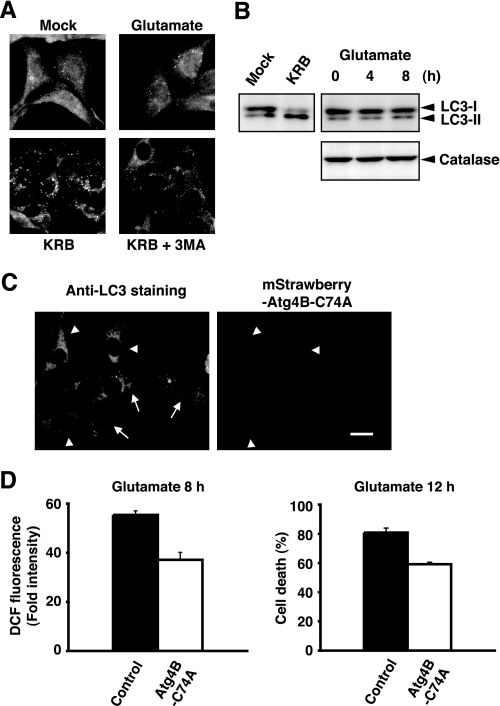
A previous study has shown that glutamate induces a form of cell death including characteristics of both apoptosis and necrosis in HT22 cells (22). Since recent reports demonstrate that various forms of cell death including autophagic cell death are activated in response to oxidative stress (3–6), we examined whether glutamate promotes morphological changes involved in the formation of autophagosomes in dying cells. LC3-II, a lipidated form of LC3, has been shown to be an autophagosomal marker in mammals (23). Immunofluorescence analysis by anti-LC3 antibody revealed that glutamate does not alter LC3 distributions, whereas accumulation of LC3-positive puncta was clearly observed in cells in nutrient starvation conditions (Krebs-Ringer buffer) (Fig. 2A). Notably, some punctate signals were detected even in nonstarved control cells. To observe the processing of LC3 protein during autophagy, forms of LC3-I and LC3-II were then monitored by immunoblotting. The processing of LC3-I to LC3-II was induced by starvation, however glutamate did not affect it up to 8 h (Fig. 2B, upper panel). These data indicate that autophagy is not induced by the glutamate treatment. We next used an inactive mutant of Atg4B protease (Atg4B-C74A) that sequesters LC3 protein and blocks formation of Atg7-LC3 intermediate (24). As previously reported (24), overexpression of mStrawberry-tagged Atg4B-C74A prevented the starvation-induced autophagosome accumulation (Fig. 2C), whereas it slightly decreased LC3-positive speckles in untreated cells (data not shown). Importantly, this mutant protease significantly reduced glutamate-induced ROS accumulation and the associated cell death in HT22 cells (Fig. 2D). These observations suggest that constitutive autophagy is active in HT22 cells, and it appears to be involved in the oxidative cytotoxicity by glutamate.
FIGURE 2.
Autophagy is active in HT22 cells but is not induced by the glutamate treatment. A, HT22 cells were treated with 5 mm glutamate for 8 h or incubated in Krebs-Ringer buffer (KRB) with or without 3MA for 4 h. The cells were fixed and stained with anti-LC3 and Alexa Fluor 488-conjugated anti-rabbit IgG antibodies. B, cells were treated as shown in A for an indicated time. Cell lysates were prepared and subjected to immunoblot analysis for detection of the processed form of LC3 (upper panel). Protein expression level of catalase was analyzed by immunoblotting with anti-catalase antibody (lower panel). C, HT22 cells were transfected with mStrawberry-Atg4B-C74A and were then incubated in Krebs-Ringer buffer. The cells were fixed and stained with anti-LC3 antibody and Alexa Fluor 488-labeled second antibodies (left panel). Arrowheads indicate transfected cells, and arrows show untransfected ones. Bar, 20 μm. D, cells transfected with mStrawberry-Atg4B-C74A or mStrawberry (Control) were treated with 5 mm glutamate. After incubation for 8 h, the cells were incubated in the dark with 5 μm CM-H2DCFDA in Hanks' buffer. Fluorescent signals were observed by microscopy with constant fluorescent parameters, and the intensity of DCF fluorescence in each transfected cell was quantified with the densitometric imager (left panel). The results from three independent experiments are presented as fold increases ± S.E. compared with untreated cells. p < 0.05; Kruskal-Wallis test followed by Steel test. The cell death rate was determined by trypan blue exclusion assay (right panel). Results are the means ± S.E. of three independent experiments. p < 0.05; Kruskal-Wallis test followed by Steel test.
Although autophagic cell death was not detected, constitutive autophagy may regulate ROS production. A previous report has shown that when apoptosis is blocked by caspase inhibitor zVAD, the selective degradation of catalase by autophagy is observed, which then causes ROS accumulation and nonapoptotic cell death (25). The catalase protein levels in HT22 cells were examined by immunoblotting; however, glutamate did not induce any detectable decreases in catalase expression (Fig. 2B, lower panel). We next analyzed morphological changes of lysosomes and mitochondria during glutamate stimulation because recent studies have demonstrated that a kind of oxidative stress causes the destabilization of primary lysosomes (3, 4) and that the selective degradation of mitochondria by autophagy (mitophagy) is observed to defend oxidative stress (8). When cells were incubated with glutamate for 8 h, the fluorescence signals of MitoTracker and LysoSensor were unaltered compared with those in untreated cells (supplemental Fig. S1A). We further observed that glutamate did not affect the fluorescence pattern of acridine orange dye (supplemental Fig. S1, A and B) and immunostaining signals of cathepsin D (data not shown). These results suggest that organization and membrane integrity of lysosomes in HT22 cells are mostly stable during the glutamate treatment.
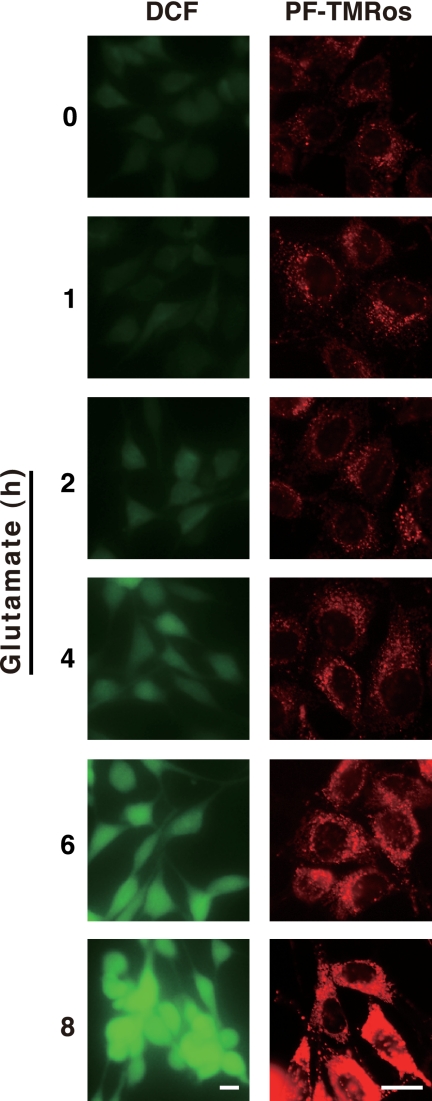
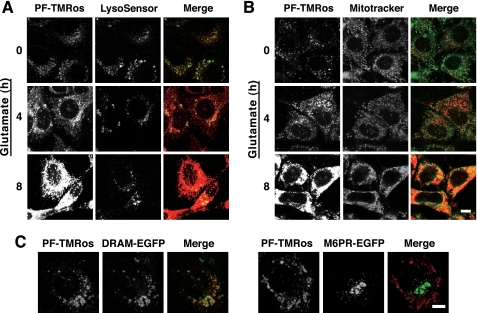
Another fluorescent probe, PF-H2TMRos (also known as RedoxSensor Red CC-1) was next used to analyze the intracellular location of ROS. This probe was demonstrated to detect cellular oxidative activity, and its oxidized product (PF-TMRos) was shown to be distributed in mitochondria and lysosomes (26). We first examined the increased ROS production in glutamate-treated HT22 cells using PF-H2TMRos and compared its fluorescent signals with DCF. Identical to the result by DCF, PF-TMRos red fluorescent signals became prominent at the 4-h point, and the ROS burst was observed at 8 h (Fig. 3). Interestingly, under the basal condition (0 h), weak but apparent signals were detected by PF-TMRos, whereas only faint fluorescence was observed by DCF (Figs. 1 and 3). Intense punctate signals by PF-TMRos were overlapped with the LysoSensor dye (Fig. 4A, time 0), and weak membrane-associated signals seen behind the puncta were colocalized with the fluorescence by MitoTracker green (Fig. 4B, time 0). When HT22 cells were incubated with glutamate, increased signals by PF-TMRos were detected mostly in mitochondria, although the punctate signals were continuously evident (Fig. 4, A and B, 4–8 h). Consistent with the previous study (12), these observations suggest that mitochondria were the main source of massive ROS production that was evoked by the glutamate treatment.
FIGURE 3.
Detection of intracellular ROS generation by two different oxidant probes. HT22 cells were treated with 5 mm glutamate for an indicated time. The cells were incubated with 5 μm CM-H2DCFDA for 5 min or 5 μm PF-H2TMRos for 30 min, and then fluorescent signals of DCF or PF-TMRos were visualized by microscopy with constant fluorescent parameters. Bar, 20 μm.
FIGURE 4.
Analysis of intracellular localization of ROS by a redox sensor PF-H2TMRos. A and B, HT22 cells were treated with 5 mm glutamate for an indicated time. The cells were incubated with 5 μm PF-H2TMRos and 5 nm LysoSensor (A) or with 5 μm PF-H2TMRos and 50 nm MitoTracker (B). Generated fluorescent signals were visualized by confocal microscopy with constant fluorescent parameters. Merged images are shown on the right. Experiments were repeated four times with reproducible results. C, HT22 cells transfected with damage-regulated autophagy modulator (DRAM)-EGFP or M6PR-EGFP were incubated with 5 μm PF-H2TMRos for 30 min. Intrinsic EGFP signals and PF-TMRos fluorescent signals were simultaneously observed with confocal microscopy. Merged images are shown on the right. Bar, 10 μm.
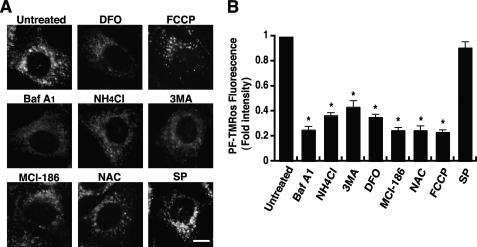
Direct measurement by a redox-sensitive variant of green fluorescent protein has demonstrated an oxidizing potential of endosomes and lysosomes (27). Therefore, we used marker proteins for investigating the proper location of PF-TMRos. Damage-regulated autophagy modulator is a transmembrane protein associated with lysosomes (28), and the cation-dependent mannose 6-phosphate receptor is localized at the trans-Golgi network to sort newly synthesized lysosomal enzymes for subsequent endosomal compartments (29). This transient transfection analysis confirmed that most speckles observed by PF-TMRos were colocalized with damage-regulated autophagy modulator-EGFP on lysosomes but not with cation-dependent mannose 6-phosphate receptor-EGFP on the trans-Golgi network and/or late endosomes (Fig. 4C). Redox-active labile iron enriched in lysosomes is suggested to be involved in local ROS production and cellular toxicity (30). Iron in a redox-active state represents a potentially radical producing system that is able to induce oxidative damage through the catalysis of Fenton-type reactions (4, 31). We thus examined the effect of desferrioxamine, a potent chelator of iron on autophagomes and lysosomes (32), and observed that punctate lysosomal signals by PF-TMRos were specifically removed in the iron-chelated cells (Fig. 5A). Combined with the previous studies (30–32), the data strongly support the idea that autophagosome and/or active lysosomes generate highly reactive ROS such as hydroxyl radicals, which are efficiently detected by the useful fluorescent probe PF-H2TMRos.
FIGURE 5.
Local ROS generation is blocked by specific inhibitors. HT22 cells were treated with each inhibitor for 4 h and then incubated with PF-H2TMRos. PF-TMRos fluorescent signals were visualized by microscopy with constant fluorescent parameters (A). Bar, 10 μm. The intensity of fluorescence in each cell was quantified with the densitometric imager, and the results from three independent experiments are presented as fold increases ± S.E. compared with that of the control (B). *, p < 0.05; Kruskal-Wallis test followed by Steel test. FCCP, carbonyl cyanide p-trifluoromethoxyphenyl-hydrazone; NAC, N-acetylcysteine; SP, SP600125; DFO, desferrioxamine.
We further analyzed constitutive signals of PF-TMRos to define their role in glutamate toxicity. The effects of the autophagic or lysosomal inhibitors on PF-TMRos signals were examined without glutamate treatment. As expected, BafA1, NH4Cl, or 3MA completely turned off punctate signals, and only a mitochondrial pattern remained in these cells (Fig. 5A). In contrast, mitochondrial signals were lost but the probe distribution on lysosomes was unaffected in cells treated by the mitochondrial uncoupler carbonyl cyanide p-trifluoromethoxyphenyl-hydrazone (Fig. 5A). MCI-186 and N-acetylcysteine scavenged intracellular ROS in an unselective manner. A densitometric measurement revealed that all these compounds significantly reduced total cellular fluorescence intensity in comparison with untreated cells (Fig. 5B). Therefore, inhibitors can reduce intracellular ROS levels by preventing basal mitochondrial function or constitutive activity of autophagy and/or lysosomes. Our data showed that the pharmacological inhibition of autophagy or lysosomes shifted the time of mitochondrial ROS burst to delay (Fig. 1E). Thus, these observations suggest that basal lysosomal ROS are involved in the oxidative cytotoxicity by glutamate but are not its determinant.
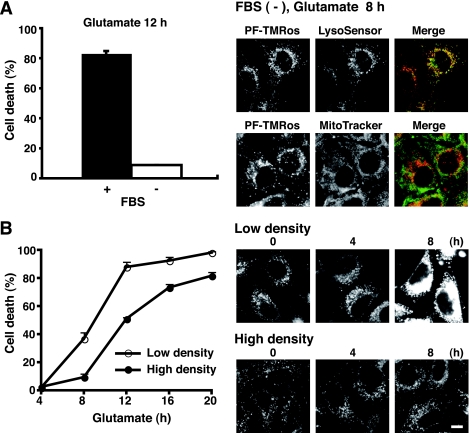
Next, two distinct cell culture conditions were assessed by PF-H2TMRos probe. We discovered that glutamate did not cause cell death in a serum-depleting condition (Fig. 6A, left panel). Interestingly, mitochondrial signals by PF-TMRos were completely absent in cells in a serum starvation for 8 h (Fig. 6A, right panels). Thus, basal ROS production from mitochondria in growing cells contributes to full cell death activity by glutamate treatment. This was supported by the following observation. We noted that under the high density culture, the cell death rate was reduced, and mitochondria-originated ROS were repressed at a low level (Fig. 6B). Taken together, the present results suggest that constitutive ROS generations from both mitochondria and lysosomes play an essential role in oxidative stress-associated cell death.
FIGURE 6.
Oxidative stress-induced cell death is suppressed under the low metabolic state. A, HT22 cells were treated with 5 mm glutamate in the presence or absence of 10% fetal bovine serum for an indicated time. The cell death rate was determined by trypan blue exclusion assay (left panel). Data are representative of four independent experiments. After incubation without fetal bovine serum (FBS) for 8 h, the cells were incubated in the dark with PF-H2TMRos plus LysoSensor or MitoTracker. Fluorescent signals were observed by fluorescent microscopy (right panels). B, HT22 cells were cultured at > 90% cell density (high) or ∼ 50% cell density (low) for 24 h, and then treated with glutamate for an indicated time. The cell death rate was determined by trypan blue exclusion assay (left panel). Results are shown as the means ± S.E. of four independent experiments. Generated ROS were detected by PF-H2TMRos (right panels). Experiments were repeated three times with reproducible results. Bar, 10 μm.
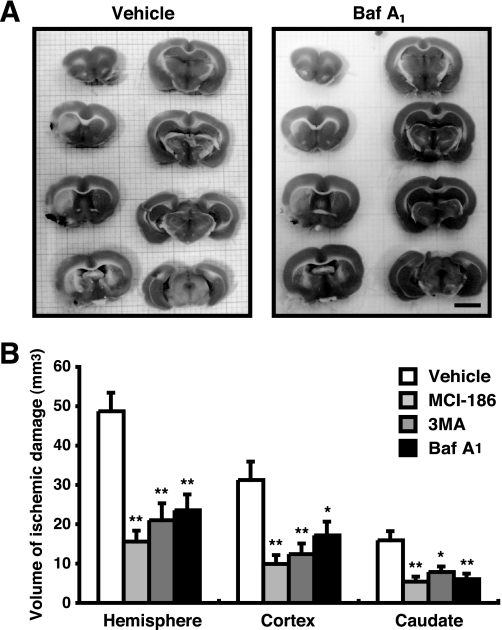
To evaluate our findings in vivo, we generated a permanent MCA occlusion for focal cerebral ischemia in rats (17) and examined whether aftermath treatment with lysosomal inhibitors reduces the volume of infarction in the gray and white matter. As shown in Fig. 7A, the area of ischemic damage in BafA1-treated rats is much less than that in untreated ones. The boundaries between the ischemic and nonischemic neuronal perikarya were identified, and the volume was determined. Treatment with BafA1, 3MA, or MCI-186 significantly reduced the volume of ischemic damage in the cerebral hemisphere, cerebral cortex, and the caudate nucleus (Fig. 7B). Although the end point of this study was designed at 3 h after the ischemia, the present data robustly show that these treatments have a potential to delay neural cell death in the acute phase of cerebral ischemia.
FIGURE 7.
Autophagy/lysosome inhibitors reduce volume of neural cell death. A, 3 h after MCA occlusion, ischemic damages were detected using TTC-staining. In TTC-stained slices, the infracted tissue appeared white, whereas the intact tissue was colored. Bar, 5 mm. B, the infract volume was measured and represented by the means ± S.E. *, p < 0.05; **, p < 0.01; 1-factor analysis of variance followed by Tukey-Kramer test.
DISCUSSION
Oxidative stress is known to be involved in various pathological processes, including neuronal cell death by cerebral ischemia. The HT22 cell is a useful in vitro model for the study of oxidative stress-associated neuronal cell death, and it has been used for identifying several therapeutic target molecules such as 12-lipoxygenase and ERK1/2 (11, 13). In the present study, we demonstrated that inhibitor treatments targeted to autophagy or lysosomes diminish glutamate-induced oxidative toxicity in HT22 cells (Fig. 1) and that they also reduce focal cerebral ischemia-associated neural damage in rats (Fig. 7). Neuronal cells are suggested to have a higher basal activity of macroautophagy that contributes to the protection of neurodegenerative disorders (33). Consistently, several LC3-positive speckles were detected in nonstarved HT22 cells by immunofluorescence analysis (Fig. 2A). Fine observations of ROS at lysosomal compartments in HT22 cells (Fig. 4) indicate that constitutively active autophagy is related to basal ROS generation in this neuronal cell. The susceptibility of neuronal cells to oxidative stress may be caused in part by higher levels of constitutive autophagic activity.
Using a useful fluorescent probe PF-H2TMRos, we demonstrated clearly that a kind of oxidant is localized at (auto)lysosomes (Fig. 4). Several previous studies have suggested that the redox-active iron plays an important role in lysosomal membrane permeabilization during oxidative stress (4). However, we did not observe any changes in the distributions of fluorescent markers in glutamate-treated HT22 cells (supplemental Fig. S1). Instead, ROS signals on lysosomes were specifically decayed by autophagic and lysosomal inhibitors as well as by desferrioxamine (Fig. 5A). This raises a possibility that the local ROS are produced by the specific activity of (auto)lysosomes such as the redox action of iron, through the catalysis of Fenton-type reactions. The idea is supported by the previous report that autophagic degradation of proteins such as ferritin promotes iron release within lysosomes, due to the conjugate action of an acidic milieu and hydrolytic enzymes (34). In fact, the brain has higher iron content than most organs, and a causal role of iron in ischemic neuronal injury is provided from several studies (31). Furthermore, a general role of Nox family proteins in autophagy regulation has been suggested most recently (35). Thus, an enzyme generating ROS such as Nox2 may localize for its function at (auto)lysosomes in neuronal cells.
The present data with the redox sensor have suggested that the ROS burst induced by glutamate is mainly generated in mitochondria (Figs. 4 and 6), whereas basal ROS in lysosomes are implicated in this outbreak of oxidative stress. On the other hand, chemical inhibitor treatments have indicated that the two sites of ROS generation are independent (Fig. 5A). These findings raise a question: How do ROS from the two origins collaborate for glutamate-induced cell death? Although direct molecular interaction between two distinctly localized ROS has been undefined, a simple densitometric analysis suggested that both ROS-generating activities contribute to the total cellular ROS level (Fig. 5B). Oxidative stress is proposed to be the effect of excess ROS effects, which resulted from an imbalance between synthesis and detoxification (1). Our data support this hypothesis; namely, lysosomal inhibitor treatments and high-density cell culture cause the reduction of basal ROS production from lysosomes and mitochondria, respectively, resulting in a net increase in the detoxification activity in HT22 cells. The enhancement of detoxification activity may protect glutamate-induced cell death through the delay of massive ROS generation. This explanation is very simple but may fulfill some of previous results. For example, ERK and/or PKC, which were shown to be involved in glutamate-induced HT22 cell death (13, 14), may control the basal ROS production from mitochondria via regulating their metabolic activities.
In the present study, we showed that the pharmacological inhibition of autophagy or lysosomes attenuate focal cerebral ischemia-associated neural damage in rats (Fig. 7). Notably, autophagic and lysosomal inhibitors were as effective as the free radical scavenger, MCI-186, although these inhibitors did not completely prevent but delayed the glutamate-induced HT22 cell death (Fig. 1). Excessive autophagosome formation in cerebral ischemia and suppression of neuronal cell death by inhibition of autophagy were observed in worm and rat in recent studies (36, 37). On the other hand, a most recent report has demonstrated that autophagy is induced by mild hypoxic insults and participates in neuroprotection by ischemic preconditioning (38). Thus, ischemic insult may immediately activate autophagy by unknown mechanisms, which will significantly affect the ROS generation and oxidative toxicity in vivo.
Our results may demonstrate that autophagosomes and lysosomes are one of the effective therapeutic targets for cerebral ischemic damage. Because oxidative stress has been suggested to play a central role in ischemia/reperfusion-induced neural damage (39), the decrease of oxidative stress by inhibiting ROS generation sources should be substantial treatment for ischemic insults. We showed that the decrease of lysosomal ROS by the inhibitor treatment shifted the time of mitochondrial ROS burst to delay (Fig. 1E). This means that we could extend the therapeutic time window by applying this strategy to the stroke patient because therapies that transiently prevent ischemic neuronal death can potentially extend therapeutic time windows for stroke thrombolysis (40). The therapeutic time window is critical for the treatment of stroke, particularly after emergence of the treatment with tissue plasminogen activator via intravenous administration (41). The best treatment for stroke patients at this time is recirculation of blood supply with thrombolysis by administrating the tissue plasminogen activator within 3 h after the onset of cerebral ischemia. However, its widespread application remains limited by the narrow treatment time windows and the related risks of cerebral hemorrhage (42). Even in advanced countries, only 5% of stroke patients have been treated with tissue plasminogen activator (43). There is a pressing need for more widely applicable therapy (44). Treatment by lysosomal inhibitors may extend the therapeutic time window, and the proposed strategy would be an enormous contribution in terms of the increasing number of patients who have an indication to the tissue plasminogen activator treatment.
Supplementary Material
Acknowledgments
We thank Drs. T. Yoshimori and N. Fujita (Osaka University) for providing Atg4B cDNA and Dr. I. Tanida (National Institute of Infectious Disease) for technical advice. We also thank Mr. K. Kagoshima, Ms. M. Kosaki, and Ms. M. Hosoi for generous support.
This work was supported by the grants-in-aid and the Global Center of Excellence Program from the Japanese Ministry of Education, Culture, Sports, Science and Technology.

The on-line version of this article (available at http://www.jbc.org) contains supplemental Fig. S1.
- ROS
- reactive oxygen species
- DCF
- dichlorofluorescein
- 3MA
- 3-methyl adenine
- MCA
- middle cerebral artery
- TTC
- 2,3,5-triphenyltetrazolim chloride
- EGFP
- enhanced green fluorescence protein
- PF-H2TMROS
- 2,3,4,5,6-pentafluorodihydrotetramethylrosamine.
REFERENCES
- 1.Scherz-Shouval R., Elazar Z. (2007) Trends Cell Biol. 17, 422–427 [DOI] [PubMed] [Google Scholar]
- 2.Yamashima T. (2004) Cell Calcium 36, 285–293 [DOI] [PubMed] [Google Scholar]
- 3.Golstein P., Kroemer G. (2007) Trends Biochem. Sci. 32, 37–43 [DOI] [PubMed] [Google Scholar]
- 4.Kurz T., Terman A., Gustafsson B., Brunk U. T. (2008) Biochim. Biophys. Acta. 1780, 1291–1303 [DOI] [PubMed] [Google Scholar]
- 5.Chen Y., McMillan-Ward E., Kong J., Israels S. J., Gibson S. B. (2008) Cell Death Differ. 15, 171–182 [DOI] [PubMed] [Google Scholar]
- 6.Harraz M. M., Dawson T. M., Dawson V. L. (2008) Stroke 39, 286–288 [DOI] [PubMed] [Google Scholar]
- 7.Kiffin R., Christian C., Knecht E., Cuervo A. M. (2004) Mol. Biol. Cell 15, 4829–4840 [DOI] [PMC free article] [PubMed] [Google Scholar]
- 8.Kim I., Rodriguez-Enriquez S., Lemasters J. J. (2007) Arch. Biochem. Biophys. 462, 245–253 [DOI] [PMC free article] [PubMed] [Google Scholar]
- 9.Coyle J. T., Puttfarcken P. (1993) Science 262, 689–695 [DOI] [PubMed] [Google Scholar]
- 10.Davis J. B., Maher P. (1994) Brain Res. 652, 169–173 [DOI] [PubMed] [Google Scholar]
- 11.Li Y., Maher P., Schubert D. (1997) Neuron 19, 453–463 [DOI] [PubMed] [Google Scholar]
- 12.Tan S., Sagara Y., Liu Y., Maher P., Schubert D. (1998) J. Cell Biol. 141, 1423–1432 [DOI] [PMC free article] [PubMed] [Google Scholar]
- 13.Stanciu M., Wang Y., Kentor R., Burke N., Watkins S., Kress G., Reynolds I., Klann E., Angiolieri M. R., Johnson J. W., DeFranco D. B. (2000) J. Biol. Chem. 275, 12200–12206 [DOI] [PubMed] [Google Scholar]
- 14.Choi B. H., Hur E. M., Lee J. H., Jun D. J., Kim K. T. (2006) J. Cell Sci. 119, 1329–1340 [DOI] [PubMed] [Google Scholar]
- 15.Sohn H., Kim Y. S., Kim H. T., Kim C. H., Cho E. W., Kang H. Y., Kim N. S., Kim C. H., Ryu S. E., Lee J. H., Ko J. H. (2006) FASEB. J. 20, 1248–1250 [DOI] [PubMed] [Google Scholar]
- 16.Ha J. S., Park S. S. (2006) Neurosci. Lett. 393, 165–169 [DOI] [PubMed] [Google Scholar]
- 17.Imai H., Masayasu H., Dewar D., Graham D. I., Macrae I. M. (2001) Stroke 32, 2149–2154 [DOI] [PubMed] [Google Scholar]
- 18.Satoh T., Ishige K., Sagara Y. (2004) Neurosci. Lett. 371, 1–5 [DOI] [PubMed] [Google Scholar]
- 19.Murphy T. H., Miyamoto M., Sastre A., Schnaar R. L., Coyle J. T. (1989) Neuron 2, 1547–1558 [DOI] [PubMed] [Google Scholar]
- 20.Hou N., Torii S., Saito N., Hosaka M., Takeuchi T. (2008) Endocrinology 149, 1654–1665 [DOI] [PubMed] [Google Scholar]
- 21.Torii S., Saito N., Kawano A., Zhao S., Izumi T., Takeuchi T. (2005) Traffic 6, 1213–1224 [DOI] [PubMed] [Google Scholar]
- 22.Tan S., Wood M., Maher P. (1998) J. Neurochem. 71, 95–105 [DOI] [PubMed] [Google Scholar]
- 23.Tanida I., Ueno T., Kominami E. (2004) Int. J. Biochem. Cell Biol. 36, 2503–2518 [DOI] [PMC free article] [PubMed] [Google Scholar]
- 24.Fujita N., Hayashi-Nishino M., Fukumoto H., Omori H., Yamamoto A., Noda T., Yoshimori T. (2008) Mol. Biol. Cell 19, 4651–4659 [DOI] [PMC free article] [PubMed] [Google Scholar]
- 25.Yu L., Wan F., Dutta S., Welsh S., Liu Z., Freundt E., Baehrecke E. H., Lenardo M. (2006) Proc. Natl. Acad. Sci. U.S.A. 103, 4952–4957 [DOI] [PMC free article] [PubMed] [Google Scholar]
- 26.Chen C. S., Gee K. R. (2000) Free Radic. Biol. Med. 28, 1266–1278 [DOI] [PubMed] [Google Scholar]
- 27.Austin C. D., Wen X., Gazzard L., Nelson C., Scheller R. H., Scales S. J. (2005) Proc. Natl. Acad. Sci. U.S.A. 102, 17987–17992 [DOI] [PMC free article] [PubMed] [Google Scholar]
- 28.Crighton D., Wilkinson S., O'Prey J., Syed N., Smith P., Harrison P. R., Gasco M., Garrone O., Crook T., Ryan K. M. (2006) Cell 126, 121–134 [DOI] [PubMed] [Google Scholar]
- 29.Puertollano R., Aguilar R. C., Gorshkova I., Crouch R. J., Bonifacino J. S. (2001) Science 292, 1712–1716 [DOI] [PubMed] [Google Scholar]
- 30.Yu Z., Persson H. L., Eaton J. W., Brunk U. T. (2003) Free Radic. Biol. Med. 34, 1243–1252 [DOI] [PubMed] [Google Scholar]
- 31.Selim M. H., Ratan R. R. (2004) Ageing Res. Rev. 3, 345–353 [DOI] [PubMed] [Google Scholar]
- 32.Persson H. L., Yu Z., Tirosh O., Eaton J. W., Brunk U. T. (2003) Free Radic. Biol. Med. 34, 1295–1305 [DOI] [PubMed] [Google Scholar]
- 33.Komatsu M., Ueno T., Waguri S., Uchiyama Y., Kominami E., Tanaka K. (2007) Cell Death Differ. 14, 887–894 [DOI] [PubMed] [Google Scholar]
- 34.Sakaida I., Kyle M. E., Farber J. L. (1990) Mol. Pharmacol. 37, 435–442 [PubMed] [Google Scholar]
- 35.Huang J., Canadien V., Lam G. Y., Steinberg B. E., Dinauer M. C., Magalhaes M. A., Glogauer M., Grinstein S., Brumell J. H. (2009) Proc. Natl. Acad. Sci. U.S.A. 106, 6226–6231 [DOI] [PMC free article] [PubMed] [Google Scholar]
- 36.Samara C., Syntichaki P., Tavernarakis N. (2008) Cell Death Differ. 15, 105–112 [DOI] [PubMed] [Google Scholar]
- 37.Wen Y. D., Sheng R., Zhang L. S., Han R., Zhang X., Zhang X. D., Han F., Fukunaga K., Qin Z. H. (2008) Autophagy 4, 762–769 [DOI] [PubMed] [Google Scholar]
- 38.Park H. K., Chu K., Jung K. H., Lee S. T., Bahn J. J., Kim M., Lee S. K., Roh J. K. (2009) Neurosci. Lett. 451, 16–19 [DOI] [PubMed] [Google Scholar]
- 39.Imai H., Graham D. I., Masayasu H., Macrae I. M. (2003) Free Radic. Biol. Med. 34, 56–63 [DOI] [PubMed] [Google Scholar]
- 40.Singhal A. B., Benner T., Roccatagliata L., Koroshetz W. J., Schaefer P. W., Lo E. H., Buonanno F. S., Gonzalez R. G., Sorensen A. G. (2005) Stroke 36, 797–802 [DOI] [PubMed] [Google Scholar]
- 41.National Institute of Neurological Disorders Group Stroke rt-PA Stroke Study (1995) N. Engl. J. Med. 333, 1581–15877477192 [Google Scholar]
- 42.Ringleb P. A., Schellinger P. D., Schranz C., Hacke W. (2002) Stroke 33, 1437–1441 [DOI] [PubMed] [Google Scholar]
- 43.California Acute Stroke Pilot Registry (CASPR) Investigators (2005) Neurology 64, 654–659 [DOI] [PubMed] [Google Scholar]
- 44.Lees K. R., Zivin J. A., Ashwood T., Davalos A., Davis S. M., Diener H. C., Grotta J., Lyden P., Shuaib A., Hårdemark H. G., Wasiewski W. W. (2006) N. Engl. J. Med. 354, 588–60016467546 [Google Scholar]
Associated Data
This section collects any data citations, data availability statements, or supplementary materials included in this article.


