

Abstract
In L6 myotubes, redistribution of a hemagglutinin (HA) epitope-tagged GLUT4 (HA-GLUT4) to the cell surface occurs rapidly in response to insulin stimulation and AMP-activated protein kinase (AMPK) activation. We have examined whether these separate signaling pathways have a convergent mechanism that leads to GLUT4 mobilization and to changes in GLUT4 recycling. HA antibody uptake on GLUT4 in the basal steady state reached a final equilibrium level that was only 81% of the insulin-stimulated level. AMPK activators (5-aminoimidazole-4-carboxyamide ribonucleoside (AICAR) and A-769662) led to a similar level of antibody uptake to that found in insulin-stimulated cells. However, the combined responses to insulin stimulation and AMPK activation led to an antibody uptake level of ∼20% above the insulin level. Increases in antibody uptake due to insulin, but not AICAR or A-769662, treatment were reduced by both wortmannin and Akt inhibitor. The GLUT4 internalization rate constant in the basal steady state was very rapid (0.43 min−1) and was decreased during the steady-state responses to insulin (0.18 min−1), AICAR (0.16 min−1), and A-769662 (0.24 min−1). This study has revealed a nonconvergent mobilization of GLUT4 in response to activation of Akt and AMPK signaling. Furthermore, GLUT4 trafficking in L6 muscle cells is very reliant on regulated endocytosis for control of cell surface GLUT4 levels.
Keywords: Cell/Endocytosis, Cell/Exocytosis, Diseases/Diabetes, Hormones/Insulin, Membrane/Recycling, Membrane/Trafficking, Phosphorylation/Kinases/Serine-Threonine, Transport/Glucose
Introduction
Insulin stimulates glucose uptake into muscle and fat cells by triggering the translocation of the facilitative glucose transporter GLUT4 from intracellular storage vesicles to the plasma membrane. However, because GLUT4 continuously cycles between these vesicles and the plasma membrane both in the absence and presence of insulin, it is conceivable that insulin increases cell surface levels of the transporter by either increasing the exocytic rate and/or decreasing the endocytic rate and/or increasing the size of the recycling GLUT4 pool. GLUT4 trafficking has been extensively studied in adipocytes where it has been found that the major effect of insulin is to stimulate exocytosis (1–5), although it has been reported that insulin also inhibits GLUT4 endocytosis (2, 6). A recent kinetic study using a GLUT4 photolabel has revealed that exocytosis is a major site of insulin regulation of GLUT4 traffic in both rat and human skeletal muscle, but further studies on additional trafficking kinetic parameters were limited by difficulties involved in working with skeletal muscle strips (7). Similar conclusions have been reached in studies on cardiac muscle cells (8). Klip and co-workers (9) have carried out kinetic studies of GLUT4 trafficking in the L6 muscle cell line and have reported that insulin increases cell surface GLUT4 by stimulating GLUT4 exocytosis. However, the basal rate of GLUT4 recycling is much faster in L6 cells than in adipocytes (4–6, 9) implicating a potential role for endocytosis in regulating cell surface levels of the transporter in these cells. Consistent with this possibility, it has recently been shown in L6 cells that the mitochondrial uncoupler 2,4-dinitrophenol, like insulin, also stimulates GLUT4 translocation and does so by inhibiting GLUT4 endocytosis (10). This is of interest because 2,4-dinitrophenol may mimic the effects of exercise/contraction, which also stimulates GLUT4 translocation in muscle. In contrast to insulin, which regulates GLUT4 trafficking principally via the phosphatidylinositol 3-kinase/Akt pathway, other agonists such as exercise or mitochondrial poisons appear to do so, at least in part, via activation of the stress kinase AMPK2 (11–13). Direct activation of AMPK using the AMPK activator AICAR enhances glucose uptake into muscle by increasing cell surface GLUT4 levels (14–16). Despite this, there is relatively little data on the effects of AMPK activation on GLUT4 trafficking in muscle, although it has been reported that AMPK may regulate GLUT4 endocytosis (7, 8). Many of these studies into AMPK-mediated glucose uptake have relied on AICAR, which has been reported to activate pathways other than AMPK (reviewed in Ref. 17).
In this study, we have extensively characterized GLUT4 trafficking kinetics in L6 myotubes stimulated with a range of agonists, including insulin and a more direct AMPK activator recently described in the literature, A-769662 (17, 18). We report that AMPK agonists and insulin added simultaneously to L6 myotubes resulted in additive effects on GLUT4 levels at the cell surface and in the recycling pathway, indicating the presence of distinct pools of GLUT4 in muscle cells. Furthermore, our studies indicate a hitherto unrecognized role for endocytosis in the trafficking of GLUT4 in response to a range of stimuli in muscle cells.
EXPERIMENTAL PROCEDURES
Cell Culture
L6 myoblasts (up to passage 25) were cultured in α-minimal essential medium (Lonza) supplemented with 10% heat-inactivated fetal calf serum (Hyclone) and 1% antibiotic/antimycotic (Invitrogen) at 37 °C in 10% CO2. For differentiation into myotubes, cells were cultured in α-minimal essential medium supplemented with 2% heat-inactivated fetal calf serum at 37 °C in 10% CO2 and were maintained in this medium post differentiation. Myotubes were used for experiments 5–9 days after the initiation of differentiation. To express HA-GLUT4 in L6 cells, myoblasts were infected with retrovirus, as described previously (5, 19), and differentiated as described above.
Akt Phosphorylation
L6 myotubes cultured in 96-well plates were incubated ± inhibitor (100 nm wortmannin or 10 μm Akti) for 15 min prior to stimulation with 200 nm insulin for 30 min. Cells were lysed in lysis buffer (2% SDS (Sigma) in PBS, pH 7.4, protease inhibitor mixture (Roche Applied Science), phosphatase inhibitor mixture (Roche Applied Science)) and sonicated for 6 s before being centrifuged at 15,000 × g for 20 min at 15 °C. The protein concentration of supernatant was determined by BCA assay. 5-μg samples of protein were resolved by 10% SDS-PAGE and Western-blotted using Akt-2 antibody (Upstate) and anti-phospho-Akt (Ser473) antibody (Cell Signaling). In each case, signals were detected by ECL (Pierce) and quantified using an Optichem detector with associated software (UltraViolet Products).
Transition State Assay
Measurement of cell surface HA-GLUT4 as a percentage of total cellular HA-GLUT4 was performed in 96-well plates as described previously. Briefly, cells were serum-starved for 16 h in α-minimal essential medium (without bicarbonate) with 20 mm HEPES and 0.2% bovine serum albumin (Celliance) and maintained in this medium during subsequent treatments. Cells were incubated with 100 nm wortmannin (Calbiochem) or 10 μm Akti (P. Shepherd, Auckland, New Zealand) where indicated for 15 min prior to insulin stimulation. Myotubes were stimulated with 200 nm insulin, 2 mm AICAR, or 100 μm A-769662 (K. Sakamoto, Dundee, Scotland, United Kingdom) for the times indicated in the figure legends. To investigate additivity between insulin and AICAR, both agonists were added simultaneously. Cells were subsequently fixed but not permeabilized, and the amount of HA-GLUT4 present at the plasma membrane was determined from the accessibility of the HA epitope to anti-HA antibody (Covance). Finally, cells were incubated with 20 μg/ml goat anti-mouse Alexa 488-conjugated secondary antibody (Molecular Probes, Invitrogen). After washing, fluorescence (emission 485 nm/excitation 520 nm) was measured in bottom reading mode using a fluorescent microtiter plate reader (FLUOstar Galaxy; BMG Labtechnologies). All values were expressed as a percentage of total GLUT4 that was determined from anti-HA antibody labeling of permeabilized cells.
Comparison of Recycling HA-GLUT4 with Total HA-GLUT4
L6 myotubes cultured in 96-well plates were serum-starved for 16 h, and then 200 nm insulin and/or 2 mm AICAR was added to cells 30 min before anti-HA antibody. To measure GLUT4 recycling with the cell surface, basal or stimulated myotubes were labeled with saturating concentrations of protein-G affinity column (Pierce) purified anti-HA antibody for 180 min. The saturating concentration of antibody was experimentally determined as 50 μg/ml. Wells being used to measure total cellular GLUT4 were not labeled with antibody. Cells were moved to 4 °C, washed extensively with ice-cold PBS, and fixed with 3% paraformaldehyde (Science Services). All cells were blocked and permeabilized (0.1% saponin (Sigma), 3% goat serum (Sigma), and 1% bovine serum albumin in PBS (12.5 mm Na2HPO4, 154 mm NaCl, pH 7.2)). To determine total GLUT4 levels, unlabeled cells were labeled with anti-HA antibody for 60 min. Cells prelabeled with anti-HA antibody did not receive additional antibody. Finally, cells were incubated with goat anti-mouse Alexa 488-conjugated secondary antibody (20 μg/ml) overnight. After washing, fluorescence was determined as described above. Antibody uptake was expressed as a percentage of total HA-GLUT4.
HA-GLUT4 Recycling; Anti-HA Antibody Uptake Assay
L6 myotubes cultured in 96-well plates were serum-starved for 16 h in α-minimal essential medium (without bicarbonate) with 20 mm HEPES and 0.2% bovine serum albumin. For measurement of steady-state trafficking of HA-GLUT4 under insulin and AICAR- and A-769662-stimulated conditions, 200 nm insulin and/or 2 mm AICAR or 100 μm A-769662 was added to cells 30 min before anti-HA antibody. For uptake experiments in the presence of inhibitor, 100 nm wortmannin or 10 μm Akti was added 15 min prior to insulin stimulation. Basal or stimulated myotubes were labeled with 50 μg/ml anti-HA antibody for the indicated times. Cells were moved to 4 °C, washed extensively with ice-cold PBS, and fixed with 3% paraformaldehyde. Cells were blocked and permeabilized before being incubated with goat anti-mouse Alexa 488-conjugated secondary antibody (20 μg/ml) overnight. Fluorescence was determined as described above. All values were normalized to fluorescence of insulin-stimulated samples that were incubated with antibody for 180 min.
Wide field epifluorescent images (×40) of cells in 96-well plates were automatically obtained on the ImageXpressTM 5000 inverted epifluorescent imaging system, software, and robotics (Molecular Devices). Prior to imaging, nuclei were labeled with Hoechst fluorescent dye (1:10,000 dilution) (Invitrogen). Hoechst dye and Alexa 488 (Anti-HA antibody) fluorophores were excited at 360 (±20) and 480 (±20) nm, respectively, and detected with corresponding channels at 460 (±25) and 535 (±25) nm. For presentation, images were exported to Photoshop 6.0 (Adobe).
HA-GLUT4 Internalization Assay
L6 myotubes cultured in 96-well plates were stimulated for 30 min, and surface HA-GLUT4 was pulse-labeled with anti-HA antibody (50 μg/ml) at 4 °C for 45 min. Following extensive ice-cold washes to remove unbound antibody, prewarmed medium was added to the myotubes, and they were immediately returned to 37 °C for the indicated periods of time. Cells were subsequently moved back to 4 °C, washed with ice-cold PBS, and fixed. Surface antibody was detected using goat anti-mouse Alexa 488-conjugated secondary antibody, and fluorescence was detected as described above. Data were normalized to give values as a percentage of the original (0 min) cell surface signal.
Kinetic Analysis of Transition State Experiments
Overall measures of the exocytosis and endocytosis rate constants for GLUT4 to and from the plasma membrane were determined for the system using a two-compartmental model outlined previously (20). The time constant and half-time for the translocation of GLUT4 was determined from transition state assays. This assay measures the translocation of GLUT4 to the plasma membrane following stimulation, the data from which was fitted to Equation 1,
where L(t) is the amount of GLUT4 at the plasma membrane at time (t); P0 is the initial amount of GLUT4 at the plasma membrane in the absence of the perturbing agent; P1 is the level of GLUT4 at the plasma membrane after long insulin (or other) treatment, and τ is the time constant for the transition.
The half-time (t½) for the transition is given by t½ = τ ln2. However, this does not mean that the rate at which GLUT4 arrives at the plasma membrane is constant during this transition from the basal steady state to the stimulated steady state. This could be due to differing amounts of GLUT4 available for transport to the surface and/or varying exocytosis and endocytosis rate constants for GLUT4, which only become constant once the system is in steady state.
Kinetic Analysis of Steady-state Experiments
For the purposes of this analysis only, the overall exocytosis and endocytosis rate constants to and from the plasma membrane were considered. These could be (and are highly likely to be) a combination of several processes.
As in Refs. 5, 20, it was assumed that all unlabeled HA-GLUT4 was immediately labeled upon insertion into the plasma membrane. The increase in fluorescence as a function of time is given by Equation 2,
where L(t) is the measured fluorescence as a function of time (t); kex is the overall exocytosis rate constant of GLUT4 to the plasma membrane; P is the amount of GLUT4 at the plasma membrane, and T is the total amount of GLUT4 recycling from internal structures to the plasma membrane.
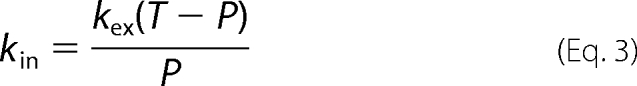
The endocytosis rate constant, kin, can be inferred from these three steady-state parameters as shown in Equation 3,
 |
To directly relate these parameters to the rate of GLUT4 trafficking, a combined parameter, R, defined as shown in Equation 4 was determined,
which is a measure of the GLUT4 transport rate from the plasma membrane. As the system is in steady state, this is equivalent to the total transport rate to the plasma membrane.
Kinetic Analysis of Internalization Assays
The internalization of GLUT4 is controlled by the overall internalization rate constant kin. However, once the labeled GLUT4 molecules are internalized, they then become part of the pool, which can be exocytosed at an overall rate kex.
The amount of antibody-labeled GLUT4 is equal to the amount of GLUT4 present at the plasma membrane in the steady state and is initially all localized at the cell surface. This is distributed with time between the plasma membrane and the internal recycling structures. The model for this is shown in Equation 5,
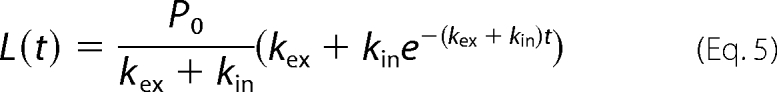 |
where L(t) is the measured fluorescence at the plasma membrane and a function of time (t); P0 is the initial level at the plasma membrane, and kin and kex are the overall exocytosis and endocytosis rate constants of GLUT4 to and from the plasma membrane, respectively.
Error Determination
The 95% confidence intervals for the parameters were determined as part of the nonlinear regression fitting to the data. These confidence intervals were used to calculate the standard error for the parameters. The number of standard errors spanning the interval was determined using the Student's t inverse cumulative distribution function. The standard error is then the confidence interval divided by the number of standard errors.
Significance
Given that the standard errors were determined from the confidence interval, it was not possible to perform normal tests of significance. Statistical significance was tested by comparing the overlap of the confidence intervals of the parameters. In the case of no overlap, the difference in the values was statistically significant. An overlap of confidence intervals, however, does not imply the converse but rather that there may or may not be statistical significance. All the data presented were analyzed for statistical significance, and only those changes that were significant are discussed in the text.
RESULTS
In this study, we have used L6 cells as a model system to study GLUT4 trafficking. These cells have been extensively used by Klip and co-workers (9, 10, 21, 22) to study the action of insulin and other agonists on GLUT4 translocation in muscle. One of the problems with these cells is that the differentiated L6 muscle cells express very little GLUT4 presumably because the cells are denervated (23). To overcome this problem, tagged GLUT4 reporters can be expressed to study GLUT4 trafficking. Although many investigators use stably expressing cell clones (10), this can be problematic due to the possibility for clonal selection of an aberrant cell line as well as difficulties in maintaining efficient muscle cell differentiation in stable clones. To overcome these problems, we have developed a system whereby cells are infected with retrovirus-expressing HA epitope-tagged GLUT4, which are then selected as pools rather than as clones. The expression of GLUT4 in L6 myotubes is uniform using this system and at a level (3.5 ρmol/mg of protein) similar to endogenous GLUT4 in rat epitrochlearis muscle (calculated from unpublished data from a previous study (7)).
Transition from the Basal to a Stimulated State
As shown in Fig. 1C in the basal state, there is very little GLUT4 detected on the plasma membrane in L6 myotubes similar to that observed in adipocytes (5). Treatment with maximal concentrations of insulin or AICAR caused a significant increase in surface levels of GLUT4. To more specifically study the role of AMPK, we also used the specific agonist A-769662, which has recently been reported to stimulate glucose uptake in L6 cells (17). We selected doses of A-769662 and AICAR that achieved a similar degree of AMPK activity as judged by the phosphorylation of acetyl-CoA carboxylase at serine 79 (data not shown). This also resulted in a significant increase in plasma membrane levels of GLUT4. We then measured the time course of GLUT4 translocation to the plasma membrane upon stimulation with the different agonists (Fig. 1A). The amount of GLUT4 exposed at the plasma membrane was calculated as a percentage of total cellular GLUT4 levels, which were measured by labeling permeabilized cells with anti-HA antibody (Fig. 1A). The increase in cell surface GLUT4 in response to all the agonists was rapid reaching a new steady state within 2–5 min (Fig. 1A). Fits of the data to Equation 1 determined that the transitions occurred with short half-times of 1.21 and 1.27 min for insulin- and AICAR-stimulated cells, respectively (Fig. 1B). A shorter half-time (0.62 min) was observed for A-769662-stimulated cells. At 10 min, a new steady-state level of GLUT4 was reached, and this was maintained for at least 60 min.
FIGURE 1.

Transition to a steady-state GLUT4 distribution in L6 myotubes. A, L6 myotubes were stimulated with insulin (●), AICAR (■), A-769662 (▴), and insulin + AICAR (○) for the indicated times, and then cells were fixed, and the surface GLUT4 level was determined in fixed cells using an HA primary antibody and an Alexa 488 secondary antibody. Each data point represents the mean ± S.E. from three experiments. In some cases, the error bars are smaller than the symbol. B, times for the half-maximal increase above basal in cell surface HA-GLUT4 were determined for insulin, AICAR, A-769662, and the combination of insulin and AICAR. C, cell surface levels of GLUT4 reached at 30 min of incubation with the agonists were determined as a percentage of the total cellular GLUT4 available in permeabilized cells. D, plateau levels of antibody labeled-GLUT4 reached at 180 min of incubation with the anti-HA antibody were determined as a percentage of the total cellular GLUT4 available in permeabilized cells. Results are the mean ± S.E. from three experiments.
To determine whether the different agonists triggered GLUT4 translocation via different mechanisms, we next examined the effects of combined treatments. The combined stimulation with insulin and AICAR led to an increase in cell surface GLUT4 to a level that was higher than with either stimulus alone (Fig. 1C). All changes in the surface level of GLUT4 were highly correlated with the total amount of GLUT4 present in the recycling system revealed by measuring HA antibody uptake over 3-h incubations. As observed in 3T3-L1 cells (5), residual pools of GLUT4 remain intracellular even following prolonged stimulation of HA antibody uptake (Fig. 1D). In basal cells, only 61% of the GLUT4 exchanges with the surface at steady state. This value increased to 75 and 77% in insulin- and AICAR-treated cells, respectively. Intriguingly, the amount of GLUT4 in the recycling pathway in the presence of insulin plus AICAR was significantly greater than that observed with either stimulus alone (88%, p < 0.001) indicating different mechanisms of stimulation and the existence of different pools of GLUT4. Also, these data indicate that a residual pool of intracellular GLUT4, which does not recycle in the presence of a range of agonists, is present in L6 cells.
Insulin caused a significant increase in Akt phosphorylation in L6 cells. This effect was inhibited by the phosphatidylinositol 3-kinase inhibitor wortmannin and to a lesser extent by the Akt inhibitor Akti (Fig. 2A). These data are similar to those previously reported for 3T3-L1 adipocytes (24). Correspondingly, insulin-stimulated GLUT4 translocation to the plasma membrane was reduced by ∼50% in the presence of Akti and almost completely abolished with wortmannin (Fig. 2B).
FIGURE 2.

Akt control of the transition from basal to insulin-stimulated state. A, Akt activation was determined by blotting for phosphoserine 473 in basal cells and cells treated with insulin (upper panels). Both basal and insulin-treated cells were also treated with wortmannin (WM) and Akti as indicated. Akt2 levels were determined from the same solubilized cell lysates (bottom panels). B, rate of transition from the basal to the insulin-stimulated state in the absence (●) and presence of wortmannin (■), and Akti (▴) was determined in fixed cells using HA primary antibody and an Alexa 488 secondary antibody. Each point represents the mean ± S.E. from three experiments. In some cases error bars are smaller than the symbol.
Steady-state GLUT4 Recycling
Once the transition phase is over and a new steady state is reached, GLUT4 is distributed between the plasma membrane and internal compartments, and the rates of traffic into and out of the plasma membrane are equal. We have studied GLUT4 traffic at steady state by maintaining L6 myotubes with anti-HA antibody throughout the 180-min incubations (Fig. 3, A and B). Over this time course, the uptake of antibody is progressive, and labeled GLUT4 appears to reach similar intracellular locations under both basal and insulin-stimulated conditions. Antibody-bound GLUT4 is detected throughout the cell but is particularly evident in the peri-nuclear region after long incubations with antibody (Fig. 3A). Note that the final levels of antibody bound to GLUT4 in these incubations are reported relative to the maximum insulin-stimulated level (Fig. 3B) but also correspond to those presented in Fig. 1D. The half-time of antibody uptake under all conditions was ∼10–15 min, which is an order of magnitude slower than the half-time for the transition from the basal to the stimulated state (Fig. 1, A–C). Similar to the transition experiments, the steady-state antibody uptake in response to insulin and AICAR was additive and reached a higher level than either stimulus alone (Fig. 3B).
FIGURE 3.

HA antibody uptake reveals GLUT4 steady-state recycling kinetics. L6 myotubes were maintained in the basal state or stimulated to a steady state. Anti-HA antibody was then added, and the incubations with antibody were continued for the indicated times. At the indicated times, the bound antibody was determined by incubation with an Alexa 488 secondary antibody. A, L6 myotubes were maintained in the basal state or stimulated to steady state with insulin. At indicated times, L6 myotubes were visualized by wide field epifluorescence microscopy at ×40 magnification (scale bar, 20 μm). B, L6 myotubes were maintained in the basal state (♦) or stimulated to steady state with insulin (●), AICAR (■), or insulin plus AICAR (○). Results are the mean ± S.E. from 3 to 7 experiments. In some cases error bars are smaller than the symbol.
We have approached the further analysis of the steady-state antibody uptake by assuming that at steady state only a single intracellular compartment contributes to the recycling. This is an oversimplification. Furthermore, it is evident that the single intracellular compartment from which GLUT4 is recruited is not the same size for all stimulation conditions tested as there is additivity in the responses to Akt and to AMPK stimulation.
Fitting the uptake assay data to Equation 2 allows calculation of four parameters (Fig. 4). These are the initial plasma membrane level P, the final plateau level T, and the rate constants kex and kin for movement out of and back into the single intracellular compartment. The analysis of P and T values from the steady-state equations confirm the additivity in the responses to insulin and the AMPK agonists as observed in the transition experiments (Fig. 4, A and B). These data suggest that the additivity in translocation of GLUT4 to the plasma membrane following stimulation with insulin and AMPK agonists (15–20% increase in P) correlates closely with the additivity in the total pool of recycling GLUT4 (15–20% increase in T).
FIGURE 4.

Kinetic parameters for GLUT4 recycling at steady state. The uptake time courses for the increase in antibody bound to GLUT4 HA were analyzed to give the following: A, plasma membrane level of HA-GLUT4, P; B, total available GLUT4, T; C, kex rate constant; and D, kin rate constant. WM, wortmannin. The analyzed data are from 3 to 7 experiments. Standard errors calculated from the confidence intervals (see “Experimental Procedures”) for the fits are shown.
The analysis of the rate constants for exo- and endocytosis reveals that the rise in P strongly correlates with a reduction in kin rather than to increased kex (Fig. 4D). The basal kin value was extremely fast in L6 myotubes, and this was reduced by ∼50% following treatment with insulin, AICAR, or A-769662. There was a relatively small increase in kex response to insulin or insulin combined with AMPK agonists (Fig. 4C). However, both AICAR and A-769662 treatments alone led to a slight reduction in kex. There was no additivity in response to combination treatments with these AMPK agonists on either kex or kin.
We next examined the effects of wortmannin and Akti on the steady-state trafficking of GLUT4 (Fig. 5). Wortmannin completely inhibited the insulin-dependent increment in surface levels of GLUT4 (P]). By contrast, and as evident in the transition experiments (Fig. 2B), Akti did not completely inhibit the insulin effect on the initial cell surface levels. The wortmannin and Akti effects on the total GLUT4 recycling pool (T) also differed. Whereas wortmannin reduced T values obtained from insulin-treated cells compared with those obtained from basal cells, Akti reduced both basal and insulin-stimulated levels of T, indicating that Akt is required for the insulin-stimulated increase in the total GLUT4 recycling pool.
FIGURE 5.

Inhibition of steady-state GLUT4 recycling by wortmannin and Akti. Steady-state kinetic plots without inhibitor (Control) or following treatment with wortmannin (WM) or the Akt inhibitor (Akti) were analyzed to give the following: A, plasma membrane level of HA-GLUT4, P; B, the total available GLUT4, T; C, kex rate constant; and D, kin rate constant. The analyzed data are from three experiments. Standard errors calculated from the confidence intervals (see “Experimental Procedures”) for the fits are shown.
Both wortmannin and Akti markedly reduced steady-state kex values in the presence and absence of insulin. The inhibitory effect of Akti was less pronounced than the one observed with wortmannin (Fig. 5C). Treatment with wortmannin and Akti reduced basal kin values (Fig. 5D). However, the insulin-dependent reduction in kin was partially retained in the presence of Akti, suggesting that the insulin-stimulated decrease in GLUT4 internalization is independent of Akt.
To corroborate the steady-state kin values determined from antibody uptake experiments, an alternative experimental protocol was used to determine the same parameter. A more direct method that quantified the rate of loss of cell surface tagged GLUT4 was employed (Fig. 6A). This method confirmed a very rapid loss of surface GLUT4 in the basal state. kin values determined by fitting the direct measurements of GLUT4 internalization to Equation 5 closely matched those derived from the steady-state antibody uptake (Fig. 6B) and confirmed a decrease in kin in response to all three agonists.
FIGURE 6.

Direct measurements of steady-state GLUT4 internalization. A, L6 myotubes were maintained either in the basal steady state (♦) or in a steady state of stimulation with insulin (●), AICAR (■), or insulin plus AICAR (○). Anti-HA antibody was bound to cell surface GLUT4 at 4 °C; excess antibody was removed by washing, and then the cells were incubated for the indicated times at 37 °C. Surface-bound antibody was then removed, and the remaining antibody was detected with Alexa 488 secondary antibody. Results are the mean ± S.E. from 3 to 5 experiments. In some cases, error bars are smaller than the symbols. B, internalization kin rate constants from steady-state antibody uptake (dark bars) have been compared with the internalization assay measurements (light bars). Standard errors calculated from the confidence intervals (see “Experimental Procedures”) for the fits are shown.
The inhibitory effects of wortmannin and Akti on basal GLUT4 trafficking complicate the analysis and interpretation of whether these reagents have inhibitory effects on agonist-stimulated trafficking. In an attempt to separate out the inhibitory effects on basal trafficking from those on stimulated trafficking, all the steady-state parameters were calculated as a fold-change over basal (Fig. 7A). The clearest effect of insulin was to increase P by 2.9-fold. The effects on P were highly correlated with insulin-associated changes in kin. The insulin-dependent fold-change in kin was reversed by wortmannin treatment but was only partially reversed by Akti treatment (Fig. 7A).
FIGURE 7.

Rates and rate constants for GLUT4 steady-state internalization. A, to isolate effects associated with inhibitor action on kinetic parameters in the stimulated states, the fold-changes over basal levels were determined. B, steady-state transport rates, R = kinP. All calculations in A and B are mean values and S.E. from 3 to 7 experiments. Standard errors calculated from the confidence intervals (see “Experimental Procedures”) for the fits are shown.
We have also examined whether the amount of GLUT4 that is moved to and from the cell surface becomes limiting during responses to agonists. The transport rate (R) is a parameter that reflects the dependence of GLUT4 traffic on the GLUT4 mass that moves, as well as the time constant for movement. This parameter was calculated from the kinetic parameters measured in the antibody uptake assay (Equation 4). Interestingly, no major differences in GLUT4 traffic rates were apparent for any of the conditions studied (Fig. 7B).
DISCUSSION
In this study we have identified several novel aspects of membrane protein trafficking. We have found that GLUT4 recycling is considerably faster in the muscle cell line L6 than in adipocytes (1–5). Despite this, relatively low cell surface levels of GLUT4 are maintained in the basal state due to a very rapid rate of endocytosis. In contrast to adipocytes, where the predominant effect of insulin action is on GLUT4 exocytosis, in L6 cells insulin and AMPK agonists maintain enhanced plasma membrane GLUT4 levels largely by inhibiting GLUT4 endocytosis. This inhibition of endocytosis was independent of the Akt pathway. These data indicate that different cell types can coordinate a similar transient change in cell surface GLUT4 by targeting discrete limbs of the GLUT4 trafficking pathway. In addition, insulin stimulation and AMPK activation mobilize distinct pools of GLUT4 in L6 cells. Therefore, we suggest that L6 cells may represent a novel system for dissecting the mechanism of regulated GLUT4 endocytosis and studying the mechanism by which distinct signaling pathways differentially mobilize GLUT4.
Regulation of GLUT4 Endocytosis in Muscle
The trafficking of GLUT4 in L6 cells differs from that in adipocytes in two major respects. First, in the basal state the endocytosis rate constant is 2–3-times faster than in 3T3-L1 adipocytes. This suggests that different aspects of the GLUT4 trafficking itinerary can be discretely regulated in different cell types resulting in essentially the same outcome, which in this case is low expression of the transporter on the plasma membrane in the absence of insulin. The basal recycling rate of GLUT4 is faster in L6 than in 3T3-L1 adipocytes (5). If the basal endocytosis rate was similar in both cell types, a greater proportion of GLUT4 would be found at the plasma membrane in the basal state in L6 cells. However, L6 cells seem to have adapted to this situation by simply increasing the internalization of GLUT4. Thus, although it is uncertain if this situation mimics GLUT4 trafficking in skeletal muscle in vivo, particularly as we are using an artificial overexpression system, these studies highlight the enormous plasticity of the endosomal recycling system.
The second unique feature of GLUT4 trafficking in L6 cells is that agonists, including insulin and AMPK activators, maintain enhanced surface levels of GLUT4 in the steady state in large part by inhibiting endocytosis. This mechanism, which also exists in adipocytes (2, 4, 6), likely plays a greater role in L6 cells due to the relative basal recycling kinetics. It will be of interest to explore the mechanism for regulated endocytosis of GLUT4. GLUT4 internalization has been reported to occur by both clathrin-mediated and clathrin-independent routes in both 3T3-L1 adipocytes and L6 myoblasts (6, 10). It is unlikely that different agonists regulate GLUT4 endocytosis via independent mechanisms because we failed to observe additivity between different agonists. So far, an insulin-regulated signaling pathway that specifically targets GLUT4 endocytosis has not been reported. It does not appear to involve the Akt pathway because Akti did not overcome this inhibitory effect, consistent with previous studies in adipocytes (24). However, the effect was blocked by wortmannin. An alternative possibility is that slowing of endocytosis in response to insulin or other agonists may be a mass action, nonsignal-mediated phenomenon. This is supported by the steady-state transport rates (R, Fig. 7B), which were approximately the same in all conditions studied. In this model, the endocytosis rate may be operating close to its maximum capacity in the basal state. The increased delivery of GLUT4 to the plasma membrane that occurs in response to insulin and the other agonists may saturate this step causing accumulation of GLUT4 at this site. As such, the rate (as opposed to rate constant) of GLUT4 transport from the plasma membrane remains the same in basal and stimulated cells.
The reduction in GLUT4 endocytosis with insulin contrasts with previous studies (9, 10) where no insulin effect on GLUT4 internalization was reported in L6 myoblasts. Although we cannot be certain of the nature of this discrepancy, one major difference is that in the previous study a 37 °C wash step was used between incubation with the GLUT4 labeling antibody at 4 °C and commencement of the internalization assay. In our study, we initiated internalization by immediate substitution of the cold antibody-labeling buffer with prewarmed buffer followed by continuous incubation at 37 °C. In view of the greater difference in the initial data points in the internalization experiment in these cells, omitting just 1–2 min of the initial internalization experiment, as is likely the case in the previous study (10), may bias the fitting of the data and reduce the difference in the rate constants obtained. We were also able to verify our findings of an inhibitory effect with both insulin and AMPK agonists using two different methods for measuring endocytosis adding further support to our data. In both cases we observed a similar degree of inhibition of GLUT4 endocytosis with insulin and AICAR.
Mobilization of GLUT4 Intracellular Pools in Muscle
We have previously suggested that there are at least two ways in which the delivery of GLUT4 to the plasma membrane may be increased as follows: either by increasing the rate of exocytosis and/or by increasing the amount of GLUT4 located in the recycling system. In adipocytes, both of these parameters are regulated by insulin (5, 25), whereas in L6 cells insulin has little effect on the exocytic rate as analyzed with a two-compartmental model. It should be noted that an insulin effect selectively on the exocytic specialized pool of GLUT4 might be masked by the high basal recycling. Regardless we clearly observed an increase in the total recycling pool of GLUT4 in response to both insulin and AMPK agonists. Partial or incomplete mobilization of GLUT4 has been reported in 3T3-L1 cells (5). Similarly in L6 cells, incubated under basal conditions, the entire cellular pool of GLUT4 does not reach the cell surface even over time courses extending to several hours. The size of the basal recycling pool is much more considerable in L6 cells (61%) compared with basal 3T3-L1 adipocytes (≈10%). Although some studies have reported higher basal rates of GLUT4 recycling in adipocytes, even here this effect was smaller than we observe in L6 cells in this study (25).
One of the key features of GLUT4 traffic in L6 myotubes revealed by our kinetic study is the additivity observed in the response to combined stimulation with insulin and AMPK agonists. This is apparent by the relative pool size of GLUT4 that can be mobilized in response to these stimuli. The recycling GLUT4 pool in the presence of the AMPK activators and insulin is much greater than each agonist alone, indicating that these agonists do not use a convergent signaling mechanism to mobilize GLUT4. Additivity in glucose transport responses to insulin and AMPK has been reported in a range of muscle types (8, 11, 26–29), and our current studies suggest that part of this effect could be associated with different processes that regulate GLUT4 retention that are downstream of the insulin and AMPK signaling systems. This could involve physically distinct pools of GLUT4 as reported previously (30, 31), although more recent studies in cardiomyocytes have been unable to replicate these findings (32). Alternatively, GLUT4 may be retained in a similar location but by separate molecular mechanisms possibly involving effectors such as the TBC proteins TBC1D1 and AS160/TBC1D4, which may uniquely respond to either AMPK or insulin, respectively (33).
In conclusion, studies on a wide range of kinetic parameters for GLUT4 traffic in muscle are essential as stimulatory agonists have multiple effects. Muscle cells appear to have built up a range of mechanisms to increase cell surface GLUT4 levels so that they can respond differently to hormones and metabolic changes. These include diverse mechanisms for mobilization of intracellular GLUT4 and for slowing GLUT4 internalization. It seems unlikely that a single convergent step can account for the range of GLUT4 trafficking changes observed. This diversity in end point mechanisms for increasing cell surface GLUT4 has implications in the design of appropriate therapies for treatment of insulin resistance.
Acknowledgments
We thank Dr. Peter Shepherd and Symansis for providing the Akt inhibitory molecule Akti and Dr. Kei Sakamoto for supplying the AMPK activator A-769662.
This work was supported by grants from the National Health and Medical Research Council of Australia (to J. S. and D. E. J.), by grants from the Medical Research Council United Kingdom, the Wellcome Trust (to G. D. H.), and a CASE studentship from AstraZeneca (to D. J. F.).
- AMPK
- AMP-activated protein kinase
- PBS
- phosphate-buffered saline
- AICAR
- 5-aminoimidazole-4-carboxyamide ribonucleoside
- Akti
- Akt inhibitor
- HA
- hemagglutinin.
REFERENCES
- 1.Satoh S., Nishimura H., Clark A. E., Kozka I. J., Vannucci S. J., Simpson I. A., Quon M. J., Cushman S. W., Holman G. D. (1993) J. Biol. Chem. 268, 17820–17829 [PubMed] [Google Scholar]
- 2.Jhun B. H., Rampal A. L., Liu H., Lachaal M., Jung C. Y. (1992) J. Biol. Chem. 267, 17710–17715 [PubMed] [Google Scholar]
- 3.Yang J., Holman G. D. (1993) J. Biol. Chem. 268, 4600–4603 [PubMed] [Google Scholar]
- 4.Karylowski O., Zeigerer A., Cohen A., McGraw T. E. (2004) Mol. Biol. Cell 15, 870–882 [DOI] [PMC free article] [PubMed] [Google Scholar]
- 5.Govers R., Coster A. C., James D. E. (2004) Mol. Cell. Biol. 24, 6456–6466 [DOI] [PMC free article] [PubMed] [Google Scholar]
- 6.Blot V., McGraw T. E. (2006) EMBO J. 25, 5648–5658 [DOI] [PMC free article] [PubMed] [Google Scholar]
- 7.Karlsson H. K., Chibalin A. V., Koistinen H. A., Yang J., Koumanov F., Wallberg-Henriksson H., Zierath J. R., Holman G. D. (2009) Diabetes 58, 847–854 [DOI] [PMC free article] [PubMed] [Google Scholar]
- 8.Yang J., Holman G. D. (2005) J. Biol. Chem. 280, 4070–4078 [DOI] [PubMed] [Google Scholar]
- 9.Wijesekara N., Tung A., Thong F., Klip A. (2006) Am. J. Physiol. Endocrinol. Metab. 290, E1276–E1286 [DOI] [PubMed] [Google Scholar]
- 10.Antonescu C. N., Díaz M., Femia G., Planas J. V., Klip A. (2008) Traffic 9, 1173–1190 [DOI] [PubMed] [Google Scholar]
- 11.Hayashi T., Hirshman M. F., Kurth E. J., Winder W. W., Goodyear L. J. (1998) Diabetes 47, 1369–1373 [DOI] [PubMed] [Google Scholar]
- 12.Kurth-Kraczek E. J., Hirshman M. F., Goodyear L. J., Winder W. W. (1999) Diabetes 48, 1667–1671 [DOI] [PubMed] [Google Scholar]
- 13.Yang J., Holman G. D. (2006) Endocrinology 147, 2728–2736 [DOI] [PubMed] [Google Scholar]
- 14.Kramer H. F., Witczak C. A., Fujii N., Jessen N., Taylor E. B., Arnolds D. E., Sakamoto K., Hirshman M. F., Goodyear L. J. (2006) Diabetes 55, 2067–2076 [DOI] [PubMed] [Google Scholar]
- 15.Buhl E. S., Jessen N., Schmitz O., Pedersen S. B., Pedersen O., Holman G. D., Lund S. (2001) Diabetes 50, 12–17 [DOI] [PubMed] [Google Scholar]
- 16.Koistinen H. A., Galuska D., Chibalin A. V., Yang J., Zierath J. R., Holman G. D., Wallberg-Henriksson H. (2003) Diabetes 52, 1066–1072 [DOI] [PubMed] [Google Scholar]
- 17.Guigas B., Sakamoto K., Taleux N., Reyna S. M., Musi N., Viollet B., Hue L. (2009) IUBMB Life 61, 18–26 [DOI] [PMC free article] [PubMed] [Google Scholar]
- 18.Cool B., Zinker B., Chiou W., Kifle L., Cao N., Perham M., Dickinson R., Adler A., Gagne G., Iyengar R., Zhao G., Marsh K., Kym P., Jung P., Camp H. S., Frevert E. (2006) Cell Metab. 3, 403–416 [DOI] [PubMed] [Google Scholar]
- 19.Shewan A. M., van Dam E. M., Martin S., Luen T. B., Hong W., Bryant N. J., James D. E. (2003) Mol. Biol. Cell 14, 973–986 [DOI] [PMC free article] [PubMed] [Google Scholar]
- 20.Coster A. C., Govers R., James D. E. (2004) Traffic 5, 763–771 [DOI] [PubMed] [Google Scholar]
- 21.Randhawa V. K., Thong F. S., Lim D. Y., Li D., Garg R. R., Rudge R., Galli T., Rudich A., Klip A. (2004) Mol. Biol. Cell 15, 5565–5573 [DOI] [PMC free article] [PubMed] [Google Scholar]
- 22.Li D., Randhawa V. K., Patel N., Hayashi M., Klip A. (2001) J. Biol. Chem. 276, 22883–22891 [DOI] [PubMed] [Google Scholar]
- 23.Henriksen E. J., Rodnick K. J., Mondon C. E., James D. E., Holloszy J. O. (1991) J. Appl. Physiol. 70, 2322–2327 [DOI] [PubMed] [Google Scholar]
- 24.Gonzalez E., McGraw T. E. (2006) Mol. Biol. Cell 17, 4484–4493 [DOI] [PMC free article] [PubMed] [Google Scholar]
- 25.Muretta J. M., Romenskaia I., Mastick C. C. (2008) J. Biol. Chem. 283, 311–323 [DOI] [PubMed] [Google Scholar]
- 26.Bergeron R., Russell R. R., 3rd, Young L. H., Ren J. M., Marcucci M., Lee A., Shulman G. I. (1999) Am. J. Physiol. 276, E938–E944 [DOI] [PubMed] [Google Scholar]
- 27.Fisher J. S., Gao J., Han D. H., Holloszy J. O., Nolte L. A. (2002) Am. J. Physiol. Endocrinol. Metab 282, E18–E23 [DOI] [PubMed] [Google Scholar]
- 28.Gao J., Ren J., Gulve E. A., Holloszy J. O. (1994) J. Appl. Physiol. 77, 1597–1601 [DOI] [PubMed] [Google Scholar]
- 29.Rodnick K. J., Henriksen E. J., James D. E., Holloszy J. O. (1992) Am. J. Physiol. 262, C9–C14 [DOI] [PubMed] [Google Scholar]
- 30.Ploug T., van Deurs B., Ai H., Cushman S. W., Ralston E. (1998) J. Cell Biol. 142, 1429–1446 [DOI] [PMC free article] [PubMed] [Google Scholar]
- 31.Lemieux K., Han X. X., Dombrowski L., Bonen A., Marette A. (2000) Diabetes 49, 183–189 [DOI] [PubMed] [Google Scholar]
- 32.Fazakerley D. J., Lawrence S. P., Lizunov V. A., Cushman S. W., Holman G. D. (2009) J. Cell Sci. 122, 727–734 [DOI] [PMC free article] [PubMed] [Google Scholar]
- 33.Chen S., Murphy J., Toth R., Campbell D. G., Morrice N. A., Mackintosh C. (2008) Biochem. J. 409, 449–459 [DOI] [PubMed] [Google Scholar]