Abstract
We identified a sequence homologous to the Bcl-2 homology 3 (BH3) domain of Bcl-2 proteins in SOUL. Tissues expressed the protein to different extents. It was predominantly located in the cytoplasm, although a fraction of SOUL was associated with the mitochondria that increased upon oxidative stress. Recombinant SOUL protein facilitated mitochondrial permeability transition and collapse of mitochondrial membrane potential (MMP) and facilitated the release of proapoptotic mitochondrial intermembrane proteins (PMIP) at low calcium and phosphate concentrations in a cyclosporine A-dependent manner in vitro in isolated mitochondria. Suppression of endogenous SOUL by diced small interfering RNA in HeLa cells increased their viability in oxidative stress. Overexpression of SOUL in NIH3T3 cells promoted hydrogen peroxide-induced cell death and stimulated the release of PMIP but did not enhance caspase-3 activation. Despite the release of PMIP, SOUL facilitated predominantly necrotic cell death, as revealed by annexin V and propidium iodide staining. This necrotic death could be the result of SOUL-facilitated collapse of MMP demonstrated by JC-1 fluorescence. Deletion of the putative BH3 domain sequence prevented all of these effects of SOUL. Suppression of cyclophilin D prevented these effects too, indicating that SOUL facilitated mitochondrial permeability transition in vivo. Overexpression of Bcl-2 and Bcl-xL, which can counteract the mitochondria-permeabilizing effect of BH3 domain proteins, also prevented SOUL-facilitated collapse of MMP and cell death. These data indicate that SOUL can be a novel member of the BH3 domain-only proteins that cannot induce cell death alone but can facilitate both outer and inner mitochondrial membrane permeabilization and predominantly necrotic cell death in oxidative stress.
Keywords: Apoptosis, BH3 Domain, SOUL Protein, Mitochondrial Membrane Potential, Necrosis, Oxidative Stress
Introduction
We have previously observed that heme-binding protein 2/SOUL facilitates mitochondrial permeability transition and cell death without affecting reactive oxygen production (1). A data base search indicated that heme-binding protein 2/SOUL has a BH32 domain-like structure. BH3 domain-only proteins play a significant role in the processes of cell death and survival (2, 3). Mammalian cells express a group of evolutionarily conserved proteins known as the Bcl-2 (B-cell-associated leukemia protein 2) family. The effect of Bcl-2 proteins on the apoptotic process is due to the presence of one or more conserved regions of amino acid sequences, known as Bcl-2 homology (BH) domains. Based on their function, Bcl-2 proteins can have either proapoptotic (Bax, Bad, Bak, Bim, and Bid) or antiapoptotic (Bcl-2 and Bcl-xL) properties. All antiapoptotic Bcl-2-related proteins described to date contain BH1, BH2, and sometimes BH4 domains in addition to the BH3 domain (4–6). Proapoptotic family members either share the multidomain structure (e.g. Bax and Bak) or contain only the BH3 domain (e.g. Bim and Bid). Bcl-2 proteins containing only the BH3 domain have been suggested to play an important role in initiating mitochondrial-mediated apoptosis (7–9). Proapoptotic BH3 domain-containing proteins are generally regarded as latent death factors that are normally held in check and must be activated to exhibit their death-inducing functions. Several mechanisms appear to contribute to the activation of the prodeath function of Bcl-2 family proteins. Bax undergoes conformational changes, relocates to mitochondria, may oligomerize with other Bax molecules in the mitochondrial membrane, and can be cleaved by calpain to enhance its proapoptotic effects (10, 11). Bid and Bim share a common mode of action via BH3-domain-mediated binding to Bax-type proteins at the outer mitochondrial membrane (12). This physical interaction is believed to trigger a conformational change of the multidomain proapoptotic members, resulting in their intramembranous oligomerization and permeabilization of the outer mitochondrial membrane (13). In addition, interactions between proapoptotic Bcl-2 family members and lipid bilayers have an important contribution to this process. Specific lipids can promote the membrane association of activated forms of Bax and Bid and can induce mitochondrial cyt-c release (14). Specifically, cardiolipin increases binding of both cBid and tBid to pure lipid vesicles as well as to the outer mitochondrial membranes (15), and myristoylation of tBid further enhances its membrane avidity (16). Furthermore, other possible mechanisms of action have been proposed for proapoptotic BH3 domain-only proteins, including (i) binding to and neutralization or reversal of prosurvival Bcl-2-type family member functions (3) and (ii) modulation of resident mitochondrial channels, such as voltage-dependent anion channel (VDAC) and adenine nucleotide translocator (17). It was demonstrated that VDACs are not an absolutely necessary component of the mitochondrial permeability transition (mPT) complex (18), but when VDAC is present, it can play a role in the regulation of mPT (19–21). There are data indicating that proapoptotic Bcl-2 homologues can activate mPT in oxidative, stress showing that an oxidant-damaged mitochondrial membrane system can react differently to BH3 domain proteins (21–24). In addition, the oligomer Bax alone can induce mitochondrial permeability transition and complete cytochrome c release without oxidative stress, indicating that under certain conditions, BH3 domain proteins can contribute to mitochondrial inner membrane permeabilization, mPT, and necrotic death (20–25).
It was also demonstrated that antiapoptotic Bcl-xL can bind to the VDAC-1 barrel laterally at strands 17 and 18 and can influence mitochondrial permeabilization (26–28). Therefore, antiapoptotic Bcl-2 protein can also influence (protect) the inner mitochondrial system, probably via interaction with VDAC (26, 28–30).
The presence of a BH3 domain in SOUL and the above data indicate that this protein besides binding heme may have a role in the processes of cell death and survival. In the present paper, we provide evidence for the sensitization effect of SOUL in hydrogen peroxide-induced cell death, the facilitation of the release of proapoptotic mitochondrial proteins, and the promotion of the collapse of mitochondrial membrane potential (MMP) both in living cells and in vitro in isolated mitochondria. We show that SOUL promotes the permeabilization of both outer and inner mitochondrial membranes in oxidative stress and that its effect can be reversed by deleting the putative BH3 sequence from SOUL as well as by inhibition of mitochondrial permeability transition either by cyclophilin D suppression or overexpression of antiapoptotic Bcl-2 members.
EXPERIMENTAL PROCEDURES
All of the chemicals for cell culture, cyclosporine A (CsA), 3-(4,5-dimethylthiazol-2-yl)-2,5-diphenyltetrazolium bromide (MTT), propidium iodide (PI), and rhodamine-1,2,3 (Rh-123) were purchased from Sigma. Fluorescent dyes 5,5′,6,6′-tetracloro-1,1′,3,3′-tetraethyl-benzimidazolyl-carbocyanine iodide (JC-1) and fluorescein-conjugated annexin V were from Molecular Probes (Leiden, Netherlands). The following antibodies were used: anti-rabbit IgG (Sigma) anti-cytochrome c monoclonal antibody (BD Pharmingen), and anti-AIF and anti-endonuclease G polyclonal antibodies (Oncogene, San Diego, CA). Anti-cyclophilin D mouse monoclonal antibody was from Merck, and anti-Smac/DIABLO (mitochondria-derived activator of caspase/direct IAP (inhibitors of apoptosis proteins)-binding protein with low pI) rabbit polyclonal antibody was from ProSci Inc. (Poway, CA). Hoechst 33342 was from Cambrex Bio Science (Rockland, ME), mammalian vector pcDNA3.1 was purchased from Invitrogen, and pEGFP-C1 vector was from BD Biosciences. Human tissues from patients were provided by the Medical University of Pécs Department of Pathology and Oncotherapy. Cyclophilin D silencer (CycD siRNA) was purchased from Ambion Applied Biosystems (Foster City, CA). Bcl-2- and Bcl-xL-overexpressing clones were ordered from RZPD GmbH (Berlin, Germany), ΔBH3-SOUL plasmid was ordered from MrGene.com (Mr. Gene GmbH, Regensburg, Germany). All tissue samples were obtained after approval by the local ethics committee.
Blood and Tissue Samples
Specimens (n = 39) were collected from different types of human tissues. After homogenization by Ultra-Turrax in standard Laemmli sample solution containing 1 mm phenylmethylsulfonyl fluoride, all of the samples were centrifuged (10,000 × g for 10 min), and the supernatants were measured by BCA reagent assay and equalized for 1 mg/ml protein content. All samples were stored at −20 °C until assay.
Cell Culture and Sample Preparation
NIH3T3 and HeLa cells were purchased from the American Type Culture Collection (Manassas, VA). All cell lines were maintained in Dulbecco's modified Eagle's medium supplemented with 10% fetal calf serum, 2 units/ml penicillin/streptomycin mixture (Flow Laboratories, Rockville, MD), and incubated in 5% CO2, 95% air at 37 °C. Cells were harvested and centrifuged at low speed, and then the pellet was dispersed by vortexing in lysis buffer (50 mm Tris, pH 7.4, 1 mm phenylmethylsulfonyl fluoride) for 10 min at 4 °C. After further cell disruption in a Teflon/glass homogenizer, the homogenate was pelleted, and the supernatant was measured by BCA reagent and equalized for 1 mg/ml protein content in Laemmli solution for Western blotting.
Western Blot Analysis
20 ng/lane protein of tissue, cell culture, or mitochondrion samples was subjected to 12% (w/v) SDS-PAGE (Bio-Rad). Immunoblots were blocked and developed with self-developed anti-SOUL polyclonal rabbit primary antibody (1) or polyclonal antibodies against the signal transduction pathway proteins followed by horseradish peroxidase-labeled secondary IgG as described by Sambrook et al. (31). Protein bands were revealed by the ECL system. All experiments were repeated four times.
Construction of Bacterial SOUL or ΔBH3-SOUL Expression Plasmids
The whole open reading frame of SOUL was cloned into pGEX-4T-1 expression vector (Amersham Biosciences), pcDNA3.1 (Invitrogen), and pEGFP-C1 (BD Biosciences) mammalian vectors. ΔBH3-SOUL was cloned into pcDNA3.1.
Stable Transfection
Full-length SOUL or ΔBH3-SOUL cDNA was PCR-amplified, and the construct was subcloned into a pcDNA3.1 vector. The vector-containing SOUL or ΔBH3-SOUL or the empty pcDNA3.1 vector was transfected into NIH3T3 cells with Lipofectamine 2000 according to the manufacturer's protocol (Invitrogen). Cells were then grown in selective medium (10% fetal calf serum, Dulbecco's modified Eagle's medium containing 500 μg/ml G418). Cell clones were subsequently screened by Western blot analysis with anti-SOUL polyclonal antibody for an increase in SOUL or ΔBH3-SOUL protein expression relative to that in the pcDNA-transfected cells. SOUL- or ΔBH3-SOUL-overexpressing clones were selected for further experiments.
Suppression of SOUL Expression by Diced siRNA Technique
The whole coding sequence was PCR-amplified, double-stranded RNA was generated by the BLOCK-IT RNAi TOPO transcription kit, the double-stranded RNA was diced by the BLOCK-IT dicer RNAi transfection kit, and the result was diced small interfering RNA. The whole procedure was done according to the manufacturer's protocol (Invitrogen). HeLa cells were transiently transfected with the dsiRNA in OPTI-MEM I reduced serum medium (Invitrogen) using Lipofectamine 2000 (Invitrogen). The effect of suppression was tested by Western blotting using polyclonal anti-SOUL primary antibody.
Cell Viability Assay
Cells were seeded into 96-well plates at a starting density of 104 cells/well and cultured overnight before H2O2 or CsA was added to the medium at the concentration and composition indicated in the figure legends and under “Results.” After culturing, the media were removed and replaced with Dulbecco's modified Eagle's medium containing an appropriate amount of MTT solution (Chemicon Inc., El Segundo, CA) for 4 h. The MTT reaction was terminated by adding HCl to the medium at a final concentration of 10 mm. The amount of water-insoluble blue formasan dye formed from MTT was proportional to the number of living cells and was determined by an Anthos Labtech 200 enzyme-linked immunosorbent assay reader at a 550-nm wavelength after dissolving the blue formasan precipitate in 10% SDS. All experiments were run in at least four parallels and repeated three times.
Caspase Activity Assay
2 × 10⁶ SOUL-pcDNA or pcDNA- transfected NIH3T3 cells were treated with 300 μm H2O2 for 12 h. The cells were collected by centrifugation, washed twice with ice-cold phosphate-buffered saline, and resuspended in 50 μl of ice-cold lysis buffer (1 mm dithiothreitol, 0.05% Nonidet P-40, in 50 mm Tris, pH 7.5), kept on ice for 30 min, and centrifuged at 13,000 × g for 15 min at 4 °C. 40 μg of protein was incubated with 50 μm caspase substrate (Ac-DEVD-7-amino-4-methylcoumarin) in triplicates in a 96-well plate in a final volume of 150 μl for 3 h at 37 °C. Fluorescence was monitored by a fluorescent ELISA reader at excitation and emission wavelengths of 360 and 460 nm, respectively.
Fluorescent Microscopy
Nuclear morphology was observed after staining with 10 mm Hoechst 33342 (Cambrex Bio Science) and 1 mm PI, as described previously (32). NIH3T3 cells transfected with empty, SOUL- or ΔBH3-SOUL-expressing pcDNA3.1 vectors were seeded to coverslips at a starting density of 1 × 10⁶ cells/well in a 6-well plate. After subjecting the cells to the appropriate treatment indicated in the figure legends, coverslips were rinsed twice in phosphate-buffered saline and then were put upside down onto a silicon isolator placed on top of a microscope slide to create a small chamber, which was filled with phosphate-buffered saline supplemented with 0.5% fetal calf serum and containing 5 μg/ml JC1-dye (Molecular Probes). The same microscopic field was imaged, first with 546-nm bandpass excitation and >590-nm emission (red) and then with 450–490-nm excitation and >520-nm emission (green). A green filter setup was used for detecting GFP fluorescence. An Olympus BX61 fluorescent microscope equipped with ColorView CCD camera and analysis software was used with a ×60 objective and epifluorescent illumination. Under these conditions, we did not observe considerable bleed-through between the red and green images.
Isolation of Mitochondria
Rats were sacrificed, and the mitochondria were isolated from the liver by differential centrifugation as described by a standard protocol (33). All isolated mitochondria were purified by Percoll gradient centrifugation (34), and the mitochondrial protein concentrations were determined by the biuret method with bovine serum albumin as a standard. Mitochondrial membrane potential (Δψ) was monitored by fluorescence of Rh-123, released from the mitochondria following the induction of mPT at room temperature using a PerkinElmer Life Sciences fluorimeter at an excitation wavelength of 495 and an emission wavelength of 535 nm. Briefly, mitochondria at a concentration of 1 mg of protein/ml were preincubated in the assay buffer (70 mm sucrose, 214 mm mannitol, 20 mm Hepes, 5 mm glutamate, 0.5 mm malate, 0.5 mm phosphate) containing 1 μm Rh-123 and recombinant SOUL for 60 s. Alteration of the Δψ was induced by the addition of calcium at the indicated concentrations. Changes of fluorescence intensity were detected for 4 min. The results are demonstrated by representative original registration curves from five independent experiments, each repeated three times.
Detection of Mitochondrial Protein Release
Detection of the release of rat liver mitochondrial proapoptotic proteins in vitro was performed as described previously (35). Samples from the cuvette were taken 20 min after the induction of the permeability transition by Ca2+, with CsA or SOUL present at the indicated concentration, and centrifuged at 13,000 rpm for 15 min. Pellets and supernatants were analyzed for cyt-c, AIF, and Endo G. Equal amounts of proteins were separated by a 12% polyacrylamide gel for the detection of AIF and Endo G and by an 18% polyacrylamide gel for the detection of cytochrome c. Western blots were prepared as described before (35). Results are demonstrated by a photomicrograph of a representative blot of three independent experiments.
Flow Cytometry Analysis
Cell death was induced with 300 μm hydrogen peroxide (Sigma) for 24 h in sham-transfected or SOUL-overexpressing NIH3T3 cells. They were either co-overexpressing or not co-overexpressing Bcl-2 or Bcl-xL proteins or were pretreated with 30 nm anti-cyclophilin D siRNA for 24 h. After treatment, cells were rinsed and harvested. The annexin V FLUOS staining kit (Roche Applied Science) was used to stain cells with fluorescent isothiocyanate-conjugated annexin V and PI according to the manufacturer's protocol. The cells were analyzed by flow cytometry on a BD FacsCalibur flow cytometer (BD Biosciences). Quadrant dot plots were created by Cellquest software (BD Biosciences) to identify living and necrotic cells and cells in the early or late phase of apoptosis (36). Cells in each category are expressed as a percentage of the total number of stained cells counted and are presented as pie charts.
RESULTS
Characterization of SOUL Protein
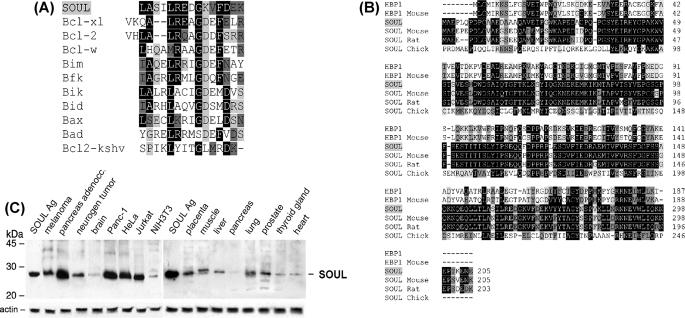
NCBI data base analysis showed that there is a BH3 domain in SOUL protein, which is a member of the heme-binding protein family. A multiple alignment of the BH3 domains of Bcl-2-associated proteins show high homology to a sequence found in SOUL (Fig. 1A). The gene was mapped to chromosome 6 (6q24), and it was found to have a close relation to heme binding-related proteins, such as “heme-binding protein 1” (AAP35958.1; 28% identity, 46% similarity) and to other yet uncharacterized or unnamed proteins. SOUL was found to have homologues in different species as well (Fig. 1B). The gene is made up of four exons. Analyzing the amino acid sequence, we found that SOUL did not have a heme-regulated motif (37), but several hydrophobic amino acid segments seem to suggest that these regions may be involved in heme binding (38). By searching for the related expressed sequence tag sequences in GenBankTM, it could be assumed that SOUL mRNA is expressed mainly in retina, prostate, pancreas, placenta, lung, brain, and uterus, but in small amounts, it is expressed in many different tissues.
FIGURE 1.
Sequence properties and expression of SOUL. A, comparison of the BH3 domains among SOUL and Bcl-2 family members. Black-shaded amino acids are identical, dark gray-shaded amino acids are conserved substitutions, and light gray-shaded amino acids are semiconserved substitutions. Sequences of Bcl-xL, Bcl-2, Bcl-W, Bim, Bfk, Bik, Bid, Bax, Bad, and Bcl-2-KSHV proteins were accessed from the NCBI Protein data base. B, multiple-sequence alignment of SOUL and heme-binding protein 1 of representative vertebrates. HBP1, human heme-binding protein 1 (AAF89618); HBP1-Mouse, murine heme-binding protein 1 (NP_038574); SOUL-Mouse, murine SOUL protein (NP_062360); SOUL-Rat, rodent SOUL protein (XP_218664); SOUL-Chick, avian SOUL protein (NP_990120). Sequences were accessed from the NCBI Protein data base and were aligned using the ClustalW algorithm. Black-shaded amino acids are identical residues, dark gray-shaded amino acids are conserved substitutions, and light gray-shaded amino acids are semiconserved substitutions. C, expression of SOUL protein in cell lines and human tissues. Human tissue extracts were electrophoresed on 12% (w/v) SDS-PAGE. A single band was detected at 28 kDa by Western blot analysis using anti-SOUL antiserum developed in rabbits as primary antibody and horseradish peroxidase-labeled anti-rabbit IgG as secondary antibody. Protein bands were revealed by the ECL chemiluminescence system. A representative loading control developed for actin is shown below each blot. The positions of molecular mass markers are displayed on the left. Each lane contains 10 ng of total protein derived from the indicated tissues. The lanes of the left blot show the following (from left to right): SOUL antigen, melanoma, pancreas adenocarcinoma, neurogenic tumor, brain, Panc-1, HeLa, Jurkat, and NIH3T3 cell lines. The lanes of the right blot show the following (from left to right): SOUL antigen, placenta, muscle, liver, pancreas, lung, prostate, thyroid gland, and heart. Photomicrographs demonstrate representative blots of three independent experiments.
To detect SOUL protein in different types of tissues, we developed anti-SOUL, as was described earlier (1). Using the purified anti-SOUL antibody, different levels of SOUL expression were identified in human tissue samples, and it could be detected in some malignant tissues too (Fig. 1C). Higher concentrations of the protein were expressed (e.g. in certain lymphomas or in pancreatic tumors). We selected the NIH3T3 mouse fibroblast cell line that contained virtually no SOUL for overexpression studies.
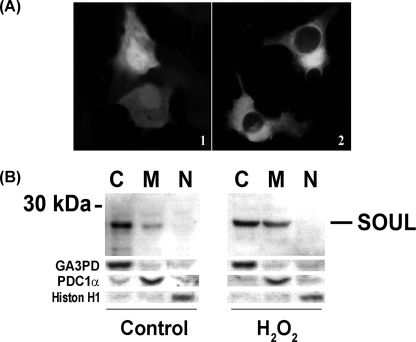
To analyze the subcellular distribution of SOUL, we performed confocal microscopy using NIH3T3 cells transfected with pEGFP-C1 plasmid containing the full-length SOUL open reading frame. We found SOUL-GFP to be localized to the cytoplasm of the cells unlike GFP alone, which was localized mainly to the nucleus and to a smaller extent to the cytoplasm (Fig. 2A). However, as we previously published (1), it had marked effects in isolated mitochondria, suggesting a significant mitochondrial localization of the protein. To demonstrate the redistribution of SOUL during the cell death process, we performed immunoblot experiments on fractionated HeLa cells treated or not with 300 μm H2O2 for 24 h. Fig. 2B shows that in untreated HeLa cells, SOUL was mainly present in the cytoplasm, but to a smaller extent it was also detected in the mitochondrial fraction. However, upon prolonged exposure to oxidative stress, there was a significant increase of SOUL protein in the mitochondrial subfraction of the cells accompanied by a slight decrease in the cytosolic fraction. This finding indicates that in response to oxidative stress, SOUL can relocate to the mitochondria.
FIGURE 2.
Intracellular localization of SOUL. A, immunofluorescent confocal microscopy analysis of GFP-SOUL in NIH3T3 cells. Cells were transfected with pEGFP-C1 plasmid containing the full-length SOUL open reading frame (2) or with pEGFP-C1 plasmid alone (1). Representative images of three independent experiments are presented. B, Western blot analysis of cytosolic (C), mitochondrial (M), and nuclear (N) fractions of HeLa cells treated (H2O2) or not (Control) with 100 μm H2O2 for 24 h. Western blotting was performed as described previously utilizing respective primary antibodies recognizing SOUL, the cytosolic marker glyceraldehyde-3-phosphate dehydrogenase (GA3PD), the mitochondrial marker pyruvate decarboxylase-1α (PDC-1α), and the nuclear marker histone H1 (Histon H1). Photomicrographs demonstrate representative blots of three independent experiments.
Effect of SOUL on Release of Mitochondrial Intermembrane Proteins in Oxidative Stress
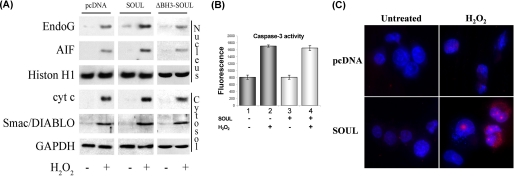
To test the SOUL protein's effect on mitochondria, first we transfected NIH3T3 cells with control vector or SOUL cDNA-containing vector and then treated them with 300 μm hydrogen peroxide for 24 h. Translocations of AIF and Endo G to the nucleus and release of cyt-c and Smac/DIABLO to the cytosol in response to H2O2 treatment were detected by Western blot after isolating cellular subfractions. Hydrogen peroxide induced the release of AIF, Endo G, cyt-c, and Smac/DIABLO. Although SOUL alone had only a slight effect on the release, in the presence of hydrogen peroxide, SOUL overexpression further increased the release of these proapoptotic intermembrane proteins (Fig. 3A). Caspase-3 activation was determined with fluorescent caspase-3 substrate (Ac-DEVD-7-amino-4-methylcoumarin). Hydrogen peroxide alone increased caspase-3 activity (Fig. 3B), but SOUL overexpression did not induce any further increase in caspase-3 activation. SOUL overexpression promoted hydrogen peroxide- induced cell death, which was predominantly necrotic, as indicated by the enhanced staining of the nucleus by propidium iodide (Fig. 3C).
FIGURE 3.
Mechanism of SOUL-facilitated cell death in vivo. A, translocations of AIF, Endo G, cyt-c, and Smac/DIABLO were detected by Western blotting after isolating cellular subfractions. Control SOUL- and ΔBH3-SOUL-overexpressing cells were treated or not with 100 μm H2O2 for 24 h. Glyceraldehyde-3-phosphate dehydrogenase (GAPDH) and histone H1 (Histon H1) were used as loading controls for the cytosolic and nuclear fraction, respectively. Photomicrographs demonstrate representative blots of three independent experiments. B, caspase-3 activation in SOUL-overexpressing cells. Cell death was induced by administering 500 μm H2O2 for 12 h in mock-transfected (dark gray bars; 1 and 2) and SOUL-overexpressing (light gray bars; 3 and 4) cells, and then the activity of caspase-3 was detected by using a fluorescent caspase-3 substrate, Ac-DEVD-7-amino-4-methylcoumarin. Values are means ± S.E. of three experiments. C, increase in H2O2-induced nuclear fragmentation. Mock-transfected (pcDNA) and NIH3T3 cells transfected with pcDNA3.1 vector subcloned with full-length SOUL cDNA (SOUL) were plated and treated or not with 1 mm H2O2 for 24 h and then were stained with Hoechst 33342 (blue) and propidium iodide (red) dyes. Representative images of three independent experiments are presented.
Effect of SOUL on the mPT and Δψ in Vitro
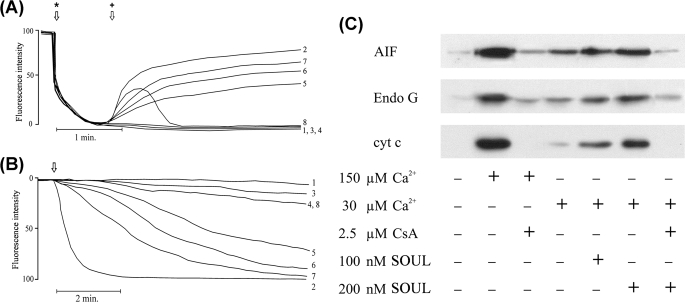
In order to demonstrate the direct effect of SOUL on mitochondrial permeability transition, we monitored Δψ and mitochondrial swelling from isolated, Percoll gradient-purified rat liver mitochondria. Supplemented calcium (150 μm) induced the decrease of the Δψ, as detected by the release of the membrane potential-sensitive dye, Rh-123, from isolated liver mitochondria (Fig. 4A, line 2). SOUL alone at different concentrations did not induce the dissipation of Δψ; however, SOUL induced the decrease of Δψ in the 50–400 nm concentration range in the presence of 30 μm Ca2+, a calcium concentration that was not sufficient to induce loss of Δψ when added alone. The loss of Δψ was dependent on the concentration of SOUL and was prevented by CsA (Fig. 4A). These findings were consistent with our data obtained under in vivo conditions.
FIGURE 4.
Effect of recombinant SOUL on permeability transition and mitochondrial membrane potential in isolated mitochondria. A, membrane potential was monitored by measuring the fluorescent intensities of the cationic fluorescent dye Rh-123. Isolated rat liver mitochondria added at the first arrow (*) took up the dye in a voltage-dependent manner and quenched its fluorescence. SOUL at the concentrations indicated together with 30 μm Ca2+ or 150 μm Ca2+ added at the second arrow (+) facilitated depolarization, resulting in release of the dye and an increase of fluorescence intensity. Line 1, no agent; line 2, 150 μm Ca2+; line 3, 30 μm Ca2+; line 4, 200 nm SOUL; line 5, 50 nm SOUL plus 30 μm Ca2+; line 6, 100 nm SOUL plus 30 μm Ca2+; line 7, 200 nm SOUL plus 30 μm Ca2+; line 8, 200 nm SOUL plus 2.5 μm CsA plus 30 μm Ca2+. Representative plots of three independent experiments are presented. B, permeability transition demonstrated by monitoring E540 in isolated rat liver mitochondria was induced by adding Ca2+ at the arrow. Line 1, no agent (base-line swelling); line 2, 150 μm Ca2+; line 3, 150 μm Ca2+ plus 2.5 μm CsA; line 4, 30 μm Ca2+; line 5, 50 nm SOUL plus 30 μm Ca2+; line 6, 100 nm SOUL plus 30 μm Ca2+; line 7, 200 nm SOUL plus 30 μm Ca2+; line 8, 200 nm SOUL plus 30 μm Ca2+ plus 2.5 μm CsA. Representative plots of three independent experiments are presented. C, effect of SOUL on the release of proapoptotic mitochondrial proteins from isolated rat liver mitochondria. Immunoblot analysis of AIF, Endo G, and cyt-c was performed from the supernatant after inducing mitochondrial permeability transition by 150 or 30 μm Ca2+ in the absence or presence of 2.5 μm CsA or different concentrations of SOUL. Lane 1, control (no agent added); lane 2, 150 μm Ca2+; lane 3, 150 μm Ca2+ plus 2.5 μm CsA; lane 4, 30 μm Ca2+; lane 5, 30 μm Ca2+ plus 100 nm SOUL; lane 6, 30 μm Ca2+ plus 200 nm SOUL; lane 7, 30 μm Ca2+ plus 200 nm SOUL plus 2.5 μm CsA. Photomicrographs demonstrate representative blots of three independent experiments.
High amplitude swelling of the mitochondria due to mPT was monitored by the decrease of absorption 540 nm. In isolated liver mitochondria, the swelling was induced by 150 μm Ca2+ (Fig. 4B, line 2), which was completely inhibited by 2.5 μm CsA (Fig. 4B, line 3). When calcium was added at a low concentration (30 μm), no significant swelling was detected. The addition of SOUL to the mitochondria in the absence of calcium did not induce mPT either. However, when 30 μm calcium was added to recombinant SOUL-containing system, mPT was induced (Fig. 4B, lines 4–7), showing that SOUL sensitized mitochondria to calcium-induced permeability pore formation in a concentration-dependent manner. The addition of 2.5 μm CsA to this system prevented the SOUL-facilitated mPT (Fig. 4B, line 8).
The proapoptotic proteins AIF, Endo G, and cyt-c are sequestered within the mitochondria and are released following the rupture of the outer membrane. Mitochondrial permeability transition induced by 150 μm Ca2+, as described above, caused the release of AIF, Endo G, and cyt-c from the isolated mitochondria into the medium. The release of proapoptotic proteins was inhibited by the mPT inhibitor, CsA (Fig. 4C). SOUL alone up to the concentration of 400 nm did not have any effect on the release of the mitochondrial proteins (data not shown). Calcium at a concentration of 30 μm did not induce the release of AIF, Endo G, and cyt-c either, but when added together with 50–400 nm SOUL to the reaction mixture, a significant release of the proapoptotic proteins was observed. The SOUL-facilitated release of AIF, Endo G, and cyt-c was found to be concentration-dependent and was inhibited by CsA (Fig. 4C). These experiments showed that SOUL has a mitochondrial membrane potential-destabilizing effect, it is able to decrease the amount of Ca2+ needed for the induction of mitochondrial permeability transition, and it is specifically inhibited by CsA.
Effect of Deletion of the Putative BH3 Domain on the Cell Death-facilitating Effect of SOUL
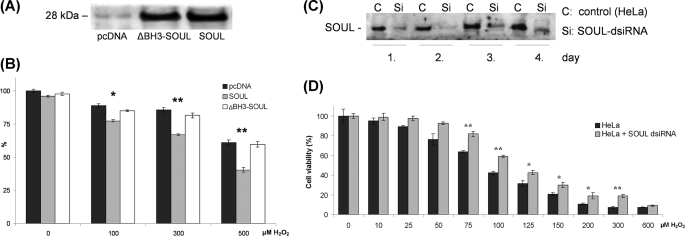
Although not exclusively, the BH3 domain is required in most of the cases for the function of the BH3-only proteins. In order to determine the role of the putative BH3 domain we found in SOUL by multiple-sequence alignment, we deleted 9 amino acids (LREDGKVFD) between positions 162 and 170, as was described previously for Bak (39). Mock-transfected and ΔBH3-SOUL- and SOUL-expressing cells were treated with different concentrations of hydrogen peroxide ranging from 0 to 500 μm for 24 h, and then viability was measured by the MTT method. We found comparable expression levels for ΔBH3-SOUL and SOUL by Western blotting utilizing anti-SOUL primary polyclonal antibody (Fig. 5A). Fig. 5B shows that SOUL-overexpressing cells are sensitized to hydrogen peroxide, whereas the cells overexpressing ΔBH3-SOUL had similar sensitivity toward it as the sham-transfected cells. In other words, when a sequence that was assumed to be functional in its putative BH3 domain was deleted, SOUL failed to sensitize H2O2-induced cell death.
FIGURE 5.
Deletion of putative BH3 domain from SOUL and suppression of the wild-type protein abolished the effect of SOUL in H2O2-induced oxidative stress. Sham-transfected (pcDNA) ΔBH3-SOUL- and SOUL-expressing NIH3T3 cells (A and B) and SOUL-dsiRNA-transfected HeLa cells (C and D) were treated for 24 h with hydrogen peroxide at concentrations ranging from 0 to 500 μm (B) or from 0 to 600 μm (D). A, demonstration of expression of ΔBH3-SOUL and SOUL in the cells was performed by Western blotting utilizing anti-SOUL and anti-actin (loading control) primary antibodies. Photomicrographs demonstrate representative blots of three independent experiments. B, comparison of the effect of H2O2 on survival of NIH3T3 cells transfected with pcDNA3.1 (black bars), SOUL (white bars), or ΔBH3-SOUL (light gray bars). C, demonstration of SOUL expression in the HeLa cell homogenates prepared 1–4 days after transfection detected by Western blotting utilizing anti-SOUL polyclonal rabbit antiserum. D, comparison of the effect of H2O2 in HeLa cells (dark gray bars) and SOUL-dsiRNA-transfected HeLa cells (light gray bars) on the second day of transfection. Survival was measured by the MTT method and was expressed as percentage of the survival of untreated non-transfected cells. Values are means ± S.E. of three independent experiments. Significant differences are indicated above the bar. *, p < 0.01; **, p < 0.001.
Effect of SOUL Suppression by dsiRNA Technique on H2O2-induced Cell Death
The presence of SOUL in excess facilitated H2O2-induced cell death. To prove the specific effect of SOUL on the cell death process, we silenced it by dsiRNA in the HeLa cell line, which expresses this protein endogenously to a high extent (Fig. 1C). Fig. 5C shows that SOUL protein levels were significantly decreased after 24 h of transfection by dsiRNA and were the lowest 48 h after transfection. SOUL suppression significantly protected HeLa cells against hydrogen peroxide-induced cell death in the 75–300 μm concentration range (Fig. 5D), indicating specificity of the effect of SOUL.
Determination of the Role of the mPT Complex in the SOUL-induced Sensitization toward Oxidative Stress
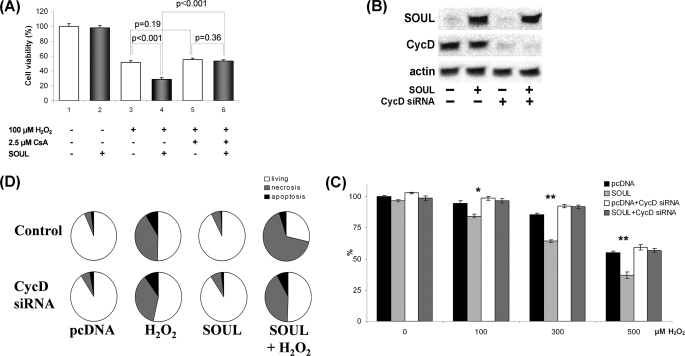
To further assess the effect of SOUL in vivo at the cellular level, we used siRNA to silence cyclophilin D, a constitutional element of the mitochondrial transition pore. SOUL-overexpressing and sham-transfected control NIH3T3 cells were pretreated or not with 30 nm cyclophilin D-specific siRNA. Efficacy of the suppression of cyclophilin D and expression of SOUL was tested by Western blotting (Fig. 6A). All cells were treated with different concentrations of hydrogen peroxide, ranging from 0 to 500 μm. We observed that SOUL-overexpressing cells are sensitized to hydrogen peroxide, whereas the cyclophilin D-suppressed cells had similar sensitivity toward it as the sham-transfected cells (Fig. 6B). Similar experiments were performed with ΔBH3-SOUL-overexpressing cells; however, we did not find any significant difference between these cells and mock-transfected cells (data not shown). In other words, blocking mPT by suppressing cyclophilin D inhibited mitochondrial permeability transition and blocked the cell death-sensitizing effect of SOUL in oxidative stress.
FIGURE 6.
Suppression of cyclophilin D abolished the effect of SOUL on H2O2-treated NIH3T3 cells. Suppression of CycD was achieved by co-transfecting or not (Control) sham-transfected (pcDNA) and SOUL-expressing (SOUL) NIH3T3 cells with 30 nm specific siRNA-expressing vector (CycD siRNA) according to the manufacturer's recommendation. The cells were treated for 24 h with hydrogen peroxide at concentrations ranging from 0 to 500 μm. A, demonstration of expression of SOUL and cyclophilin D in the cells was performed by Western blotting utilizing anti-SOUL and anti-cyclophilin D as well as anti-actin (loading control) primary antibodies. Photomicrographs demonstrate representative blots of three independent experiments. B, comparison of the effect of H2O2 on survival of NIH3T3 cells transfected with pcDNA3.1 (black bars), SOUL (light gray bars), pcDNA3.1 plus CycD siRNA (white bars), or SOUL plus CycD siRNA (dark gray bars). Survival was measured by the MTT method and was expressed as percentage of the survival of untreated double sham-transfected cells. Values are means ± S.E. of three independent experiments. Significant differences are indicated above the bar. *, p < 0.01; **, p < 0.001. C, detection of necrosis and apoptosis was by flow cytometry following fluorescein-conjugated annexin V and PI double staining performed at the end of a 24-h incubation in the presence or absence of 300 μm H2O2. D, pie charts demonstrate the distribution of living (white), necrotic (gray), and apoptotic (black) cells. Values are means of three independent experiments.
To confirm our findings, we double-stained the above mentioned cells with annexin V-conjugated fluorescein isothiocyanate and propidium iodide and used a flow cytometer to detect cell death. Mock-transfected and SOUL-overexpressing NIH3T3 cells were co-transfected (CycD siRNA) or not (control) with 30 nm cyclophilin D siRNA and were treated or not with 300 μm hydrogen peroxide for 24 h (Fig. 6C). Among control, untreated cells, 94.92 ± 3.9% were intact (annexin V- and PI-negative), 4.74 ± 2.3% were necrotic (annexin V-negative, PI-positive), and 2.08 ± 1.2% were apoptotic (annexin V-positive and PI-positive or -negative). An increase in the number of necrotic cells (6.74 ± 2.7%) was observed in the SOUL-overexpressing untreated cells. Treatment with H2O2 increased the number of necrotic cells in both the control and in the SOUL-overexpressing cells (44.88 ± 4.1 and 70.42 ± 4.8%, respectively). When cyclophilin D was silenced, control cells showed basically no change in survival (90.73 ± 4.2% living). However, unlike in control cells, SOUL overexpression failed to increase (p = 0.17, n = 3) the percentage of necrotic cells as compared with cyclophilin D-silenced mock-transfected cells (41.47 ± 4.8 versus 36.37 ± 3.2%, respectively) upon H2O2 treatment. These results indicate that SOUL protein facilitates necrotic cell death in oxidative stress, and this effect can be specifically inhibited by suppressing cyclophilin D, indicating that SOUL seems to exert its effect by interacting with the mitochondrial permeability transition pore.
Effect of SOUL on Cell Death Is Inhibited by the Overexpression of Antiapoptotic Proteins
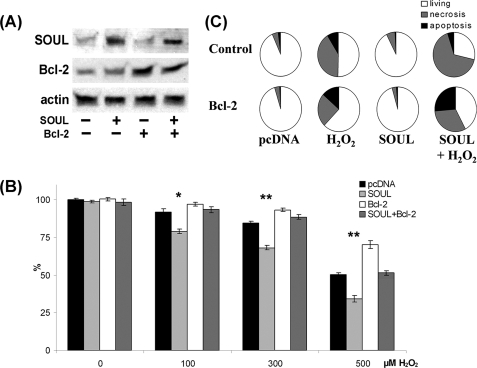
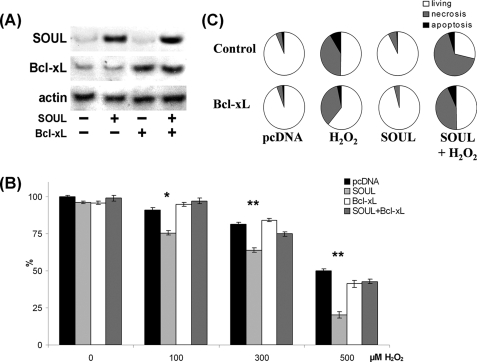
NIH3T3 cells were co-transfected or not with vectors expressing the full-length open reading frame of Bcl-2 or Bcl-xL and empty pcDNA or full-length SOUL cDNA containing pcDNA vector. Western blotting was used to detect the efficacy of the transfection (Figs. 7A and 8A). To determine the functional consequences of the co-overexpression of Bcl-2 and SOUL proteins, we monitored survival of the cells when treated with different concentrations of hydrogen peroxide. Bcl-2 overexpression alone resulted in a survival benefit at all hydrogen peroxide concentrations we used. SOUL overexpression significantly increased the cell death in the 0–500 μm hydrogen peroxide concentration range (p < 0.01), demonstrating that SOUL-facilitated oxidative stress induced cell death. However, when cells were co-overexpressing the antiapoptotic Bcl-2 protein and SOUL, the effect of SOUL protein was counteracted, and survival of these cells was similar to that of mock-transfected cells (Fig. 7B). Similar data were observed when Bcl-xL protein was used instead of Bcl-2 in an identical experimental setup (Fig. 8). In the presence of overexpressed Bcl-xL, SOUL could not decrease the percentage of surviving cells compared with controls (Fig. 8B). Similar experiments were performed with ΔBH3-SOUL-overexpressing cells; however, we did not find any significant difference between these cells and mock-transfected cells (data not shown). Data from flow cytometry (Figs. 7C and 8C) following annexin V-fluorescein isothiocyanate and PI double staining supported our findings and showed that the cell death facilitated by SOUL was mainly necrotic. When cells were co-overexpressing Bcl-2 or Bcl-xL, overexpressed SOUL could not facilitate necrotic cell death induced by H2O2 (70.42 ± 4.8% versus 28.02 ± 1.8 or 36.69 ± 2.5%, respectively), whereas mock-transfected cells showed virtually no change in survival (96.11 ± 4.7 and 95.28 ± 3.8% living, respectively). These results indicate that SOUL promoted necrotic cell death induced by oxidative stress, and this effect was counteracted by the presence of antiapoptotic Bcl-2 homologues.
FIGURE 7.
Antiapoptotic BH3 domain protein Bcl-2 abolished the effect of SOUL on H2O2-treated NIH3T3 cells. Bcl-2 was overexpressed by co-transfecting or not (Control) sham-transfected (pcDNA) and SOUL-expressing (SOUL) NIH3T3 cells with Bcl-2-expressing vector (Bcl-2). The cells were treated for 24 h with hydrogen peroxide at concentrations ranging from 0 to 500 μm. A, demonstration of expression of SOUL and Bcl-2 in the cells was performed by Western blotting utilizing anti-SOUL and anti-Bcl-2 as well as anti-actin (loading control) primary antibodies. Photomicrographs demonstrate representative blots of three independent experiments. B, comparison of the effect of H2O2 on survival of NIH3T3 cells transfected with pcDNA3.1 (black bars), SOUL (light gray bars), pcDNA3.1 plus Bcl-2 (white bars), or SOUL plus Bcl-2 (dark gray bars). Survival was measured by the MTT method and was expressed as a percentage of the survival of untreated double sham-transfected cells. Values are means ± S.E. of three independent experiments. Significant differences are indicated above the bar. *, p < 0.01; **, p < 0.001. C, detection of necrosis and apoptosis was by flow cytometry following fluorescein-conjugated annexin V and PI double staining performed at the end of a 24-h incubation in the presence or absence of 300 μm H2O2. Pie charts demonstrate the distribution of living (white), necrotic (gray), and apoptotic (black) cells. Values are means of three independent experiments.
FIGURE 8.
Antiapoptotic BH3 domain protein Bcl-xL abolished the effect of SOUL on H2O2-treated NIH3T3 cells. Bcl-xL was overexpressed by co-transfecting or not (Control) sham-transfected (pcDNA) and SOUL-expressing (SOUL) NIH3T3 cells with Bcl-xL-expressing vector (Bcl-xL). The cells were treated for 24 h with hydrogen peroxide at concentrations ranging from 0 to 500 μm. A, demonstration of expression of SOUL and Bcl-xL in the cells was performed by Western blotting utilizing anti-SOUL and anti-Bcl-xL as well as anti-actin (loading control) primary antibodies. Photomicrographs demonstrate representative blots of three independent experiments. B, comparison of the effect of H2O2 on survival of NIH3T3 cells transfected with pcDNA3.1 (black bars), SOUL (light gray bars), pcDNA3.1 plus Bcl-xL (white bars), or SOUL plus Bcl-xL (dark gray bars). Survival was measured by the MTT method and was expressed as a percentage of the survival of untreated double sham-transfected cells. Values are means ± S.E. of three independent experiments. Significant differences are indicated above the bar. *, p < 0.01; **, p < 0.001. C, detection of necrosis and apoptosis was by flow cytometry following fluorescein-conjugated annexin V and PI double staining performed at the end of a 24-h incubation in the presence or absence of 300 μm H2O2. Pie charts demonstrate the distribution of living (white), necrotic (gray), and apoptotic (black) cells. Values are means of three independent experiments.
Effect of SOUL on the Hydrogen Peroxide-induced Collapse of MMP
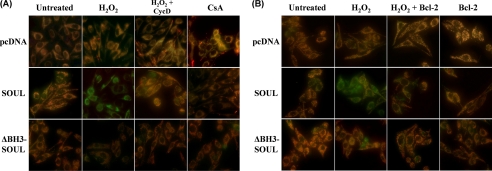
The specific inhibitory effect of cyclophilin D suppression and overexpressed Bcl-2 or Bcl-xL proteins on the collapse of mitochondrial membrane potential induced by hydrogen peroxide was also determined in SOUL- or ΔBH3-SOUL-overexpressing or mock-transfected NIH3T3 cells using 1 μm JC-1 fluorescent dye (40). We used a hydrogen peroxide concentration that alone was not able to induce significant decrease in MMP. However, in SOUL-overexpressing cells, loss of red fluorescence of JC-1 indicated a significant decrease in MMP (Fig. 9). Suppression of cyclophilin D (Fig. 9A) and overexpression of Bcl-2 (Fig. 9B) and Bcl-xL (data not shown) prevented the MMP-decreasing effect of SOUL in oxidative stress. However, JC-1 images of ΔBH3-SOUL-overexpressing cells were identical to those of mock-transfected cells (Fig. 9). These data confirm our previous findings that SOUL facilitates cell death by interacting with the mPT complex because cyclophilin D is an integral protein of the complex, and antiapoptotic Bcl-2 analogues can inhibit mPT by binding to VDAC and other components of the complex (21, 30).
FIGURE 9.
SOUL depolarizes mitochondrial membrane in vivo in H2O2-treated NIH3T3 cells. Mock-transfected (pcDNA) and SOUL- and ΔBH3-SOUL-overexpressing cells were co-transfected or not with vectors expressing cyclophilin D siRNA (A) or Bcl-2 protein (B). All cells were exposed or not to 100 μm hydrogen peroxide for 3 h, and then the medium was replaced with a fresh one without any agents and containing 1 μm JC-1 membrane potential-sensitive fluorescent dye. After 10 min of loading, green and red fluorescence images of the same field were acquired using a fluorescent microscope equipped with a digital camera. The images were merged to demonstrate depolarization of mitochondrial membrane potential in vivo indicated by loss of the red component of the merged image. Representative merged images of three independent experiments are presented.
DISCUSSION
Heme-binding proteins have been identified before (41–43), and in some cases their heme binding properties have been determined (41, 43, 44). However, very little information is available about their other biological functions. Previously, we reported that SOUL can facilitate cell death in taxol- and A23187-treated cells (1). Analyzing the protein sequence data base, we found that SOUL contained a sequence with a high similarity to BH3 domains (Fig. 1A), suggesting that this feature may account for its observed cell death-facilitating effect.
Previously, SOUL was reported to be strongly expressed in retina, the pineal gland, and liver (41, 42). We found that it was expressed in various tissues to different extents (Fig. 1C). Expression level was high in some cancer-derived cell lines: Panc-1, Jurkat, and HeLa. Interestingly, we found a high expression in pancreas adenocarcinoma, whereas it was almost undetectable in normal pancreas tissue (Fig. 1C). Overexpressing SOUL in a cell line that normally expresses it to a low extent sensitized the cells against hydrogen peroxide-induced cell death. We assumed a mitochondrial mechanism, because recombinant SOUL could facilitate mPT and the collapse of membrane potential in mitochondria sensitized with low calcium in a concentration-dependent manner (Fig. 4). In addition, it was also detected that upon hydrogen peroxide treatment, a larger amount of SOUL binds to mitochondria (Fig. 2B). Its overexpression in NIH3T3 cells facilitated hydrogen peroxide-induced release of proapoptotic mitochondrial proteins AIF, Endo G, cyt-c, and Smac/DIABLO (Fig. 3A) and collapse of the mitochondrial membrane potential (Fig. 9). As it was described previously (45), H2O2 induced the disruption of the mitochondrial membrane systems resulting in release of mitochondrial proapoptotic proteins. Depending on its concentration, the cell death process can proceed with a predominantly apoptotic or necrotic mechanism. Our flow cytometry results indicated facilitation of necrotic cell death by SOUL overexpression (Figs. 6C, 7C, and 8C). Furthermore, SOUL overexpression failed to further increase H2O2-induced caspase-3 activation (Fig. 3B) and resulted in the disruption of the nuclear membrane as it was revealed by PI staining (Fig. 3C). All of these findings suggest that overexpression of SOUL facilitated H2O2-induced death mainly by increasing necrosis.
We investigated the effect of endogenous rather than overexpressed SOUL on the cell death process in HeLa cell line that expresses SOUL to a high extent (Fig. 1C). Suppression of SOUL by the dsiRNA technique in this cell line protected the cells against oxidative stress (Fig. 5C), indicating its specific function in the cell death process. As a further proof that SOUL exerted its effect by a direct effect on the mitochondrion, both inhibition by cyclosporine A and suppression of cyclophilin D by the siRNA technique prevented all effects of SOUL both in vitro in isolated mitochondria (Fig. 4) and in vivo in H2O2-treated cells (Fig. 6). Since cyclophilin D is an essential integral protein of the mPT complex (46), it seems likely that SOUL exerts its effect by interacting with the complex itself.
Multiple-sequence alignment indicated that SOUL has a BH3 domain-like structure, and we assumed that the cell death-promoting effect of SOUL might be related to this structure. To prove this concept, we disrupted the putative BH3 domain of SOUL by deleting 9 amino acids from the functional core similarly as it was done for disrupting BH3 domain function in Bak (39). We found that the resulting protein failed to facilitate H2O2-induced release of mitochondrial intermembrane proteins (Fig. 3A) and cell death (Fig. 5B). When cell death was induced under the conditions of cyclophilin D suppression or Bcl-2 as well as Bcl-xL overexpression, ΔBH3-SOUL-expressing cells did not differ significantly from the sham-transfected ones. Furthermore, it did not promote H2O2-induced mitochondrial membrane depolarization, as was revealed by JC-1 staining (Fig. 9). Because excision of this short sequence resulted in loss of all cell death-related properties of SOUL, and this sequence showed homology to the BH3 domains of established Bcl-2 family proteins, SOUL could represent a novel BH3 domain-only protein.
It was reported that BH3 domain proteins, such as the proapoptotic Bcl-2 family member tBid, by forming a complex with another family member, Bax, can induce cyclophilin D-independent outer mitochondrial membrane permeabilization and release of proapoptotic mitochondrial proteins (23). Oligomer Bax can evoke even mitochondrial permeability transition and mitochondrial swelling (25, 47). Despite the accompanying release of proapoptotic mitochondrial proteins, mPT induced by oligomer Bax can lead to cyclophilin D-sensitive necrotic cell death (25, 47). Besides tBid and Bax, Bak was reported to bind to VDAC and facilitate necrotic and apoptotic cell death (47–51). It is very likely that SOUL as a BH3 domain-only protein exerts its effect in a similar manner. This is specifically true under the conditions of oxidative stress where mPT is induced, and both apoptotic and necrotic cell death pathways can be activated (46).
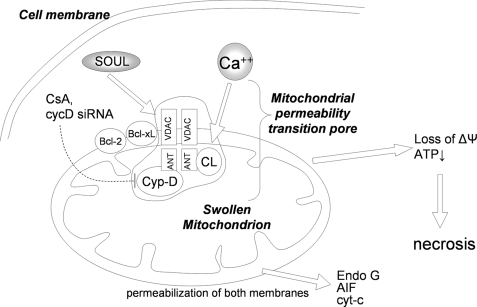
Antiapoptotic Bcl-2 homologues can bind to VDAC and inhibit mPT and cell death (21, 30, 52). We determined whether these Bcl-2 homologues can reverse the action of SOUL. Our data clearly showed that both Bcl-2 and Bcl-xL could prevent SOUL-promoted cell death (Figs. 7 and 8) and protect SOUL-facilitated collapse of MMP in oxidative stress (Fig. 9). Therefore, antiapoptotic Bcl-2 proteins counteract the effect of both SOUL and the proapoptotic Bcl-2 proteins in basically the same manner. Similarly to oligomer Bax (25), SOUL promoted the permeabilization of not only the outer but also the inner mitochondrial membrane (Fig. 10), and as a consequence, SOUL facilitated predominantly necrotic cell death.
FIGURE 10.
Schematic diagram of the proposed molecular mechanism of SOUL. Subeffective concentration of Ca2+ or free radicals together with SOUL induces permeability transition accompanied by the loss of mitochondrial membrane potential and the release of intermembrane proteins, eventually leading to cell death. CsA, suppression of cyclophilin D, Bcl-2, or Bcl-xL prevents this process, indicating the direct effect of SOUL on the mitochondrial permeability transition pore (mPTP). Established components of the mitochondrial permeability transition pore are indicated schematically. ANT, adenine nucleotide translocator; Cyp-D, cyclophilin D; CL, adenine nucleotide translocator-associated cardiolipin; HK, hexokinase; Bcl-2, B-cell-associated leukemia protein 2; Bcl-xL, B-cell-associated leukemia protein xL. Note that the exact stochiometry and composition of the mitochondrial permeability transition pore are elusive. Moreover, the mitochondrial permeability transition pore composition is not fully illustrated and may be cell type-dependent.
Previously, it was reported that the recombinant SOUL protein oligomerizes and forms hexamers in aqueous solution (44). It is also known that Bax and Bak can oligomerize (53), and their oligomer forms are very effective in inducing cell death (25, 47). Therefore, it is likely that oligomerization plays a role in the effect of SOUL.
The best studied BH3 domain-only proteins, Bim and Bid, permeabilize the outer mitochondrial membrane and release proapoptotic mitochondrial proteins without affecting the integrity of the inner membrane; therefore, they induce cyclophilin D-insensitive apoptotic death (23, 55, 56). In contrast, SOUL could not induce cell death by itself like Bim and Bid, but when cell death was induced by various stimuli, such as taxol, A23187 (1), or H2O2, SOUL enhanced it and directed it mainly toward necrosis. The effects on the cell death process of oligomer Bax and SOUL are very similar. Both are capable of permeabilizing the inner together with the outer mitochondrial membrane, inducing the release of proapoptotic mitochondrial proteins and promoting cell death. However, Bax can induce both necrotic and apoptotic cell death by itself (25, 47, 54), whereas SOUL can only facilitate cell death induced by other stimuli and direct it toward a necrotic mechanism, presumably by amplifying mitochondrial impairment.
In conclusion, SOUL not only permeabilized the outer mitochondrial membrane like proapoptotic Bcl-2 homologues but also facilitated an inner membrane permeabilization in a cyclophilin D-dependent manner, leading to mitochondrial swelling, rupture of the outer membrane, the release of intermembrane proapoptotic proteins, and the collapse of mitochondrial membrane potential. Most likely, this difference is responsible for the observed properties of SOUL, namely that it cannot induce cell death alone like other proapoptotic BH3 domain-only proteins but facilitates predominantly necrotic cell death. Thus, SOUL plays a much more complex role in cell physiology than its mere possible involvement in binding and transporting heme intermediates.
Acknowledgment
We thank Heléna Halász for excellent technical help.
This work was supported by University of Pécs, Hungary, AOKKA Grants 34039-1/2009 and 34039-23/2009 as well as Hungarian Research Grants OTKA 68469, 67996, and K-73738.
- BH1 to -5
- Bcl-2 homology 1–5, respectively
- AIF
- apoptosis-inducing factor
- cyt-c
- cytochrome c
- CsA
- cyclosporine A
- ΔBH3-SOUL
- SOUL protein with deleted putative BH3 domain
- dsiRNA
- diced small interfering ribonucleic acid
- Endo G
- endonuclease G
- GFP
- green fluorescent protein
- MTT
- 3-(4,5-dimethylthiazol-2-yl)-2,5-diphenyltetrazolium bromide
- NCBI
- National Center for Biotechnology Information
- PI
- propidium iodide
- VDAC
- voltage-dependent anionic channel
- mPT
- mitochondrial permeability transition
- MMP
- mitochondrial membrane potential
- CsA
- cyclosporine A
- Rh-123
- rhodamine-1,2,3
- siRNA
- small interfering RNA
- JC-1
- 5,5′,6,6′-tetracloro-1,1′,3,3′-tetraethyl-benzimidazolyl-carbocyanine iodide.
REFERENCES
- 1.Szigeti A., Bellyei S., Gasz B., Boronkai A., Hocsak E., Minik O., Bognar Z., Varbiro G., Sumegi B., Gallyas F., Jr. (2006) FEBS Lett. 580, 6447–6454 [DOI] [PubMed] [Google Scholar]
- 2.Shimizu S., Tsujimoto Y. (2000) Proc. Natl. Acad. Sci. U.S.A. 97, 577–582 [DOI] [PMC free article] [PubMed] [Google Scholar]
- 3.Bouillet P., Strasser A. (2002) J. Cell Sci. 115, 1567–1574 [DOI] [PubMed] [Google Scholar]
- 4.Hsu S. Y., Hsueh A. J. (2000) Physiol. Rev. 80, 593–614 [DOI] [PubMed] [Google Scholar]
- 5.Martinou J. C., Green D. R. (2001) Nat. Rev. Mol. Cell Biol. 2, 63–67 [DOI] [PubMed] [Google Scholar]
- 6.Adams J. M., Cory S. (1998) Science 281, 1322–1326 [DOI] [PubMed] [Google Scholar]
- 7.Gross A., McDonnell J. M., Korsmeyer S. J. (1999) Genes Dev. 13, 1899–1911 [DOI] [PubMed] [Google Scholar]
- 8.Reed J. C. (1998) Oncogene 17, 3225–3236 [DOI] [PubMed] [Google Scholar]
- 9.Kelekar A., Thompson C. B. (1998) Trends Cell Biol. 8, 324–330 [DOI] [PubMed] [Google Scholar]
- 10.Altznauer F., Conus S., Cavalli A., Folkers G., Simon H. U. (2004) J. Biol. Chem. 279, 5947–5957 [DOI] [PubMed] [Google Scholar]
- 11.Annis M. G., Soucie E. L., Dlugosz P. J., Cruz-Aguado J. A., Penn L. Z., Leber B., Andrews D. W. (2005) EMBO J. 24, 2096–2103 [DOI] [PMC free article] [PubMed] [Google Scholar]
- 12.Epand R. F., Martinou J. C., Montessuit S., Epand R. M. (2003) Biochemistry 42, 14576–14582 [DOI] [PubMed] [Google Scholar]
- 13.Soane L., Fiskum G. J. (2005) J. Bioenerg. Biomembr. 37, 179–190 [DOI] [PMC free article] [PubMed] [Google Scholar]
- 14.Liu J., Weiss A., Durrant D., Chi N. W., Lee R. M. (2004) Apoptosis 9, 533–541 [DOI] [PubMed] [Google Scholar]
- 15.Terrones O., Antonsson B., Yamaguchi H., Wang H. G., Liu J., Lee R. M., Herrmann A., Basañez G. (2004) J. Biol. Chem. 279, 30081–30091 [DOI] [PubMed] [Google Scholar]
- 16.de Jonge H. R., Hogema B., Tilly B. C. (2000) Sci. STKE 2000, PE1. [DOI] [PubMed] [Google Scholar]
- 17.Rostovtseva T. K., Antonsson B., Suzuki M., Youle R. J., Colombini M., Bezrukov S. M. (2004) J. Biol. Chem. 279, 13575–13583 [DOI] [PubMed] [Google Scholar]
- 18.Baines C. P., Kaiser R. A., Sheiko T., Craigen W. J., Molkentin J. D. (2007) Nat. Cell Biol. 9, 550–555 [DOI] [PMC free article] [PubMed] [Google Scholar]
- 19.Das S., Wong R., Rajapakse N., Murphy E., Steenbergen C. (2008) Circ. Res. 103, 983–991 [DOI] [PMC free article] [PubMed] [Google Scholar]
- 20.Jan Deniaud A., Sharaf el dein O., Maillier E., Poncet D., Kroemer G., Lemaire C., Brenner C. (2008) Oncogene 27, 285–299 [DOI] [PubMed] [Google Scholar]
- 21.Tsujimoto Y., Nakagawa T., Shimizu S. (2006) Biochim. Biophys. Acta 1757, 1297–1300 [DOI] [PubMed] [Google Scholar]
- 22.Wang X., Ryter S. W., Dai C., Tang Z. L., Watkins S. C., Yin X. M., Song R., Choi A. M. (2003) J. Biol. Chem. 278, 29184–29191 [DOI] [PubMed] [Google Scholar]
- 23.Brustovetsky N., Dubinsky J. M., Antonsson B., Jemmerson R. J. (2003) J. Neurochem. 84, 196–207 [DOI] [PubMed] [Google Scholar]
- 24.Wu S., Xing D., Gao X., Chen W. R. (2009) J. Cell. Physiol. 218, 603–611 [DOI] [PubMed] [Google Scholar]
- 25.Li T., Brustovetsky T., Antonsson B., Brustovetsky N. (2008) Biochim. Biophys. Acta 1777, 1409–1421 [DOI] [PMC free article] [PubMed] [Google Scholar]
- 26.Hiller S., Garces R. G., Malia T. J., Orekhov V. Y., Colombini M., Wagner G. (2008) Science 321, 1206–1210 [DOI] [PMC free article] [PubMed] [Google Scholar]
- 27.Tafani M., Minchenko D. A., Serroni A., Farber J. L. (2001) Cancer Res. 61, 2459–2466 [PubMed] [Google Scholar]
- 28.Malia T. J., Wagner G. (2007) Biochemistry 46, 514–525 [DOI] [PMC free article] [PubMed] [Google Scholar]
- 29.Tsujimoto Y., Shimizu S. (2007) Apoptosis 12, 835–840 [DOI] [PubMed] [Google Scholar]
- 30.Armstrong J. S. (2006) Mitochondrion. 6, 225–234 [DOI] [PubMed] [Google Scholar]
- 31.Sambrook J., Fritsch E. F., Maniatis T. (1989) Molecular Cloning: A Laboratory Manual, pp. 18.60–18.75, 3rd Ed., Cold Spring Harbor Laboratory, Cold Spring Harbor, NY [Google Scholar]
- 32.Shinzawa K., Tsujimoto Y. (2003) J. Cell Biol. 163, 1219–1230 [DOI] [PMC free article] [PubMed] [Google Scholar]
- 33.Hageboom G. H., Schneider W. C. (1950) J. Biol. Chem. 186, 417–427 [PubMed] [Google Scholar]
- 34.Sims N. R. (1990) J. Neurochem. 55, 698–707 [DOI] [PubMed] [Google Scholar]
- 35.Varbiro G., Veres B., Gallyas F., Jr., Sumegi B. (2001) Free. Radic. Biol. Med. 31, 548–558 [DOI] [PubMed] [Google Scholar]
- 36.Gasz B., Rácz B., Roth E., Borsiczky B., Ferencz A., Tamás A., Cserepes B., Lubics A., Gallyas F., Jr., Tóth G., Lengvári I., Reglodi D. (2006) Peptides 27, 87–94 [DOI] [PubMed] [Google Scholar]
- 37.Lathrop J. T., Timko M. P. (1993) Science 259, 522–525 [DOI] [PubMed] [Google Scholar]
- 38.Shin W. S., Yamashita H., Hirose M. (1994) Biochem. J. 304, 81–86; Corection (1995) Biochem. J. 306, 879 [DOI] [PMC free article] [PubMed] [Google Scholar]
- 39.Simonian P. L., Grillot D. A., Nuñez G. (1997) Oncogene 15, 1871–1875 [DOI] [PubMed] [Google Scholar]
- 40.Reers M., Smith T. W., Chen L. B. (1991) Biochemistry 30, 4480–4486 [DOI] [PubMed] [Google Scholar]
- 41.Taketani S., Adachi Y., Kohno H., Ikehara S., Tokunaga R., Ishii T. (1998) J. Biol. Chem. 273, 31388–31394 [DOI] [PubMed] [Google Scholar]
- 42.Zylka M. J., Reppert S. M. (1999) Brain Res. Mol. Brain Res. 74, 175–181 [DOI] [PubMed] [Google Scholar]
- 43.Jacob Blackmon B., Dailey T. A., Lianchun X., Dailey H. A. (2002) Arch. Biochem. Biophys. 407, 196–201 [DOI] [PubMed] [Google Scholar]
- 44.Sato E., Sagami I., Uchida T., Sato A., Kitagawa T., Igarashi J., Shimizu T. (2004) Biochemistry 43, 14189–14198 [DOI] [PubMed] [Google Scholar]
- 45.Tapodi A., Debreceni B., Hanto K., Bognar Z., Wittmann I., Gallyas F., Jr., Varbiro G., Sumegi B. (2005) J. Biol. Chem. 280, 35767–35775 [DOI] [PubMed] [Google Scholar]
- 46.Lemasters J. J., Nieminen A. L., Qian T., Trost L. C., Elmore S. P., Nishimura Y., Crowe R. A., Cascio W. E., Bradham C. A., Brenner D. A., Herman B. (1998) Biochim. Biophys. Acta 1366, 177–196 [DOI] [PubMed] [Google Scholar]
- 47.Carvalho A. C., Sharpe J., Rosenstock T. R., Teles A. F., Youle R. J., Smaili S. S. (2004) Cell Death Differ. 11, 1265–1276 [DOI] [PubMed] [Google Scholar]
- 48.Lemasters J. J., Holmuhamedov E. (2006) Biochim. Biophys. Acta 1762, 181–190 [DOI] [PubMed] [Google Scholar]
- 49.Shoshan-Barmatz V., Keinan N., Zaid H. (2008) J. Bioenerg. Biomembr. 40, 183–191 [DOI] [PubMed] [Google Scholar]
- 50.Banerjee J., Ghosh S. (2004) Biochem. Biophys. Res. Commun. 323, 310–314 [DOI] [PubMed] [Google Scholar]
- 51.Sugiyama T., Shimizu S., Matsuoka Y., Yoneda Y., Tsujimoto Y. (2002) Oncogene 21, 4944–4956 [DOI] [PubMed] [Google Scholar]
- 52.Kowaltowski A. J., Vercesi A. E., Fiskum G. (2000) Cell Death Differ. 7, 903–910 [DOI] [PubMed] [Google Scholar]
- 53.Korsmeyer S. J., Wei M. C., Saito M., Weiler S., Oh K. J., Schlesinger P. H. (2000) Cell Death Differ. 7, 1166–1173 [DOI] [PubMed] [Google Scholar]
- 54.Smaili S. S., Hsu Y. T., Sanders K. M., Russell J. T., Youle R. J. (2001) Cell Death Differ. 8, 909–920 [DOI] [PubMed] [Google Scholar]
- 55.Baines C. P., Kaiser R. A., Purcell N. H., Blair N. S., Osinska H., Hambleton M. A., Brunskill E. W., Sayen M. R., Gottlieb R. A., Dorn G. W., Robbins J., Molkentin J. D. (2005) Nature 434, 658–662 [DOI] [PubMed] [Google Scholar]
- 56.Lin C. H., Lu Y. Z., Cheng F. C., Chu L. F., Hsueh C. M. (2005) Neurosci. Lett. 387, 22–27 [DOI] [PubMed] [Google Scholar]


