

Abstract
We investigated the link between neuronal activity in the frontal eye field (FEF) and the enhancement of visual processing associated with covert spatial attention in the absence of eye movements. We correlated activity recorded in the FEF of monkeys manually reporting the identity of a visual search target to performance accuracy and reaction time. Monkeys were cued to the most probable target location with a cue array containing a popout color singleton. Neurons exhibited spatially selective responses for the popout cue stimulus and for the target of the search array. The magnitude of activity related to the location of the cue prior to the presentation of the search array was correlated with trends in behavioral performance across valid, invalid, and neutral cue trial conditions. However, the speed and accuracy of the behavioral report on individual trials were predicted by the magnitude of spatial selectivity related to the target to be identified, not for the spatial cue. A minimum level of selectivity was necessary for target detection and a higher level for target identification. Muscimol inactivation of FEF produced spatially selective perceptual deficits in the covert search task that were correlated with the effectiveness of the inactivation and were strongest on invalid cue trials that require an endogenous attention shift. These results demonstrate a strong functional link between FEF activity and covert spatial attention and suggest that spatial signals from FEF directly influence visual processing during the time that a stimulus to be identified is being processed by the visual system.
INTRODUCTION
Visual spatial attention—a critical component of normal vision and is necessary for the recognition of objects in natural environments (Rensink 2002; Sheinberg and Logothetis 2001)—enhances the representation of visual information at selected peripheral locations, thereby improving detection and discrimination (Maunsell and Cook 2002).
It is widely accepted that the spatially selective signals in the frontal eye field (FEF) are associated with the planning and execution of saccadic eye movements (Goldberg and Segraves 1989; Hanes et al. 1998; Schall and Thompson 1999; Tehovnik et al. 2000). A growing body of evidence suggests that FEF also plays a causal role in directing covert spatial attention (Awh et al. 2006). Human functional magnetic resonance imaging (fMRI) studies show that the FEF is active during the allocation of attention, both with and without eye movements (Beauchamp et al. 2001; Bressler et al. 2008; Corbetta and Shulman 2002; Kelley et al. 2008; Kincade et al. 2005). Transcranial magnetic stimulation over FEF modulates perceptual performance in covert attention tasks (Grosbras and Paus 2002; Muggleton et al. 2003; Smith et al. 2005) and also modulates visual activity in extrastriate visual cortex (Morishima et al. 2009; Silvanto et al. 2006; Taylor et al. 2007). In monkeys, electrical microstimulation of FEF enhances perception (Moore and Fallah 2001, 2004; Schafer and Moore 2007) and produces enhanced visual responses in extrastriate visual cortex that resemble the effects of covert spatial attention (Armstrong and Moore 2007; Ekstrom et al. 2008; Moore and Armstrong 2003). Inactivation of FEF disrupts target detection during covert visual search (Wardak et al. 2006).
Neuron recordings in monkeys have shown that the spatially selective activity of visually responsive FEF neurons identifies the probable location of spatial attention and is dissociated from saccade production (Juan et al. 2004; Murthy et al. 2001; Sato and Schall 2003; Thompson et al. 1997; Zhou and Thompson 2009). We recently reported that in the absence of eye movements FEF visually responsive neurons select the singleton target in popout visual search arrays, whereas saccade-related movement neurons are inhibited (Thompson et al. 2005b). Consistent with this, a recent anatomical study showed that FEF neurons projecting to visual cortex are separate from those that send saccade commands to the superior colliculus (Pouget et al. 2009). However, neurophysiological evidence directly linking modulations of neuronal activity in FEF to behavioral measures of covert spatial attention is lacking.
In this study we recorded single-unit activity from monkeys performing a difficult covert visual search task in which monkeys manually reported the identity of a target object. On a large fraction of trials, a popout color singleton cued the monkeys of the most probable target location. By comparing activity across physically identical trials, sorted by differences in the monkeys' behavior, we found that variability in the magnitude of spatial selectivity for the target to be identified, not for the spatial cue, predicts the speed and accuracy of target identification. A minimum level of spatial selectivity in FEF is necessary for target detection and a higher level is necessary for target identification. In addition, to test whether there is a causal link between FEF activity and visual object identification, we inactivated FEF with microinjections of muscimol, a γ-aminobutyric acid type A (GABAA) agonist, while the monkey performed the cued covert visual search task. The neurophysiological recordings and inactivation results show that FEF activity plays a causal role in covert spatial attention by enhancing the processing of a stimulus to be identified as it is being processed by the visual system.
METHODS
Subjects and data collection
The data were collected from two male monkeys (Macaca mulatta) weighing 6.5 kg (monkey C) and 7.8 kg (monkey B). All surgical and experimental protocols were approved by the National Eye Institute Animal Care and Use Committee and complied with the National Institutes of Health Guide for the Care and Use of Laboratory Animals. Sterile surgery was performed under ketamine and isoflurane anesthesia to place a head-holding device, a plastic recording chamber over the frontal eye field, and a scleral search coil. Frontal eye field was localized within the recording chamber using low-current microstimulation (<50 μA) to evoke saccades and by the presence of saccade-related movement neurons (Bruce and Goldberg 1985). Neuronal recordings were made in the left FEF in monkey C and in the right FEF in monkey B. Muscimol injections were made in the right FEF of monkey B in separate experimental sessions after all neuronal recording sessions were completed (see following text). Recording sites were confirmed to be in the rostral bank of the arcuate sulcus histologically in monkey C and by MRI in both monkeys.
Visual stimulation and behavioral control was done by a computer running REX (Hays et al. 1982). Visual stimuli were presented on a computer monitor (26 × 21 cm, 1,024 × 768-pixel resolution, 60-Hz frame rate) viewed at a distance of 57 cm. In each recording session, a single tungsten microelectrode (FHC, Bowdoin, ME) was inserted into the FEF by a motorized microdrive under computer control. Action potential waveforms were digitized and saved using a computer-based data-acquisition system (Plexon). Often two or three units were recorded simultaneously. Off-line spike sorting separated single units based on the size and shape of the spike waveforms. Analog eye position and lever position signals were digitized and sampled at 1 kHz.
Behavioral training and tasks
Monkeys were seated in a primate chair with head fixed. Using operant conditioning with positive reinforcement, the monkeys were trained to perform a memory-guided saccade task and a covert visual search task. The two tasks were run in separate blocks of trials.
The memory-guided saccade task was used to map the spatial extent of each neuron's response field (Bruce and Goldberg 1985) and to assess the effectiveness of muscimol inactivation (see following text). After the monkey fixated a 0.3° diameter gray spot on a black background for 400–800 ms, an identical spot was flashed for 50 ms at a peripheral location. The monkeys were required to maintain fixation on the central spot for a random interval ranging from 800 to 1,400 ms. After the central spot disappeared, the monkeys were rewarded for making a saccade to the remembered location of the target. Once gaze shifted, the target reappeared to provide feedback and a fixation target for the monkeys.
After mapping the neuron's response field with the memory-guided saccade task, the monkeys performed the cued covert visual search task illustrated in Fig. 1A. A lever that could be turned left or right of vertical was attached to the front of the chair within easy reach of the monkey. An electrical circuit detected when the monkey was touching the lever. When no force was applied to the lever, a spring automatically returned it to the vertical position. Although they were free to use either hand to grasp and turn the lever, both monkeys were exclusively right-handed.
Fig. 1.

Task and behavior. A: the cued covert visual search task. After the monkey grasped the lever in the vertical position and fixated a small central fixation cross a cue array appeared. Cue trials: in about 75% of trials one of the rings was red and the rest were green; neutral cue trials: in about 25% of trials all the rings were green. After a variable cue-target onset asynchrony (CTOA), ranging from 0 to 470 ms, a search array appeared. The target of the search array was a leftward or rightward-oriented Landolt C. The location of the red ring identified most probable target location, but in a minority of trials the cue was invalid; the target appeared in one of the 3 green rings directly opposite the red ring. The monkeys were required to maintain fixation at the center and were rewarded for turning the lever in the same direction as the leftward- or rightward-oriented C target and for releasing the lever if there was no target. Reaction time (RT) was measured from search array presentation to the time of the monkeys' behavioral report. The temporal structure of the task is illustrated at the bottom. The approximate percentages of each trial condition are indicated in parentheses. B: cue-related behavior. Average RT and percentage correct ± SE across recording sessions is shown for monkey C (left) and for monkey B (right) from valid cue trials (red bars), invalid cue trials (green bars), and neutral cue trials (white bars). Percentage correct performance from no-target trials is shown for each monkey (gray bars). For monkey C we grouped trials into 4 groups based on similar CTOAs. For monkey B all recording sessions included the same 3 CTOAs: 33, 167, and 300 ms. For each monkey, the average RT and percentage correct across all trials is shown at the far right. C: average reaction times of monkey C (top) and monkey B (bottom) in correct and error trials for each trial condition. The color conventions are the same as those in B. Errors in target-present trials are separated by behavior into lever turn errors and lever release errors.
After grasping the lever and positioning it within 10° of vertical, a small (0.3°) central yellow fixation cross appeared on a black background. The monkeys were required to maintain eye position within 2° of the central fixation cross until the reward. After fixating the central cross for a random interval (400–800 ms), a cue array was presented that consisted of eight 2° diameter isoluminant rings spaced equally around the fixation cross. The rings were isoeccentric and adjusted so that at least one ring was inside the neuron's response field. Response field eccentricities of recorded neurons ranged between 8 and 12° of visual angle. On about 75% of trials one of the rings was red and the other seven rings were green. On the remaining 25% of trials, all the rings were green. The position of the red ring was randomized from trial to trial and served as a spatial cue for the most probable location of the visual search target to be identified. The cue array remained on until the end of the trial.
After a cue-target onset asynchrony (CTOA) lasting between 0 and 470 ms one item of the search array appeared simultaneously inside each of the colored rings. All items of the search array were gray in color and 1° in diameter. The target of the search array was a leftward- or rightward-oriented Landolt C target with a 0.5° gap on the left or right. There was an equal probability that the C target was facing leftward or rightward. The Landolt C target appeared on about 75% of trials (range: 66 to 83% across sessions). The monkeys' task was to report the presence and identity of a Landolt C target with a leftward or rightward lever turn that corresponded to the location of the gap in the Landolt C target. The monkeys were rewarded for making the correct lever turn (>15° from vertical) within 4 s following search array presentation; in practice, the monkeys nearly always turned the lever to the limit of 35° from vertical. If the monkey broke fixation at any time during the trial, released the lever, or made an incorrect lever turn, the trial was immediately aborted. In about 25% of trials (ranging from 17 to 34% across sessions) no target and only distractors were presented and the monkeys were rewarded for releasing the lever. Overall, about 45% of target-present trials were valid cue trials; the Landolt C target appeared inside the red ring (ranging from 31 to 55%). About 30% of target-present trials were invalid cue trials; the Landolt C target appeared inside one of the three green rings opposite the red ring (ranging from 14 to 39%). Therefore on invalid cue trials each of the three target locations opposite the red ring had a nearly 10% probability of containing the target. The remaining 25% of target-present trials were neutral cue trials; all the rings in the cue array were green.
Combining the probabilities of cue or neutral cue, target or no target trial, and valid or invalid cue, the approximate percentages of each trial condition shown in Fig. 1A within a recording session are as follows: 1) valid cue trials: 34%; 2) invalid cue trials: 22%; 3) neutral cue target trials: 19%; 4) cue no-target trials: 19%; and 5) neutral cue no-target trials: 6%.
Although the task was the same for the two monkeys, there were some differences in the visual stimuli. Data were collected first from monkey C. In this monkey, we tested various CTOAs between 0 and 470 ms. We found that reaction time was longest for 0-ms CTOAs and reaction times did not differ across trials with CTOAs >100 ms (Fig. 1B). For monkey B we used only three CTOAs: a short CTOA of 33 ms, a medium CTOA of 167 ms, and a long CTOA of 300 ms. The luminance of the search array was also different between the two monkeys. Luminance was measured using a Minolta CA-100 spectrophotometer. For monkey C, the luminance of all the visual stimuli was 3.7 cd/m2 on a dark gray background of 0.5 cd/m2. During practice sessions with monkey B it became evident that the task was too easy. Therefore to generate enough errors for analysis it was necessary to make the task more difficult. We did this by decreasing the luminance of the search array stimuli to 0.2 cd/m2 on a black background of 0.02 cd/m2. In addition, to make the task more difficult for monkey B, we altered the shape of the distractors. For monkey C the distractors of the search array were gray rings with no gaps; for monkey B they were upward- or downward-oriented Landolt C targets as illustrated in Fig. 1. Finally, to provide further encouragement to monkey B to direct attention to the red ring, on about 70% of valid cue trial the search array stimuli were presented for only 50 ms. The behavioral and neurophysiological results were the same from trials in which the search array was presented briefly and from trials in which the search array remained on and were combined for the behavioral and neurophysiological analyses. In all invalid cue and neutral cue trials the search array remained on the screen for the entire trial. The results from 30 recording sessions are included in this study (monkey C: 10 sessions; monkey B: 20 sessions).
Data analysis
A lever turn was defined as a turn >15° from vertical. The beginning and end of each lever turn were defined as the beginning and end of the monotonic change in lever position before and after the 15° threshold was reached. The time of the beginning of the lever turn on each trial was used as the reaction time for that trial. The only trials included in the analysis were those in which the monkeys maintained fixation on the central fixation cross until after the behavioral report of lever turn or lever release.
Spike density functions were calculated for each trial by convolving spike times with a Gaussian filter (σ = 10 ms). For the analysis of neural activity, we compared activity on trials when the target of the search array was in the response field to activity on trials when only distractors were in the response field. For some neurons, two adjacent stimulus locations were determined to be inside the response field because responses in the memory-guided saccade task were indistinguishable when the target was presented at those locations. Trials involving locations at the edge of a response field that produced weak responses to a target were excluded from all analyses. For invalid cue trials, distractor-related activity was from trials in which the red cue stimulus appeared in the response field. To be included in any of the analyses in this study a neuron had to exhibit significant spatially selective activity before the lever turn on correct trials and have at least four trials for each trial condition being compared.
The time course and magnitude of spatially selective activity were quantified by calculating the area under the receiver operating characteristic (ROC) curve from the single trial spike density functions at 1-ms nonoverlapping intervals aligned on the time of search array presentation. This method has been described in detail in previous reports (Thompson et al. 1996, 2005a). The ROC area measures the separation of two distributions normalized to values between 0 and 1 and corresponds to the probability of an ideal observer correctly identifying the distribution to which a sample belongs (Green and Swets 1966). An ROC area of 0.5 indicates that the two distributions of activity are completely indistinguishable. ROC areas of 0 and 1 are equivalent statistically; both indicate that the two distributions are completely separate. For each neuron in this study, the ROC analysis was used to compare the activity during trials in which the search array target was presented in the response field (RF) to the activity during trials in which the distractor was presented in the RF. As a convention, the analysis was structured so that ROC area values >0.5 indicate that the activity during trials in which the target was in the RF was greater than the activity during trials in which distractors were in the RF. In this report, the ROC area is referred to as the selectivity index (SI). Average SI values measured across time intervals, as shown in Fig. 3, are calculated by averaging the SI values obtained at each millisecond during the time interval.
Fig. 3.

Relationship between cue-related spatial selectivity in FEF neuron activity and behavioral measures of spatial attention for monkey C (open symbols; n = 19) and for monkey B (solid symbols; n = 30). For each neuron the cue-related SI was calculated for each trial condition as the average SI calculated from each millisecond between 50 ms before to 50 ms after the appearance of the search array. Only trials in which the CTOA was >100 ms were included. A: each point plots the average percentage correct performance across recording sessions as a function of average SI from each trial condition (circles: valid cue trials; triangles: neutral cue trials; squares: invalid cue trials). The error bars are SE across recording sessions for percentage correct performance and SE across neurons for SI. Correct and error trials were included in the analysis. The correlation across individual neurons and recording sessions is significant for both monkeys (monkey C: r = 0.30, P = 0.02; monkey B: r = 0.50, P < 0.001). B: each point plots the average of median reaction times in correct trials across recording sessions as a function of average SI in correct trials across trial conditions. Conventions are the same as those in A. The correlation across individual neurons and recording sessions is significant for both monkeys (monkey C: r = −0.32, P = 0.02; monkey B: r = −0.51, P < 0.001).
Only those neurons that exhibited spatially selective activity in the cued covert search task were included in this study. A neuron was determined to exhibit spatially selective activity if the average activity during correct valid cue trials was significantly greater in trials in which the target was in the RF than in trials in which a distractor was in the RF during the time interval between 150 ms following the appearance of the search array and the median reaction time. Statistical significance was determined using a t-test (P < 0.05).
Muscimol injection procedure
Muscimol injections were made in the right FEF of monkey B at the same sites from which we collected neuronal recording data presented in this report. Monkey C died unexpectedly before we were able to collect data during muscimol inactivation. Ten muscimol injection experiments were carried out after all the neuronal recordings were completed and were separated by ≥1 wk. On a muscimol injection day we inserted a 30-gauge cannula through a 23-gauge tube into the brain at a depth previously identified to contain spatially selective neurons. The other end of the cannula was connected to a 10-μl Hamilton syringe. An insulated wire threaded through the cannula, with its exposed tip extending 500 μm beyond the cannula tip, allowed us to record multiunit activity at each injection site (Crist et al. 1988). Each injection site exhibited strong multiunit visual and saccade-related activity in the memory-guided saccade task.
The experimental procedure was a follows. Before the injection we collected behavioral data from the monkey performing the memory-guided saccade task and the covert visual search task. On the days of muscimol injection we did not include neutral cue trials in the visual search task and used only one CTOA (235 ms); otherwise, the task was the same as that in the neuronal recording sessions (45% valid cue, 30% invalid cue, 25% no target). After recording the baseline data, we manually injected muscimol dissolved in saline (5 μg/μl) in boluses of 0.2 μl separated by ≥30 s. The total volume of solution injected ranged between 3 and 6 μl over a period of about 15 min. After about 20 min we had the monkey perform the memory-guided saccade task to assess the effectiveness of the inactivation. Our indicator of a successful injection was a marked deficit in the ability of the monkey to generate memory-guided saccades into the visual hemifield contralateral to the injection (Dias and Segraves 1999; Sommer and Tehovnik 1997). Once we observed a saccade deficit we recorded behavioral data of the monkey performing the memory-guided saccade task and the covert visual search task. The behavioral analysis of the muscimol inactivation data are described in results.
RESULTS
We recorded single-unit activity in the FEF of two monkeys performing a cued covert visual search task (Fig. 1A). The monkeys' task was to maintain fixation on the central cross and report the presence and identity of a peripheral leftward- or rightward-oriented gray Landolt C target in the search array with a leftward or rightward lever turn, respectively, or to report target absence by releasing the lever. In about 75% of trials a popout red ring among green rings in a cue array identified the most probable target location. In the remaining neutral cue trials, all the rings in the cue array were green.
The key experimental manipulations in this study were whether there was a red cue ring and the spatial relationship between the red cue ring and the Landolt C target. For each monkey we determined whether reaction time and performance accuracy varied with whether there was a spatial cue, with cue validity, and with duration of the cue-target onset asynchrony (CTOA) (Fig. 1B). The behavioral results were similar across CTOAs. The only exception was that reaction times were longer for the shortest CTOAs (0 ms for monkey C and 33 ms for monkey B). For all CTOAs, reaction times were shorter and performance accuracy was better on valid cue trials compared with invalid cue trials. For reaction time, an ANOVA that factored the type of trial (valid cue trial vs. invalid cue trial) and CTOA group revealed a significant difference in reaction times between valid and invalid cue trials (P = 0.005 for monkey C, P < 0.001 for monkey B) and across CTOA groups (P < 0.001 for both monkeys) due to the longer reaction times for the shortest CTOAs. When the shortest CTOA trials were removed, there was still a significant difference in reaction time between valid cue and invalid cue trials but there was no significant difference in reaction time across the remaining CTOA groups for either monkey. There was a significant difference in accuracy across valid cue and invalid cue trials (monkey C: P = 0.04; monkey B: P < 0.00001), with no difference across CTOA groups for either monkey. There were no significant interactions between CTOA and trial type for reaction time or performance accuracy.
The behavioral results from neutral cue trials tended to be intermediate between valid and invalid cue trials for monkey C and, similar to the results from invalid cue trials, for monkey B. Performance accuracy on no-target trials is included in Fig. 1B. Performance accuracy did not differ significantly across CTOAs for either monkey. For all trial types the performance accuracy was well above chance for a three-alternative choice task (33%), which indicates that the monkeys were using the stimuli in the search array to guide their behavioral reports. In addition, the improvement of performance on valid cue trials relative to invalid and neutral cue trials indicates that the monkeys used the red ring as a spatial cue to guide attention.
Average reaction times from correct and error trials across all recording sessions and CTOAs are compared in Fig. 1C. There were two types of errors in trials in which a target was present. The monkey could turn the lever in the wrong direction, indicating that the C target was present but incorrectly identifying its direction, or the monkey could release the lever, indicating that the target was not present. On no-target trials, an error was a lever turn indicating the presence of a target. There are two main results when comparing reaction times from correct and error trials. First, reaction times from lever turn error trials were slightly longer than those from correct lever turn trials (t-test: P = 0.02); reaction times from lever release error trials (miss errors) and correct lever release trials did not differ significantly (P = 0.2). This suggests that errors were not due to a speed–accuracy trade-off. Second, reaction times from correct and error lever release trials, in which the monkeys reported the absence of a target, were approximately double that of lever turn trials in which the monkeys reported the presence of a target. This doubling of reaction times in trials in which the target was not found is indicative of an inefficient, serial, self-terminating visual search (Chun and Wolfe 1996; Treisman 1988).
Neuron activity
The focus of this study is the relationship between spatially selective activity in FEF and visual perception, as indexed by the monkeys' behavioral report of target identity. In each recording session we advanced the electrode until we found a neuron that exhibited spatially selective activity during the cued covert search task. All neurons recorded were visually responsive and exhibited significant spatially selective activity for the location of the target before the lever turn in correct valid cue trials and were included in the analysis. The lack of nonselective neurons in our sample is explained by our recording procedures and should not be taken as evidence that all visually responsive FEF neurons exhibit spatially selective activity during covert visual search. In a previous study we found that about 70% of visually responsive neurons exhibited spatially selective responses during covert visual search tasks, whereas all saccade-related movement neurons were silent (Thompson et al. 2005b). A total of 49 spatially selective FEF neurons are included in this study (19 from monkey C and 30 from monkey B).
Figure 2 shows the activity during correct target-present trials from a representative FEF neuron recorded in monkey C performing the cued covert visual search task with three CTOAs. This neuron exhibited an initial visual response at about 80 ms following the cue array presentation that did not discriminate the red cue ring from the green rings. After the initial nonselective response, the neuron's activity identified the location of the red ring by exhibiting greater activity when a red ring was in the response field (RF) than when a green ring was in the RF. During valid cue trials (Fig. 2, left column), after the appearance of the search array the neuron maintained spatial selectivity for the target until the monkey's behavioral report. During invalid cue trials (Fig. 2, middle column), after the presentation of the search array, the spatial selectivity switched to identify the location of the target inside a green ring in the RF before the monkey's behavioral report. During neutral cue trials (Fig. 2, right column) the spatially selective response emerged after the appearance of the search array and identified the location of the target.
Fig. 2.

Activity of a single frontal eye field (FEF) neuron during correct target-present trials. A: average activity during valid cue trials (left column), invalid cue trials (middle column), and neutral cue trials (right column) separated by CTOA in different rows. The CTOAs of the trials in each row are indicated at the left. Activity is aligned on the time of the search array presentation and ends at the median reaction time of each trial condition. The time of cue array presentation is marked by a black triangle below each plot. The task illustrations at the top of the figure provide a key to the color and line types of the neuronal activity traces. The 2 response fields (RFs) in the task cartoons (solid and dotted) illustrate the contents of the RF in the 2 trial conditions compared in each plot. The color of the activity traces corresponds to the color of the cue array stimulus in the RF (red: red ring; green: green ring). The line type differentiates activity from trials in which the target C (solid line) or distractor stimulus (dotted line) appeared in the RF. B: analysis of the change in spatial selectivity in time for activity from trials with 235-ms CTOAs (bottom row in A). The selectivity index (SI) is the area under the receiver operating characteristic (ROC) curve computed at each millisecond from the activity occurring before the lever turn on individual trials. SI values >0.5 indicate selectivity toward the target location and SI values <0.5 indicate selectivity away from the target location.
The time course and magnitude of spatial selectivity in the cued covert search task were quantified for each FEF neuron using an ROC analysis (Thompson et al. 1996, 2005a). Examples of this analysis are shown in Fig. 2B for the activity recorded in 235-ms CTOA trials (Fig. 2A, last row). The area under the ROC curve quantifies the difference between two distributions normalized to values between 0 and 1, with 0.5 indicating completely overlapping distributions. Values of 0 and 1 indicate completely nonoverlapping distributions. The magnitude of spatial selectivity is indexed in the distance the ROC area is from 0.5; an ROC value of n is equivalent in magnitude to 1 − n. The analysis was structured so that ROC values >0.5 indicate spatial selectivity toward the target location and ROC values <0.5 indicate spatial selectivity away from the target location. For convenience we will refer to the ROC area as the selectivity index (SI).
Before the visual response to the cue array, the SI was close to 0.5, indicating equivalent baseline activity (Fig. 2B). Following the visual response to the cue array the activity for the red ring stimulus during valid and invalid cue trials grew to higher levels than the activity for the green ring stimuli. This emerging difference in activity is reflected in a change in the SI that begins around 100 ms following the presentation of the cue array. Due to the way the ROC analysis was structured, the initial change in the SI is toward 1 on valid cue trials, indicating that the spatial selectivity was directed toward the future target location, and toward 0 on invalid cue trials, indicating that the spatial selectivity was directed away from the future target location. During neutral cue trials, the SI remained around 0.5, indicating equivalent activity before the presentation of the search array. After the presentation of the search array, but before the behavioral report, the SI across all trial conditions was >0.5, reflecting the selection of the target location. The switch in spatial selectivity during invalid cue trials from the cue location to the target location is indexed by the changing SI in time from values <0.5 following the cue array to values >0.5 following the target array. The pattern of activity exhibited by the example neuron shown in Fig. 2 was present in the activity of all 49 neurons (see Figs. 4–6) included in this study. The time course of spatial selectivity across trial conditions is consistent with the hypothesis that FEF neurons track the monkey's allocation of spatial attention in the task. The activity first identifies the location of the popout singleton cue and, following the appearance of the target array, the spatially selective activation identifies the location of the target object to be identified.
Fig. 4.

Population analysis of activity during correct and error valid cue trials. Color and line conventions are the same as those in Fig. 2. A–C: pooled average activity in (A) correct trials, (B) lever turn error trials, and (C) lever release error trials for the 17 neurons with enough trials for the analysis of all 3 trial conditions. The percentages of each trial type from all valid cue trials are indicated in the corresponding plots. Activity is aligned on the time of the search array appearance and ends at the average of median reaction times across the included sessions. The range of median reaction times across recording sessions from correct valid cue trials is indicated by the bracket above the activity plots. The vertical line within the RT bracket represents the median reaction time on correct trials. D: pooled average SI from correct (solid line) and error trials (dotted line). All error trials were combined to obtain a greater number of neurons with enough trials to analyze (n = 29). SE at each millisecond is indicated by the width of the dark gray (correct trials) and light gray (error trials) shading. The horizontal black bar above the time axis marks periods of significantly greater spatial selectivity in correct trials than in error trials (paired t-test, P < 0.05). The inset plot shows the pooled average SI from correct and error trials with CTOAs of 0 and 33 ms. E: average normalized activity between 150 ms after search array presentation and median reaction time in correct trials from the 17 neurons shown in A–C (the time range is shown by the gray bars). Activity was normalized for each neuron by dividing the average activity values by the average activity obtained from all distractors in the RF trials, including both correct and error trials. Error bars in E indicate SE across neurons. Solid red bars show the average normalized activity during trials in which the red cue ring and target were in the neurons' RF. Dotted green bars show the normalized activity during trials in which the green ring and distractors were in the neurons' RF. The average normalized activity on correct trials, lever turn error trials, and lever release error trials are shown separately. The magnitude of target-related activity varied significantly across the 3 trial types (Friedman test for related samples, P = 0.014). Distractor-related activity did not vary significantly across the 3 trial types (Friedman test, P = 0.33).
Fig. 5.

Population analysis of activity during correct and error invalid cue trials. Figure conventions are the same as those in Fig. 4. Color and line conventions are the same as those in Fig. 2. A–C: pooled average activity in (A) correct trials, (B) lever turn error trials, and (C) lever release error trials for the 22 neurons with enough trials for the analysis of all 3 trial conditions. D: pooled average SI ± SE from correct (solid line, dark gray shading) and error trials (dotted line, light gray shading). The horizontal black bar above the time axis marks periods of significantly greater spatial selectivity in correct trials than in error trials (paired t-test, P < 0.05). The inset plot shows the pooled average SI from correct and error trials with CTOAs of 0 and 33 ms. E: average normalized activity between 150 ms after search array presentation and median reaction time in correct trials from the 22 neurons shown in A–C. Error bars indicate SE across neurons. The magnitude of target-related activity (solid green bars) varied significantly across the 3 trial types (Friedman test for related samples, P < 0.001). Distractor-related activity (dotted red bars) did not vary significantly across the 3 trial types (Friedman test, P = 0.14).
Fig. 6.

Population analysis of activity during correct and error neutral cue trials. Figure conventions are the same as those in Fig. 4. Color and line conventions are the same as those in Fig. 2. A–C: pooled average activity in (A) correct trials, (B) lever turn error trials, and (C) lever release error trials for the 32 neurons with enough trials for the analysis of all 3 trial conditions. D: pooled average SI ± SE from correct (solid line, dark gray shading) and error trials (dotted line, light gray shading). The horizontal black bar above the time axis marks periods of significantly greater spatial selectivity in correct trials than in error trials (paired t-test, P < 0.05). The inset plot shows the pooled average SI from correct and error trials with CTOAs of 0 and 33 ms. E: average normalized activity between 150 ms after search array presentation and median reaction time in correct trials from the 32 neurons shown in A–C. Error bars in indicate SE across neurons. The magnitude of target-related activity (solid green bars) varied significantly across the 3 trial types (Friedman test for related samples, P < 0.001). Distractor-related activity (dotted green bars) did not vary significantly across the 3 trial types (Friedman test, P = 0.7).
Spatial versus object selectivity
The results of a recent study showed that some FEF neurons can exhibit shape-selective responses for different visual stimuli (Peng et al. 2008). Therefore it is possible that the target-selective responses we observed could be related to the object in the RF, not its location. We examined whether neurons included in this study exhibited any evidence of a preference for leftward- or rightward-oriented C targets. For each neuron we compared the firing rates from valid cue trials with leftward C target in the RF field to those with rightward C targets in the RF. The average firing rate measured between 100 ms after search array onset and median reaction time did not differ significantly for 94% (46/49) of neurons (t-test, P > 0.05). Although three neurons exhibited a slightly significant difference in firing rate (P < 0.05), the difference never exceeded 10%. The key result was that all 49 neurons exhibited a strong spatially selective response for both leftward- and rightward-oriented C targets. The same result was found in a previous study using similar visual stimuli (Thompson et al. 2005b). Therefore we conclude that the neurons recorded in this study did not exhibit object-related selectivity for the C target, but instead represented the location of the target to be identified. Note that this result also rules out the possibility that the neurons responded differently for the two motor behaviors used to turn the lever leftward or rightward.
Relationship of cue-related spatial selectivity to behavioral measures of spatial attention
In a previous report we showed that the activity of FEF visually responsive neurons identifies the location of the visual search target in monkeys performing easy popout visual search tasks in the absence of eye movements (Thompson et al. 2005b). We hypothesized that the spatially selective activity corresponded to the allocation of covert spatial attention; however, this was a hypothesis based on psychophysical reports showing that the oddball targets of popout search arrays automatically capture attention (Egeth and Yantis 1997; Turatto and Galfano 2000). The relationship between the spatially selective responses in FEF to spatial attention was not tested directly.
Here, with the cued covert search task, we address whether there is a relationship between the spatially selective activity in FEF for a color popout singleton stimulus and behavioral measures of attention in a difficult visual discrimination task obtained simultaneously in the same monkeys. Overall, the spatially selective activity for the spatial cue is consistent with the behavioral results (Fig. 1B). Across recording sessions, the highest proportion of correct trials and the fastest reaction times were observed in valid cue trials in which the spatially selective responses to the singleton target of the popout cue array matched the location of the target to be identified (Fig. 3). For each neuron we quantified the cue-related selectivity during valid, invalid, and neutral cue trials as the average SI calculated from each millisecond between 50 ms before to 50 ms after the appearance of the search array. This period of time captures the activation related specifically to the cue array during the 100 ms just prior to the beginning of activity related to the search array. Only trials with CTOAs >100 ms were included in this analysis because shorter CTOAs do not allow for the opportunity for cue-related responses to develop before the search arrays appears (see Fig. 2A, top row). Figure 3A plots, for the two monkeys separately, average performance accuracy across recording sessions as a function of average SI for each trial condition from all neurons. Error trials were included in the SI calculations because performance accuracy is a measure that includes correct and incorrect behavioral reports. Figure 3B plots reaction time from correct trials averaged across recording sessions as a function of average SI calculated from correct trials.
The magnitude of spatial selection for the location of the red ring before the presentation of the search array did not differ between valid and invalid cue trials. SI values of 0.3 and 0.7 are equivalent in magnitude but opposite in direction relative to the location of the target (Fig. 3). Performance accuracy was best and reaction time was fastest when the cue-related spatial selectivity was directed toward the future target location during valid cue trials. The worst performance accuracy and slowest reaction times were from trials when the cue-related selectivity was directed away from the future target location during invalid cue trials. During neutral cue trials there was not a spatially selective response for the cue array and the behavioral measures were intermediate. There was a weak spatial bias in correct neutral cue trials (Fig. 3B) that will be addressed in the following text (see Fig. 6). A Pearson correlation analysis using the ROC areas and behavioral measures obtained from individual recording sessions revealed significant positive correlations for accuracy (monkey C: r = 0.30, P = 0.02; monkey B: r = 0.50, P < 0.001) and significant negative correlations for reaction time (monkey C: r = −0.32, P = 0.02; monkey B: r = −0.51, P < 0.001).
The results in Fig. 3 show that behavioral performance differences across trial conditions are correlated with the magnitude of spatial selection for the target location induced by the cue array. This pattern of results is consistent with behavioral studies of spatial attention showing improvements in perceptual performance at the attended location at a cost to perceptual performance at nonattended locations (Pashler 1998; Posner 1980). This correlation, however, demonstrates an overall probabilistic relationship between neuronal activity and perceptual performance. It is entirely predictable based on the behavioral and neurophysiological results. The same relationships between ROC area and behavior across trial conditions shown in Fig. 3 are obtained when the behavioral data collected on one day are paired with the neurophysiological data collected on another day. Consequently, this analysis does not account for perceptual performance on individual trials. It is likely that the monkeys' perceptual performance was influenced by trial-to-trial variability in attentional allocation. In the following analyses we directly examine the relationship between FEF activity and the monkeys' ability to detect and identify the target of the search array as indexed by their behavioral report.
Accuracy of target identification
Within each trial condition we compared activity across physically identical trials with different behavioral outcomes, to examine how FEF activity contributes to the monkeys' behavioral report. This approach also allows us to examine when the variability in the magnitude of spatial selection matters most for object identification. Only trials with CTOAs >100 ms were included in this analysis. Results from the shorter CTOA trials are qualitatively the same as those for the longer CTOA trials (see inset plots in Figs. 4D, 5D, and 6D). Shorter CTOA trials were not included in the analysis because the spatially selective activity follows a different time course. The cue-related responses occur after the presentation of the target array and thus do not allow for the examination of cue-related responses preceding target array presentation. Because the monkeys' behavior across the remaining longer CTOAs were not different they are combined to obtain a greater number of trials for analysis. Also, the neuronal activity results from the two monkeys were not different, so they are combined.
VALID CUE TRIALS.
Figure 4 shows an analysis of the population activity during valid cue trials. The target appeared inside the red ring. In Fig. 4, A–C the population average activity during trials in which the red cue ring and the target were presented in the RF is compared with the population average activity during trials in which a green ring and distractor were presented in the RF. Shown in Fig. 4 are plots of the average activity in correct trials (Fig. 4A), error trials in which the monkeys made an incorrect lever turn (Fig. 4B), and error trials in which the monkeys released the lever (Fig. 4C) from the 17 neurons that had enough trials for the analysis.
Before the appearance of the search array there is greater activity for the red cue ring than for the green rings in both correct and error trials. After search array presentation, the spatially selective response continues in both correct and error trials. During the error trials in which the monkeys released the lever, thereby reporting that no target was present, the spatially selective response eventually disappears before the behavioral report (Fig. 4C). We hypothesize that the decline in spatial selectivity on lever release errors is due to the monkey mistakenly shifting attention away from the cue location to find the target (compare with Fig. 7).
Fig. 7.
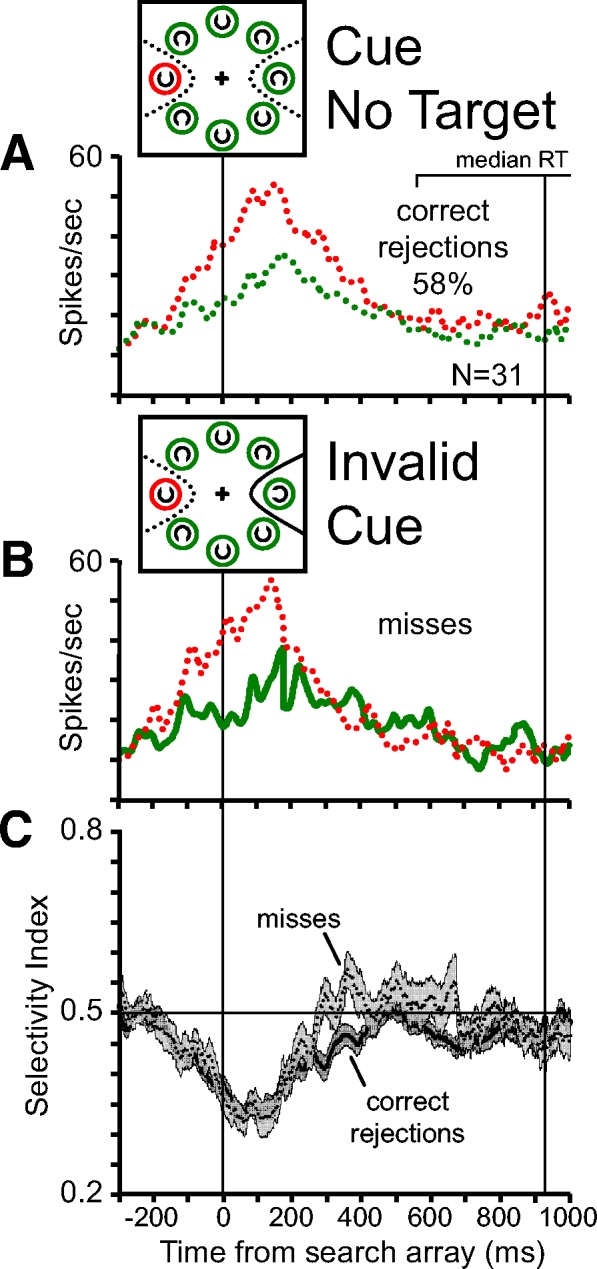
A comparison of population average activity during (A) correct rejection trials and (B) invalid cue miss trials. In both types of trials the monkey reported target absence by releasing the lever and reaction times (RTs) did not differ across trial conditions (Wilcoxon rank-sum test; P = 0.9). A: pooled average activity during correct rejection trials. The activity during trials in which the red ring and a distractor were presented in the RF (red dotted line) is compared with the activity in which a green ring and a distractor were presented in the RF (green dotted line). Activity is aligned on the time of search array presentation. The brackets above the plot show the range of median RTs during individual recording sessions. The vertical line within the RT bracket indicates the median RT on correct rejection trials across recording sessions. The percentage of correct rejection trials from the total number of no-target trials is indicated. B: pooled average activity during invalid cue miss trials. Conventions are the same as those in Fig. 5C. C: a comparison of the pooled average SI in correct rejection trials (solid line, dark gray shading) and invalid cue miss trials (dotted line, light gray shading). SI values <0.5 indicate selection of the cue stimulus and SI values >0.5 from invalid cue trials indicate selection of the target stimulus.
Reaction times were faster in correct trials than those in error trials (Fig. 1C). Reaction times from correct trials thus provide an endpoint time to look for a difference in FEF activity that is predictive of the monkeys' accuracy of reporting target identity. In other words, to influence target identification, modulations of activity must occur before the monkeys typically would make a correct report of target identity. For each neuron, the time course of the SI was calculated from correct and error trials up to the median reaction time from correct trials. To include the maximum number of neurons in the analysis, the two types of error trials were combined. Each neuron contributes two SI traces—one from correct trials and one from error trials. Two main points are evident in Fig. 4D. First, the spatially selective responses for the red cue in correct and error trials occurring before the appearance of the search array do not differ (paired t-test on the average SI from −100 to +50 ms: P = 0.9). Second, the spatially selective responses in correct and error trials become different after the presentation of the search array (paired t-test on the average SI from 150 ms to median RT: P = 0.004). To obtain a more precise estimate of when the magnitude of spatial selectivity differs across correct and error trials, we compared the SI values at each millisecond using a paired t-test. Statistically significant (P < 0.05) differences were found between 143 and 271 ms after the search array appeared and are indicated by a black bar in Fig. 4D.
The two types of error trials are qualitatively different. Lever turn errors indicate that the monkey detected a target C but incorrectly identified its direction and lever release errors indicate that the monkey did not detect the presence of a target C in the search array. We examined whether there are differences of activity for the two types of errors. Figure 4E compares the average magnitude of neuronal activity in correct and error valid cue trials before the time the monkeys made a correct behavioral report. For each neuron we calculated the average activity for each trial type from 150 ms after the presentation of the search array to the median reaction time from correct trials for both the target in the RF and the distractors in the RF trials. The average activity values were normalized for each neuron by dividing them by the average value from all distractors in the RF trials including both correct and error trials. The neurons exhibited significantly greater activity for the target C in the RF than for distractors in the RF during correct and error trials (paired t-test, P < 0.001). However, the magnitude of target-related activity varied significantly across the three trial types (Friedman test for related samples, P = 0.014) and was ranked according to the correctness of the behavioral report. The highest activity was during correct trials, intermediate activity was during the partially correct trials in which the monkeys correctly reported that the target C was present but incorrectly reported its direction, and the lowest activity was during error trials in which the monkey reported that the target was absent. Distractor-related activity did not vary significantly across the three trial types (Friedman test, P = 0.33).
INVALID CUE TRIALS.
Figure 5 shows the analysis of the population activity during invalid cue trials. The target appeared in one of the three green rings opposite the red ring. Activity before the appearance of the search array was selective for the location of the red cue ring in correct and in error trials (Fig. 5, A–C). The magnitude of the cue-related spatial selectivity, quantified by the SI (Fig. 5D), is the same as that in valid cue trials because before the appearance of the search array the monkeys have the same expectation of target location. Also, the cue-related spatially selective activity in correct trials was not different from that in error trials (paired t-test on the average SI from −150 to +50 ms, P = 0.6). After search array presentation, the spatially selective responses in correct and error trials become markedly different (paired t-test on the average SI from 150 ms to median RT: P < 0.001). In correct trials, there is a clear switch of spatial selectivity from the location of the red ring to the location of the C target. This switch in spatial selectivity during correct trials is clearly observed in Fig. 5D. The SI shifts from values <0.5 before and immediately after search array onset to values >0.5 after about 150 ms following search array onset. In error trials, the shift of spatial selectivity away from the red cue was sluggish and by the time that the monkeys made a lever turn in correct trials, the activity in error trials only weakly identified the location of the target. The SI from correct trials became significantly greater than the SI from error trials at 136 ms following search array presentation and continued past the median reaction time of correct trials.
Figure 5E compares the average magnitude of normalized neuronal activity during correct trials, lever turn error trials, and lever release error trials in the time period between 150 ms following the presentation of the search array to the median RT of correct trials. During this time the neurons exhibited greater activity for the target in the RF than for distractors in the RF in correct trials (paired t-test, P = 0.003), but not in error trials. As in valid cue trials, the magnitude of target-related activity varied significantly across the three trial types (Friedman test for related samples, P < 0.001) and was ranked according to the correctness of the behavioral report. Distractor-related activity did not vary significantly across the three trial types (Friedman test, P = 0.14).
NEUTRAL CUE TRIALS.
Figure 6 shows the analysis of the population activity during neutral cue trials in which there was no spatial cue—all the rings in the cue array were green. There was not a red cue ring in the cue array and before the appearance of the search array the activity was not spatially selective (Fig. 6, A–C). Spatial selectivity emerged after the presentation of the search array and identified the location of the target. Like the results from valid and invalid cue trials, the SI from correct trials was greater than the SI from error trials during the time in which the search array was present (Fig. 6D; paired t-test on the average SI from 150 ms to median RT: P < 0.001). However, unlike the results from valid and invalid cue trials, the SI before and around the appearance of the search array was slightly yet significantly greater during correct trials than during error trials (paired t-test on the average SI from −150 to +50 ms, P = 0.02). This result suggests that in the absence of an exogenous spatial cue the monkeys anticipated the location of the target and this anticipation is reflected in FEF activity. When the monkey correctly anticipates the location of the target, as indexed by a slightly higher SI, he is more likely to correctly identify the target once the array appears. It should be noted, however, that this weak anticipatory bias was associated with performance accuracy but not with reaction time differences across trials (see Fig. 8).
Fig. 8.

The relationship between the SI and the speed of target identification. A–C: pooled average SI ± SE from correct valid cue trials (A), invalid cue trials (B), and neutral cue trials (C) separated in fast reaction time (fastest 35% of trials: solid line, dark gray shading) and slow reaction time (slowest 35% of trials: dotted line, light gray shading) trial groups. All plots end at the average of the median RTs across the included sessions. The ranges of median reaction times from the fast RT groups are shown by the brackets above each plot and the vertical line represents the median RT across recording sessions. The horizontal black bars above the time axis indicate periods in which the SI was significantly different for ≥30 consecutive milliseconds between fast and slow RT groups (paired t-test, P < 0.05). D and E: the relationship between the time of spatial selection and the speed of target identification during invalid cue trials. The selectivity switch time is defined as the time the SI crosses 0.5 during invalid cue trials—the time that the spatially selective activity switches from the red cue ring to the C target. D: each point of the scatterplot compares the selectivity switch time from fast RT and slow RT trials from a single neuron (n = 24). Open symbols: monkey C; solid symbols: monkey B. E: distribution of the percentage of change in reaction time accounted for by the change in selectivity switch time for single neurons. The average across all neurons is 21 ± 4%.
Figure 6E compares the average magnitude of normalized neuronal activity during correct trials, lever turn error trials, and lever release error trials in the time period between 150 ms following the presentation of the search array to the median RT of correct trials. During this time in correct neutral cue trials the neurons exhibited greater activity for the target in the RF than for distractors in the RF (Fig. 6A; paired t-test, P < 0.001). During error trials in which the monkey made an incorrect lever turn the difference was marginally significant (Fig. 6B; P = 0.05) and during error trials in which the monkey released the lever the activity did not differ significantly (Fig. 6C; P = 0.4). As in valid and invalid cue trials, the magnitude of target-related activity varied across the three trial types (Friedman test for related samples, P = 0.001) and was ranked according to the correctness of the behavioral report. Distractor-related activity did not vary significantly across the three trial types (Friedman test, P = 0.7).
TARGET-ABSENT TRIALS.
In roughly 25% of trials, no target appeared and all the search array stimuli were distractors. The monkeys were rewarded for reporting target absence by releasing the lever. We identify these trials as correct rejections (Green and Swets 1966). The average reaction time of correct rejection trials was approximately double that of correct target-present trials (see Fig. 1C). There is a spatially selective response for the location of the red cue stimulus during correct rejection trials (Fig. 7A). The red cue ring is present for the entire trial, but following the presentation of the search array the spatially selective response for the red cue ring weakens and eventually disappears before the monkeys release the lever to report target absence. We hypothesize that the reduction of the spatially selective response corresponds to the monkeys shifting attention away from the red cue stimulus to find the target. A similar pattern of neural activity was observed on invalid cue misses—i.e., trials in which the target was present but was not identified or detected (Fig. 7B). Although the target was present, the monkeys' behavioral report was the same as that on correct rejections—they released the lever reporting target absence. Reaction times of misses were not statistically different from reaction times of correct rejections (Wilcoxon rank-sum test; P = 0.9) (see Fig. 1C). The similar reaction times lend confidence to the assumption that when a monkey incorrectly released the lever on a target-present trial he was performing the task and accurately reporting his percept that the target was absent.
We examined whether there was evidence of target presence in the neural activity on invalid cue misses even when the monkeys reported target absence. As on correct rejections, following the appearance of the search array, the spatial selectivity for the cue location disappears and the SI returns to values near 0.5. However, during miss trials the SI moves toward 0.5 at a faster rate and ends at slightly higher values than those during correct rejection trials. The average SI calculated from the neural activity on correct rejection trials and miss trials measured between 150 ms following the search array and the median reaction time of correct rejections differ significantly (P = 0.01). Therefore it appears that the presence of a target stimulus influences the shift in the spatially selective response away from the red cue stimulus even when the target is not detected by the monkey. However, after the appearance of the search array a spatially selective response for the target location never develops. These results provide neurophysiological evidence that a visual spatial selection process is influenced by features of objects but must reach a threshold level before an object can be detected and identified.
Speed of target identification
Manual reaction times have classically been used to measure the benefits and costs of allocating spatial attention (Pashler 1998; Posner 1980). The idea behind this practice is that directed attention speeds perceptual processing at the cued location, thus leading to faster reaction times. Therefore we reasoned that if FEF activity corresponds to the allocation of attention, then some aspect of the spatially selective response could be related to the time it takes for the monkey to report the identity of the target stimulus. To test this hypothesis we separated correct trials from each recording session into fast reaction time groups (fastest 35% of the trials) and slow reaction time groups (slowest 35%) for each trial condition and calculated the SI as before to quantify the time course and magnitude of spatial selectivity.
Figure 8, A–C plots the average SI from the fast and slow reaction time groups for correct valid cue trials (Fig. 8A), correct invalid cue trials (Fig. 8B), and neutral cue trials (Fig. 8C). The critical question is whether there are differences in the SI before the monkey reports the identity of the target in fast reaction time trials that could account for the difference in reaction times across the two groups of trials.
The consistent result for all three trial conditions is that the selectivity for the target location, as indexed by the SI, is greater in fast reaction time trials than in slow reaction time trials. In Fig. 8, A–C, the paired t-test at each millisecond found a few brief significant differences (P < 0.05) in the cue-related activity prior to the appearance of the search array. These brief intervals can be identified by the regions of nonoverlapping SE values from fast and slow RT trials (e.g., in Fig. 8A between −200 and 0 ms). These intervals are not marked with a bar along the x-axis in Fig. 8 because they are <30 ms in duration and indicate differences in both directions. Therefore these brief intervals cannot account for the differences in reaction times across trials. Also, a paired t-test on the average SI between −100 to +50 ms relative to the presentation of the search array did not reveal significant differences between fast RT and slow RT trials for any of the trial conditions (valid cue trials: P = 0.5; invalid cue trials: P = 0.6; neutral cue trials: P = 0.3). Across all three trial conditions there was a greater spatially selective response in fast reaction time trials measured between 150 ms and the median RT on fast RT trials (valid cue trials: P = 0.005; invalid cue trials: P = 0.001; neutral cue trials: P = 0.01). The important result is that the difference in the magnitude of spatial selectivity between fast and slow reaction time trials occurs during the time in which the visual system is processing the target of the search array. This result suggests that the magnitude of the spatial selection in FEF influences the speed of the visual processing leading to target identification.
Some of the difference in reaction time across trials could be due to differences in the speed of the visual selection process rather than the magnitude of selection. We probed this relationship by examining the time of the switch of spatial selectivity during invalid cue trials from the location of the red cue ring to the location of the target. For each neuron, we identified the time that the ROC area crossed 0.5 after the presentation of the target search array on invalid cue trials. We termed this time the selectivity switch time, indicated in Fig. 8B. The scatterplot in Fig. 8D compares the selectivity switch times in fast reaction time trials and slow reaction time trials from all neurons with enough correct invalid cue trials for the analysis (n = 24). For monkey C, the average ± SE selectivity switch time was 127 ± 7 ms in fast trials and 170 ± 18 ms in slow trials. For monkey B, the average selectivity switch time was 186 ± 11 ms in fast trials and 227 ± 13 ms in slow trials. For both monkeys the selectivity switch time in fast and slow trials differed significantly (paired t-test; P < 0.001).
If the variability in reaction time is simply related to when the target is selected, then the increase in target switch time should be the same as the increase in reaction time. To test this, for each neuron we calculated the percentage change in reaction time accounted for by the change in selectivity switch time (Fig. 8E). On average, the percentage of the increase of reaction time accounted for by the increase of selectivity switch time was 21 ± 4%. Therefore about 20% of the variability in reaction time to accurately report the identity of the target during invalid cue trials can be attributed to the time of visual selection as measured in FEF. Other contributing factors may include the difference in the magnitude of spatial selection as well as variability in motor processes that occur after target identification.
Chemical inactivation of FEF
The previous neurophysiological results demonstrate that the magnitude of spatially selective activity in FEF is correlated with behavioral measures of covert spatial attention. To examine whether there is a causal relationship between FEF activity and visual target identification in the covert search task we injected the GABAA agonist muscimol into the right FEF of monkey B at the same locations from which we recorded the spatially selective neurons included in this report (see methods for details).
Muscimol injections were made in 10 experimental sessions separated by ≥7 days. All the muscimol inactivation sessions were after the neural recordings were completed. Results from a representative session are shown in Fig. 9, A–C. Figure 9A shows eye-movement traces from the memory-guided saccade task before the injection (left) and after about 20 min following the injection of muscimol (right) into the right FEF. The red eye-movement traces are from trials in which the saccade target was flashed in the visual hemifield contralateral to the side of injection. During muscimol inactivation the monkey's inability to initiate saccades into the contralateral hemifield is quite apparent and has been described previously (Dias and Segraves 1999; Sommer and Tehovnik 1997). When the target was in the contralesional hemifield, saccades were usually initiated, but they were not directed to the target locations and had long saccade latencies. Saccades to ipsilesional targets were also affected, often with shorter saccade latencies and target overshooting. We used the time to initiate memory-guided saccades to each target location as a measure of the effectiveness of inactivation at each target location. Figure 9B shows the average saccade latency (SL) at each target location in the memory-guided saccade task before and during a single muscimol inactivation. The saccade latency deficit (SLdifference = SLduring − SLbefore) was greatest at the leftward location and varied across the other contralesional and downward locations. Although across all 10 inactivation sessions there was a saccade latency deficit to targets in the contralateral hemifield, there was variability in the spatial extent, the magnitude, and the location of the greatest saccade latency deficit. This variability is likely due to the different locations of the injection and the variability in the amount and spread of the muscimol in the brain from one experimental session to the next.
Fig. 9.

Inactivation of FEF. A: eye-movement traces in the memory-guided saccade task before (left) and during (right) muscimol inactivation from a single experimental session. Muscimol was injected in the right FEF. Red traces indicate trials that the target was presented in the contralesional visual hemifield. B: average saccade latencies (±SE) in the memory-guided saccade task for each target location before (solid line, solid symbols) and during (dotted line, solid symbols) muscimol inactivation. The change in average saccade latency at each target location following muscimol inactivation is shown (solid line open symbols). C: performance accuracy from the same experimental session in the covert search task is plotted for valid cue trials (left plot, red lines) and invalid cue trials (right plot, green lines) for each target location before (solid line, solid symbols) and during (dotted line, solid symbols) muscimol inactivation. The change in performance accuracy following muscimol inactivation is shown for both trial conditions. D: relationship between the change in saccade latency in the memory-guided saccade task and the change in performance accuracy in the covert search task across the 10 experimental sessions. Each small open circle plots the change in performance accuracy as a function of the change in saccade latency for a single target location in a single experimental session for valid cue trials (red) and invalid cue trials (green). Each large solid circle plots the average change in performance accuracy as a function of the average change in saccade latency across 8 successive values along the abscissa (change in saccade latency). The 3 asterisks along the abscissa mark the groups in which the change in performance accuracy on invalid cue trials is significantly greater than that on valid cue trials (left to right: P = 0.02, P = 0.001, P = 0.001). The linear regression lines for all data points are shown for valid cue (red) and invalid cue (green) trials. E: relationship between the change in saccade latency in the memory-guided saccade task and the reaction time on correct trials in the covert search task across the10 experimental sessions. Each small open circle plots the change in reaction time as a function of the change in saccade latency for a single target location in a single experimental session for valid cue trials (red) and invalid cue trials (green). Each large solid circle plots the average change in reaction time as a function of the average change in saccade latency across 8 successive values along the abscissa. The linear regression lines for all data points are shown for valid cue (red) and invalid cue (green) trials.
Accuracy of target identification in the covert search task before and during the example muscimol inactivation session is shown in Fig. 9C. Even before the muscimol injection, perceptual performance accuracy is not equal across all target locations. To quantify the effect of inactivation on the monkey's performance accuracy we calculated the change in percentage correct (PC) at each target location following muscimol injection (PCdifference = PCduring − PCbefore). In addition to the quantification of the change in percentage correct performance (Fig. 9C), we also quantified the change in mean reaction time (RT) on valid cue and invalid cue trials (not shown) for each experimental session.
We performed a correlation analysis to relate the effectiveness of the FEF inactivation at each target location, as indexed by the change in mean saccade latency in the memory-guided saccade task, to the change in perceptual performance. This analysis was carried out for the change in percentage correct performance (Fig. 9D) and the change in correct lever turn mean reaction time (Fig. 9E) following the muscimol injection. Each small data point represents a pair of values from one of the eight target locations in one of the ten experimental sessions. There are a total of 80 small data points in each plot; each point relates the effectiveness of the muscimol inactivation at a specific spatial location to the change in perceptual performance at that location for a single experimental session. Each large solid data point is the average across 8 consecutive nonoverlapping small data points along the x-axis.
There are strong negative correlations between the change in saccade latency in the memory-guided saccade task and the change in target identification accuracy in the covert visual search task (Fig. 9D) for both valid cue trials (r = −0.43; P < 0.001) and invalid cue trials (r = −0.55; P < 0.001). Target locations associated with the greatest slowing of saccade latency were those that produced the greatest deficit in target identification. Interestingly, the results show that FEF inactivation differentially affects performance accuracy on valid versus invalid cue trials. Paired t-tests on each group of eight data points showed that there was a significantly greater perceptual deficit on invalid cue trials than on valid cue trials for the three groups with the greatest saccade latency deficits (P = 0.02, P = 0.001, P = 0.001, respectively). This difference between valid and invalid trials is likely related to a decreased ability during FEF inactivation to endogenously shift attention from the red spatial cue to the noncued location containing the target to be identified.
There were significant positive correlations between the change in saccade latency in the memory-guided saccade task and the change in target identification RT on correct covert search trials for both valid cue trials (r = 0.37; P = 0.001) and invalid cue trials (r = 0.30; P = 0.007) (Fig. 9E). Like the results for performance accuracy, the target locations with the greatest saccade deficit tended to be the locations with the greatest deficit in the speed of target identification in the covert search task. However, unlike performance accuracy, the effect of FEF inactivation on the speed of target identification did not differ significantly for valid cue and invalid cue trials across the range of saccade deficits.
The results were consistent across the 10 experimental sessions. We performed correlation analyses on the results from each individual session including the values from both valid cue and invalid cue trials for greater statistical power. The same trends observed in the population analyses (Fig. 9, D and E) were observed in the data from each session. For all 10 inactivation sessions the saccade latency deficit was negatively correlated with performance accuracy (means ± SE; r = −0.56 ± 0.04) and in 7 sessions the correlations were significant (P < 0.05). There were positive correlations with correct lever turn reaction time for all 10 sessions (mean = 0.36 ± 0.06) and 4 were significant. We also performed a partial correlation analysis, controlling for any correlations caused by differences across sessions, and obtained the same results for performance accuracy (valid trials: r = −0.43, P < 0.001; invalid trials: r = −0.54, P < 0.001) and for correct lever turn reaction time (valid trials: r = −0.41, P < 0.001; invalid trials: r = −0.30, P < 0.007). Therefore the strong correlations between the effectiveness of the inactivation and perceptual performance were not due to differences across experimental sessions.
DISCUSSION
The goal of this study was to directly link neuronal activity in FEF to the efficacy of visual processing leading to subjective perception of a target object as indexed by a behavioral report. This was done using single-unit recordings and chemical inactivation to determine whether the spatially selective responses of FEF neurons are related to behavioral measures of spatial attention in a cued object identification task in the absence of eye movements. We used a color popout stimulus as an exogenous spatial cue to inform the monkey of the most probable location of a target to be identified. If the target was not at the cue location (invalid cue trials) or if there was no spatial cue (neutral cue trials), the monkeys had to covertly search for the target by endogenously (i.e., willfully) shifting attention to noncued locations. The doubling of reaction time in no-target trials to report target absence indicates that the search for the target was inefficient and effortful (Chun and Wolfe 1996; Treisman 1988).
To directly link FEF activity to covert visual attention, we correlated the activity of FEF neurons with the perceptual performance of the monkeys on a trial-by-trial basis. We asked whether and when in the course of a covert visual search task do differences in neural activity correspond to differences in visual perception as indexed by a behavioral report. The results of this study provide strong evidence that spatially selective activity in FEF plays a causal role in the enhancement of visual processing associated with spatial attention. The magnitude of the spatially selective response in FEF predicts the accuracy and speed of target identification specifically during the time during which the target stimulus is being processed by the visual system. In all trial conditions, the correlation between neural activity and the behavioral measures of perceptual performance occurred predominantly between 100 ms following the presentation of the target to be identified and the initiation of the behavioral report. This is the period of time during which the processing related to target detection and identification is taking place in the visual system. Furthermore, we showed that chemical inactivation of FEF produces spatially selective deficits in the speed and accuracy of object identification that are greater on invalid cue trials, suggesting that FEF plays a relatively greater role in endogenous than that in exogenous attention processes.
Role of FEF in object detection and recognition
The task used in this study requires the monkey to detect and identify a visual object. We found no evidence that FEF neurons could identify whether the C target was leftward or rightward (see also Thompson et al. 2005b). Therefore the correct behavioral report of target identity in this task cannot be determined from the activity recorded in FEF. This is an important distinction between the results of the current study and those from a previous report in which we showed that FEF neurons reliably identify the location of a popout stimulus during covert visual search even when the monkeys incorrectly report the target's location (Trageser et al. 2008). The responses of the FEF neurons in the current study identify cue and target locations, but the monkeys are rewarded for reporting target identity.
In the primate visual system, there is strong evidence the representation and analysis of visual objects takes place primarily in the temporal lobes along the ventral visual processing stream (Logothetis and Sheinberg 1996; Tanaka 1997). Psychophysical studies have shown that spatial attention is necessary for object recognition in natural scenes (Evans and Treisman 2005; Rensink 2002; Zenon et al. 2008). Neurophysiological studies show that spatial attention modulates object-selective responses of neurons in inferior temporal cortex during visual search (Chelazzi et al. 1998). Sheinberg and Logothetis (2001) showed that during active scanning of complex visual scenes with saccadic eye movements, object selective neurons in inferior temporal (IT) cortex become active specifically before the saccades used to fixate the target object of the search. These object-selective responses in IT cortex that occur specifically before saccades that bring the object to the fovea are likely related to the shift of spatial attention that precedes saccades (Deubel and Schneider 1996; Hoffman and Subramaniam 1995; Kowler et al. 1995).
Hamker (2005) proposed a model in which spatially selective signals from FEF play an important role in object recognition. In a previous study (Thompson et al. 2005b) and in this study we show that visually responsive FEF neurons exhibit spatially selective responses in the absence of eye movements and thus are a potential source of covert spatial attention that enhances visual processing. In a series of experiments, Moore and colleagues (Moore and Fallah 2001, 2004; Schafer and Moore 2007) have shown that weak electrical microstimulation of FEF, using currents below the threshold to evoke saccades, increases the monkeys' perceptual sensitivity at the location in visual space represented by the neurons at the stimulated site and modulates visual responses in extrastriate visual cortex in a manner similar to the effects of directed visual attention (Armstrong and Moore 2007; Armstrong et al. 2006; Moore and Armstrong 2003). Moore and Armstrong (2003) showed that FEF stimulation modulates activity in area V4 only when the neuron in the visual cortex is being driven by a stimulus in its receptive field and a recent fMRI study in monkeys showed that FEF stimulation modulates visually driven activity throughout the visual cortex (Ekstrom et al. 2008). These results are consistent with our observation that variability in FEF activity influences visual processing specifically during the period of time in which neurons in the visual cortex are processing the object to be identified. Together these results provide strong converging evidence that FEF exerts a top-down modulatory influence on ongoing visual processing by providing a spatial signal that selects and enhances the representation of behaviorally relevant objects. This conclusion is consistent with the hypothesis that it is a source of covert spatial attention needed for object perception (Hamker 2005).
A neuronal source of spatial attention should exhibit activity that is related to different degrees of attention as measured by the ability to process visual stimuli. Human psychophysical experiments have manipulated perceptual task difficulty to demonstrate that visual processing efficiency is directly related to the amount of attentional effort (Lavie and Tsal 1994; Urbach and Spitzer 1995). Single-unit recording studies have shown that representations of visual stimuli in the visual cortex of monkeys are stronger with increased task demands (Boudreau et al. 2006; Spitzer and Richmond 1991; Spitzer et al. 1988). Boudreau et al. (2006) specifically showed that neuronal modulations related to task difficulty in area V4 are correlated with the magnitude of spatial attention, as measured with changes in the ability of the monkeys to detect small changes in a visual stimulus. Additionally, the results of recent psychophysical experiments in humans performing covert visual search tasks suggest that spatial attentional selection is a necessary prerequisite for object identification (Evans and Treisman 2005; Zenon et al. 2008). Therefore the level of neural activity in an area that directs spatial attention should predict whether an object is identified. Our results show that FEF activity exhibits these properties. The magnitude of target-related activity in FEF is correlated with the efficiency of processing the target stimulus. For all three trial conditions—valid, invalid, and neutral cue trials—target-related activity in FEF was correlated with the accuracy of the behavioral report. The highest level of activity was associated with correct object identification. Activity below this level can support partial processing leading to target detection, but not identification. Moreover, when the spatially selective activity in FEF does not reach a minimum threshold level, the monkey does not detect the target. In a previous report we found similar evidence for a spatial selectivity threshold for target detection in a difficult visual search task that used saccades as the behavioral report (Thompson et al. 2005a).
Effect of FEF inactivation
To establish a causal link between FEF activity and visual attention in the cued covert search task we inactivated FEF with muscimol injected at the same sites from which neurons included in this study were recorded. The effectiveness of the inactivation at each location of the search array was quantified for each experimental session by measuring the change in the ability of the monkey to initiate memory-guided saccades (Dias and Segraves 1999; Sommer and Tehovnik 1997). We correlated the effectiveness of the inactivation at each stimulus location to the change in the speed and accuracy of target identification in the cued covert search task (Fig. 9).
Our results corroborate and add to those from a recent study by Wardak and colleagues (2006) that measured the effect of muscimol inactivation of FEF in monkeys performing various covert visual search tasks without spatial cues. They showed that FEF inactivation increased the reaction time of target detection by about 25 ms during visual search when the target object was in the contralesional visual hemifield, but had little effect on the accuracy of target detection; the monkeys performed at an accuracy rate >95% in the contralesional hemifield after muscimol injection. We found a similar spatially selective reaction time deficit in our task as that reported in the previous study. However, our results also show that FEF inactivation can also affect the monkey's ability to identify the target that was, in fact, much stronger and more consistent than the reaction time deficit. The stronger deficit in target identification accuracy in our study than in the previous study is likely explained by task differences that led to higher error rates. In our study, but not in the previous study, the monkey was rewarded for reporting the absence of the target, which raises the psychophysical threshold for target detection, thereby leading to more miss errors on target-present trials. Also, in our study the monkey was required to detect and report the identity of the target that produced misidentification errors. Only target detection was required in the previous study. The difference in error rates between our study and that of Wardak et al. (2006) is consistent with the results from the neural recordings that show that decreased levels of FEF activity are associated with target detection without identification.
A new and important result provided by our study is the difference in the spatially selective deficits in perceptual performance between valid cue and invalid cue trials. FEF inactivation produced a strong deficit in the monkey's ability to identify the target on valid cue trials—trials in which the spatial cue directed attention to the target location. The deficit was much stronger on invalid cue trials—trials in which the spatial cue directed attention away from the target.
From the results of the FEF inactivation experiment we, like Wardak et al. (2006), conclude that FEF plays an important causal role in covert attentional processes. Our results also demonstrate a functional role of FEF, specifically in cognitively driven shifts of spatial attention (Buschman and Miller 2007; Zhou and Thompson 2009). Correct performance on invalid cue trials depends on the monkey voluntarily shifting attention away from the popout, exogenous spatial cue and toward objects in the opposite visual hemifield. The greater perceptual performance deficit on invalid cue trials than that on valid cue trials suggests that FEF plays a relatively more important role in the endogenous shift of attention to locations that do not contain an exogenous spatial cue. The smaller deficit on valid cue trials suggests that the popout spatial cue was somewhat effective in guiding attention even when FEF is inactivated. This function is likely taking place in other brain areas such as in the posterior parietal cortex and the superior colliculus, which have been shown to exhibit spatially selective activity for salient stimuli (Constantinidis and Steinmetz 2005; McPeek and Keller 2002; Thomas and Paré 2007) and to participate in spatial attention processes (Balan et al. 2008; Cavanaugh and Wurtz 2004; Muller et al. 2005; Wardak et al. 2004).
Relationship of FEF to other brain areas in the control of attention
Evidence from humans and monkeys indicates that the FEF, the lateral intraparietal area (LIP), and the superior colliculus (SC) participate in a spatial attention network (Bressler et al. 2008; Cavanaugh and Wurtz 2004; Corbetta et al. 2002; Muller et al. 2005; Serences and Yantis 2006, 2007; Wardak et al. 2004, 2006). In all three of these areas, neuronal activity shows little selectivity for stimulus features. Instead, activity in these areas exhibits characteristics of a “visual salience map” (Itti and Koch 2001) or “attentional priority map” (Serences and Yantis 2006), a topographic representation of the behavioral relevance of objects in the visual scene derived from the combination of stimulus features (bottom-up) and cognitive (top-down) influences (Goldberg et al. 2006; Shen and Paré 2007; Thompson and Bichot 2005; Thompson et al. 2005a). Theoretically, activity peaks on the salience map guide spatial attention and eye movements (Itti and Koch 2001; Treisman 1988). Understanding the respective contributions of FEF, LIP, and SC to spatial attention is of particular interest and can be investigated using a variety of experimental approaches (e.g., Kelley et al. 2008; Ruff et al. 2008). Here we will focus our discussion on studies of neuronal activity recorded in awake monkeys.
Spatially selective activity associated with saccade target selection during visual search has been observed in SC (McPeek and Keller 2002), LIP (Thomas and Paré 2007), and FEF (Thompson et al. 1996, 2005a). In the absence of eye movements, spatially selective activity for singleton targets of popout visual arrays, shown psychophysically to automatically capture attention (Egeth and Yantis 1997; Turatto and Galfano 2000), have been observed in FEF (Thompson et al. 1997, 2005b) and area 7a of the posterior parietal cortex (Constantinidis and Steinmetz 2005). A recent study recorded simultaneously in the FEF and LIP of monkeys performing visual search tasks and compared the time of saccade target selection across the two areas (Buschman and Miller 2007). The results indicate that FEF may be more involved cognitively driven selection and LIP in stimulus-driven selection, a conclusion that is supported by the muscimol inactivation results in the present study.
A few studies have related neuronal activity in FEF, LIP, and SC to improved perceptual performance associated with covert spatial attention. Ignashchenkova et al. (2004) reported enhanced visual responses in SC neurons when a spatial cue directed the monkey's attention to the future location of a single Landolt C target to be identified. Attention was measured as an improvement of acuity for the size of the C gap resulting from the spatial cue. The change in the magnitude of the visual response to the C stimulus in cued versus noncued trials was correlated with the change in visual acuity and thus with covert spatial attention. Using abrupt visual onsets as spatial cues and distractors, Bisley and Goldberg (2003) showed that the highest activity in the topographic map in LIP was correlated with the dynamic shifts in the locus of spatial attention during the trial, as measured by the monkeys' contrast sensitivity at the cue and distractor locations. Zhou and Thompson (2009) recently described cognitively directed anticipatory activity in FEF preceding visual stimuli to be discriminated that was not related to saccade choice or saccade latency. The anticipatory activity in FEF was linked indirectly to endogenous attention by showing an enhancement in perceptual performance at the expected stimulus locations in separate behavior-only sessions. In all of these studies, correlations of neuronal activity to behavioral measures of covert spatial attention were made across different trial conditions that were designed to manipulate the locus of spatial attention. This technique was used in the present study to relate the magnitude of spatial selectivity in FEF for the popout cue to the overall probability and speed of correct behavior (Fig. 3). However, correlations across trial conditions do not directly link the relationship between neural activity and the monkey's behavioral report on individual trials.
Recently, Gottlieb and colleagues have studied LIP activity in monkeys performing a task similar to the covert search task used in the present study (Balan and Gottlieb 2006; Balan et al. 2008; Oristaglio et al. 2006). In these studies, monkeys grasped a bar with the left hand and a bar with the right hand and manually reported the orientation of a target among distractors by releasing the appropriate bar. They showed that the activity of LIP neurons identify the target location before the behavioral report in a manner that is very similar to the spatially selective activity we observe in FEF. In addition, they observed slightly greater target-related activity in LIP on correct fast reaction time trials (Oristaglio et al. 2006) that is comparable to the greater magnitude of spatially selective activity we observed in FEF on correct fast reaction time trials (Fig. 8). Also, Balan et al. (2008) reported an absence of target-selective activity in LIP on error trials in which the monkeys released the wrong bar.
The principal new finding in the present study is that trial-to-trial variability in the magnitude of spatial selectivity in FEF is correlated with the speed and accuracy of target identification, specifically during the time that the target is being processed by the visual system. In addition, the different magnitudes of spatial selectivity in FEF across trials with different behavioral reports (Figs. 4E, 5E, and 6E) suggest that a higher threshold of spatial selectivity in FEF is necessary for target identification versus target detection. To our knowledge, similar relationships between the magnitude and timing of spatial selectivity to the efficacy of ongoing visual processing have not yet been demonstrated for LIP or SC. Nevertheless, FEF, LIP, and SC form an interconnected network of areas related to covert attention and overt gaze shifts. Therefore it is not surprising that they exhibit many similar properties. Future experiments may show that LIP and SC exhibit the same relationship to ongoing visual processing shown in the present study. Clearly, further studies are needed to understand the similarities and differences of the contribution of FEF, LIP, and SC to the control of spatial attention.
GRANTS
This work was supported by the Intramural Research Program of the National Eye Institute, National Institutes of Health.
ACKNOWLEDGMENTS
We thank V. Cao for help with data analysis and Drs. Jeffrey Schall, David Sheinberg, Robert Wurtz, and Ethan Bromberg-Martin for valuable comments.
REFERENCES
- Armstrong KM, Fitzgerald JK, Moore T. Changes in visual receptive fields with microstimulation of frontal cortex. Neuron 50: 791–798, 2006 [DOI] [PubMed] [Google Scholar]
- Armstrong KM, Moore T. Rapid enhancement of visual cortical response discriminability by microstimulation of the frontal eye field. Proc Natl Acad Sci USA 104: 9499–9504, 2007 [DOI] [PMC free article] [PubMed] [Google Scholar]
- Awh E, Armstrong KM, Moore T. Visual and oculomotor selection: links, causes and implications for spatial attention. Trends Cogn Sci 10: 124–130, 2006 [DOI] [PubMed] [Google Scholar]
- Balan PF, Gottlieb J. Integration of exogenous input into a dynamic salience map revealed by perturbing attention. J Neurosci 26: 9239–9249, 2006 [DOI] [PMC free article] [PubMed] [Google Scholar]
- Balan PF, Oristaglio J, Schneider DM, Gottlieb J. Neuronal correlates of the set-size effect in monkey lateral intraparietal area. PLoS Biol 6: e158, 2008 [DOI] [PMC free article] [PubMed] [Google Scholar]
- Beauchamp MS, Petit L, Ellmore TM, Ingeholm J, Haxby JV. A parametric fMRI study of overt and covert shifts of visuospatial attention. Neuroimage 14: 310–321, 2001 [DOI] [PubMed] [Google Scholar]
- Bisley JW, Goldberg ME. Neuronal activity in the lateral intraparietal area and spatial attention. Science 299: 81–86, 2003 [DOI] [PubMed] [Google Scholar]
- Boudreau CE, Williford TH, Maunsell JH. Effects of task difficulty and target likelihood in area V4 of macaque monkeys. J Neurophysiol 96: 2377–2387, 2006 [DOI] [PubMed] [Google Scholar]
- Bressler SL, Tang W, Sylvester CM, Shulman GL, Corbetta M. Top-down control of human visual cortex by frontal and parietal cortex in anticipatory visual spatial attention. J Neurosci 28: 10056–10061, 2008 [DOI] [PMC free article] [PubMed] [Google Scholar]
- Bruce CJ, Goldberg ME. Primate frontal eye fields. I. Single neurons discharging before saccades. J Neurophysiol 53: 603–635, 1985 [DOI] [PubMed] [Google Scholar]
- Buschman TJ, Miller EK. Top-down versus bottom-up control of attention in the prefrontal and posterior parietal cortices. Science 315: 1860–1862, 2007 [DOI] [PubMed] [Google Scholar]
- Cavanaugh J, Wurtz RH. Subcortical modulation of attention counters change blindness. J Neurosci 24: 11236–11243, 2004 [DOI] [PMC free article] [PubMed] [Google Scholar]
- Chelazzi L, Duncan J, Miller EK, Desimone R. Responses of neurons in inferior temporal cortex during memory-guided visual search. J Neurophysiol 80: 2918–2940, 1998 [DOI] [PubMed] [Google Scholar]
- Chun MM, Wolfe JM. Just say no: how are visual searches terminated when there is no target present? Cognit Psychol 30: 39–78, 1996 [DOI] [PubMed] [Google Scholar]
- Constantinidis C, Steinmetz MA. Posterior parietal cortex automatically encodes the location of salient stimuli. J Neurosci 25: 233–238, 2005 [DOI] [PMC free article] [PubMed] [Google Scholar]
- Corbetta M, Kincade JM, Shulman GL. Neural systems for visual orienting and their relationships to spatial working memory. J Cogn Neurosci 14: 508–523, 2002 [DOI] [PubMed] [Google Scholar]
- Corbetta M, Shulman GL. Control of goal-directed and stimulus-driven attention in the brain. Nat Rev Neurosci 3: 201–215, 2002 [DOI] [PubMed] [Google Scholar]
- Crist CF, Yamasaki DS, Komatsu H, Wurtz RH. A grid system and a microsyringe for single cell recording. J Neurosci Methods 26: 117–122, 1988 [DOI] [PubMed] [Google Scholar]
- Deubel H, Schneider WX. Saccade target selection and object recognition: evidence for a common attentional mechanism. Vision Res 36: 1827–1837, 1996 [DOI] [PubMed] [Google Scholar]
- Dias EC, Segraves MA. Muscimol-induced inactivation of monkey frontal eye field: effects on visually and memory-guided saccades. J Neurophysiol 81: 2191–2214, 1999 [DOI] [PubMed] [Google Scholar]
- Egeth HE, Yantis S. Visual attention: control, representation, and time course. Annu Rev Psychol 48: 269–297, 1997 [DOI] [PubMed] [Google Scholar]
- Ekstrom LB, Roelfsema PR, Arsenault JT, Bonmassar G, Vanduffel W. Bottom-up dependent gating of frontal signals in early visual cortex. Science 321: 414–417, 2008 [DOI] [PMC free article] [PubMed] [Google Scholar]
- Evans KK, Treisman A. Perception of objects in natural scenes: is it really attention free? J Exp Psychol Hum Percept Perform 31: 1476–1492, 2005 [DOI] [PubMed] [Google Scholar]
- Goldberg ME, Bisley JW, Powell KD, Gottlieb J. Saccades, salience and attention: the role of the lateral intraparietal area in visual behavior. Prog Brain Res 155: 157–175, 2006 [DOI] [PMC free article] [PubMed] [Google Scholar]
- Goldberg ME, Segraves MA. The visual and frontal cortices. In: The Neurobiology of Saccadic Eye Movements: Reviews of Oculomotor Research, edited by Wurtz RH, Goldberg ME. Amsterdam: Elsevier, 1989, vol. III, p. 283–313 [PubMed] [Google Scholar]
- Green DM, Swets JA. Signal Detection Theory and Psychophysics New York: Wiley, 1966 [Google Scholar]
- Grosbras MH, Paus T. Transcranial magnetic stimulation of the human frontal eye field: effects on visual perception and attention. J Cogn Neurosci 14: 1109–1120, 2002 [DOI] [PubMed] [Google Scholar]
- Hamker FH. The reentry hypothesis: the putative interaction of the frontal eye field, ventrolateral prefrontal cortex, and areas V4, IT for attention and eye movement. Cereb Cortex 15: 431–447, 2005 [DOI] [PubMed] [Google Scholar]
- Hanes DP, Patterson WF, Schall JD. Role of frontal eye fields in countermanding saccades: visual, movement, and fixation activity. J Neurophysiol 79: 817–834, 1998 [DOI] [PubMed] [Google Scholar]
- Hays AV, Richmond BJ, Optican LM. A UNIX-based multiple process system for real-time data acquisition and control. WESCON Conf Proc 2: 1–10, 1982 [Google Scholar]
- Hoffman JE, Subramaniam B. The role of visual attention in saccadic eye movements. Percept Psychophys 57: 787–795, 1995 [DOI] [PubMed] [Google Scholar]
- Ignashchenkova A, Dicke PW, Haarmeier T, Thier P. Neuron-specific contribution of the superior colliculus to overt and covert shifts of attention. Nat Neurosci 7: 56–64, 2004 [DOI] [PubMed] [Google Scholar]
- Itti L, Koch C. Computational modelling of visual attention. Nat Rev Neurosci 2: 194–203, 2001 [DOI] [PubMed] [Google Scholar]
- Juan CH, Shorter-Jacobi SM, Schall JD. Dissociation of spatial attention and saccade preparation. Proc Natl Acad Sci USA 101: 15541–15544, 2004 [DOI] [PMC free article] [PubMed] [Google Scholar]
- Kelley TA, Serences JT, Giesbrecht B, Yantis S. Cortical mechanisms for shifting and holding visuospatial attention. Cereb Cortex 18: 114–125, 2008 [DOI] [PMC free article] [PubMed] [Google Scholar]
- Kincade JM, Abrams RA, Astafiev SV, Shulman GL, Corbetta M. An event-related functional magnetic resonance imaging study of voluntary and stimulus-driven orienting of attention. J Neurosci 25: 4593–4604, 2005 [DOI] [PMC free article] [PubMed] [Google Scholar]
- Kowler E, Anderson E, Dosher B, Blaser E. The role of attention in the programming of saccades. Vision Res 35: 1897–1916, 1995 [DOI] [PubMed] [Google Scholar]
- Lavie N, Tsal Y. Perceptual load as a major determinant of the locus of selection in visual attention. Percept Psychophys 56: 183–197, 1994 [DOI] [PubMed] [Google Scholar]
- Logothetis NK, Sheinberg DL. Visual object recognition. Annu Rev Neurosci 19: 577–621, 1996 [DOI] [PubMed] [Google Scholar]
- Maunsell JH, Cook EP. The role of attention in visual processing. Philos Trans R Soc Lond B Biol Sci 357: 1063–1072, 2002 [DOI] [PMC free article] [PubMed] [Google Scholar]
- McPeek RM, Keller EL. Saccade target selection in the superior colliculus during a visual search task. J Neurophysiol 88: 2019–2034, 2002 [DOI] [PubMed] [Google Scholar]
- Moore T, Armstrong KM. Selective gating of visual signals by microstimulation of frontal cortex. Nature 421: 370–373, 2003 [DOI] [PubMed] [Google Scholar]
- Moore T, Fallah M. Control of eye movements and spatial attention. Proc Natl Acad Sci USA 98: 1273–1276, 2001 [DOI] [PMC free article] [PubMed] [Google Scholar]
- Moore T, Fallah M. Microstimulation of the frontal eye field and its effects on covert spatial attention. J Neurophysiol 91: 152–162, 2004 [DOI] [PubMed] [Google Scholar]
- Morishima Y, Akaishi R, Yamada Y, Okuda J, Toma K, Sakai K. Task-specific signal transmission from prefrontal cortex in visual selective attention. Nat Neurosci 12: 85–91, 2009 [DOI] [PubMed] [Google Scholar]
- Muggleton NG, Juan CH, Cowey A, Walsh V. Human frontal eye fields and visual search. J Neurophysiol 89: 3340–3343, 2003 [DOI] [PubMed] [Google Scholar]
- Muller JR, Philiastides MG, Newsome WT. Inaugural article: microstimulation of the superior colliculus focuses attention without moving the eyes. Proc Natl Acad Sci USA 102: 524–529, 2005 [DOI] [PMC free article] [PubMed] [Google Scholar]
- Murthy A, Thompson KG, Schall JD. Dynamic dissociation of visual selection from saccade programming in frontal eye field. J Neurophysiol 86: 2634–2637, 2001 [DOI] [PubMed] [Google Scholar]
- Oristaglio J, Schneider DM, Balan PF, Gottlieb J. Integration of visuospatial and effector information during symbolically cued limb movements in monkey lateral intraparietal area. J Neurosci 26: 8310–8319, 2006 [DOI] [PMC free article] [PubMed] [Google Scholar]
- Pashler HE. The Psychology of Attention Cambridge, MA: MIT Press, 1998 [Google Scholar]
- Peng X, Sereno ME, Silva AK, Lehky SR, Sereno AB. Shape selectivity in primate frontal eye field. J Neurophysiol 100: 796–814, 2008 [DOI] [PMC free article] [PubMed] [Google Scholar]
- Posner MI. Orienting of attention. Q J Exp Psychol 32: 3–25, 1980 [DOI] [PubMed] [Google Scholar]
- Pouget P, Stepniewska I, Crowder EA, Leslie MW, Emeric EE, Nelson MJ, Schall JD. Visual and motor connectivity and the distribution of calcium-binding proteins in macaque frontal eye field: implications for saccade target selection. Front Neuroanat 3: 2, 2009 [DOI] [PMC free article] [PubMed] [Google Scholar]
- Rensink RA. Change detection. Annu Rev Psychol 53: 245–277, 2002 [DOI] [PubMed] [Google Scholar]
- Ruff CC, Bestmann S, Blankenburg F, Bjoertomt O, Josephs O, Weiskopf N, Deichmann R, Driver J. Distinct causal influences of parietal versus frontal areas on human visual cortex: evidence from concurrent TMS-fMRI. Cereb Cortex 18: 817–827, 2008 [DOI] [PMC free article] [PubMed] [Google Scholar]
- Sato TR, Schall JD. Effects of stimulus-response compatibility on neural selection in frontal eye field. Neuron 38: 637–648, 2003 [DOI] [PubMed] [Google Scholar]
- Schafer RJ, Moore T. Attention governs action in the primate frontal eye field. Neuron 56: 541–551, 2007 [DOI] [PMC free article] [PubMed] [Google Scholar]
- Schall JD, Thompson KG. Neural selection and control of visually guided eye movements. Ann Rev Neurosci 22: 241–259, 1999 [DOI] [PubMed] [Google Scholar]
- Serences JT, Yantis S. Selective visual attention and perceptual coherence. Trends Cogn Sci 10: 38–45, 2006 [DOI] [PubMed] [Google Scholar]
- Serences JT, Yantis S. Spatially selective representations of voluntary and stimulus-driven attentional priority in human occipital, parietal, and frontal cortex. Cereb Cortex 17: 284–293, 2007 [DOI] [PubMed] [Google Scholar]
- Sheinberg DL, Logothetis NK. Noticing familiar objects in real world scenes: the role of temporal cortical neurons in natural vision. J Neurosci 21: 1340–1350, 2001 [DOI] [PMC free article] [PubMed] [Google Scholar]
- Shen K, Paré M. Neuronal activity in superior colliculus signals both stimulus identity and saccade goals during visual conjunction search. J Vis 7: 11–13, 2007 [DOI] [PubMed] [Google Scholar]
- Silvanto J, Lavie N, Walsh V. Stimulation of the human frontal eye fields modulates sensitivity of extrastriate visual cortex. J Neurophysiol 96: 941–945, 2006 [DOI] [PubMed] [Google Scholar]
- Smith DT, Jackson SR, Rorden C. Transcranial magnetic stimulation of the left human frontal eye fields eliminates the cost of invalid endogenous cues. Neuropsychologia 43: 1288–1296, 2005 [DOI] [PubMed] [Google Scholar]
- Sommer MA, Tehovnik EJ. Reversible inactivation of macaque frontal eye field. Exp Brain Res 116: 229–249, 1997 [DOI] [PubMed] [Google Scholar]
- Spitzer H, Desimone R, Moran J. Increased attention enhances both behavioral and neuronal performance. Science 240: 338–340, 1988 [DOI] [PubMed] [Google Scholar]
- Spitzer H, Richmond BJ. Task difficulty: ignoring, attending to, and discriminating a visual stimulus yield progressively more activity in inferior temporal neurons. Exp Brain Res 83: 340–348, 1991 [DOI] [PubMed] [Google Scholar]
- Tanaka K. Mechanisms of visual object recognition: monkey and human studies. Curr Opin Neurobiol 7: 523–529, 1997 [DOI] [PubMed] [Google Scholar]
- Taylor PC, Nobre AC, Rushworth MF. FEF TMS affects visual cortical activity. Cereb Cortex 17: 391–399, 2007 [DOI] [PubMed] [Google Scholar]
- Tehovnik EJ, Sommer MA, Chou IH, Slocum WM, Schiller PH. Eye fields in the frontal lobes of primates. Brain Res Brain Res Rev 32: 413–448, 2000 [DOI] [PubMed] [Google Scholar]
- Thomas NW, Paré M. Temporal processing of saccade targets in parietal cortex area LIP during visual search. J Neurophysiol 97: 942–947, 2007 [DOI] [PubMed] [Google Scholar]
- Thompson KG, Bichot NP. A visual salience map in the primate frontal eye field. Prog Brain Res 147: 251–262, 2005 [DOI] [PubMed] [Google Scholar]
- Thompson KG, Bichot NP, Sato TR. Frontal eye field activity before visual search errors reveals the integration of bottom-up and top-down salience. J Neurophysiol 93: 337–351, 2005a [DOI] [PMC free article] [PubMed] [Google Scholar]
- Thompson KG, Bichot NP, Schall JD. Dissociation of visual discrimination from saccade programming in macaque frontal eye field. J Neurophysiol 77: 1046–1050, 1997 [DOI] [PubMed] [Google Scholar]
- Thompson KG, Biscoe KL, Sato TR. Neuronal basis of covert spatial attention in the frontal eye field. J Neurosci 25: 9479–9487, 2005b [DOI] [PMC free article] [PubMed] [Google Scholar]
- Thompson KG, Hanes DP, Bichot NP, Schall JD. Perceptual and motor processing stages identified in the activity of macaque frontal eye field neurons during visual search. J Neurophysiol 76: 4040–4055, 1996 [DOI] [PubMed] [Google Scholar]
- Trageser JC, Monosov IE, Zhou Y, Thompson KG. A perceptual representation in the frontal eye field during covert visual search that is more reliable than the behavioral report. Eur J Neurosci 28: 2542–2549, 2008 [DOI] [PMC free article] [PubMed] [Google Scholar]
- Treisman A. Features and objects: the fourteenth Bartlett memorial lecture. Q J Exp Psychol A Hum Exp Psychol 40: 201–237, 1988 [DOI] [PubMed] [Google Scholar]
- Turatto M, Galfano G. Color, form and luminance capture attention in visual search. Vision Res 40: 1639–1643, 2000 [DOI] [PubMed] [Google Scholar]
- Urbach D, Spitzer H. Attentional effort modulated by task difficulty. Vision Res 35: 2169–2177, 1995 [DOI] [PubMed] [Google Scholar]
- Wardak C, Ibos G, Duhamel JR, Olivier E. Contribution of the monkey frontal eye field to covert visual attention. J Neurosci 26: 4228–4235, 2006 [DOI] [PMC free article] [PubMed] [Google Scholar]
- Wardak C, Olivier E, Duhamel JR. A deficit in covert attention after parietal cortex inactivation in the monkey. Neuron 42: 501–508, 2004 [DOI] [PubMed] [Google Scholar]
- Zenon A, Ben Hamed S, Duhamel JR, Olivier E. Spatial and temporal dynamics of attentional guidance during inefficient visual search. PLoS ONE 3: e2219, 2008 [DOI] [PMC free article] [PubMed] [Google Scholar]
- Zhou HH, Thompson KG. Cognitively directed spatial selection in the frontal eye field in anticipation of visual stimuli to be discriminated. Vision Res 49: 1205–1215, 2009 [DOI] [PMC free article] [PubMed] [Google Scholar]