

Abstract
The relationship between cerebral morphology and the expression of dopamine receptors has not been extensively studied in humans. Elucidation of such relationships may have important methodological implications for clinical studies of dopamine receptor ligand binding differences between control and patient groups. The association between cerebral morphology and dopamine receptor distribution was examined in 45 healthy subjects who completed T1-weighted structural MRI and PET scanning with the D2/D3 ligand [18F]fallypride. Optimized voxel-based morphometry was used to create grey matter volume and density images. Grey matter volume and density images were correlated with binding potential (BPND) images on a voxel-by-voxel basis using the Biological Parametric Mapping toolbox. Associations between cerebral morphology and BPND were also examined for selected regions-of-interest (ROIs) after spatial normalization. Voxel-wise analyses indicated that grey matter volume and density positively correlated with BPND throughout the midbrain, including the substantia nigra. Positive correlations were observed in medial cortical areas, including anterior cingulate and medial prefrontal cortex, and circumscribed regions of the temporal, frontal, and parietal lobes. ROI analyses revealed significant positive correlations between BPND and cerebral morphology in the caudate, thalamus, and amygdala. Few negative correlations between morphology and BPND were observed. Overall, grey matter density appeared more strongly correlated with BPND than grey matter volume. Cerebral morphology, particularly grey matter density, correlates with [18F]fallypride BPND in a regionally specific manner. Clinical studies comparing dopamine receptor availability between clinical and control groups may benefit by accounting for potential differences in cerebral morphology that exist even after spatial normalization.
Keywords: Positron Emission Tomography, Fallypride, Dopamine D2/D3 Receptors, Voxel-based Morphometry
Introduction
Over the past two decades positron emission tomography (PET) imaging of dopamine (DA) receptor levels and structural magnetic resonance imaging (MRI) have dramatically expanded our understanding of psychopathology and other behavioral phenotypes. In the clinical realm for example, PET imaging with DA receptor radioligands and MRI have been instrumental in identifying localized changes in DA receptor expression and brain morphology in schizophrenia and substance abuse disorders (Volkow et al., 2008; Zipursky et al., 2007). Parallel investigations of healthy individuals have provided evidence of associations between DA receptor levels or brain structure and behavioral traits. For example, significant associations between regional DA receptor concentrations and personality traits, and hippocampal volume and spatial memory abilities have been identified (Breier et al., 1998; Kestler et al., 2000; Maguire et al., 2000).
To date, the relationship between brain morphology and DA receptor levels has not been systematically investigated in humans. This is surprising given evidence that DA neurotransmission may influence cerebral morphology during development and adulthood. Disruption or depletion of normal neonatal DA function results in reduced pyramidal cell dendrite length, especially in cortical areas that receive significant DA projections such as the anterior cingulate and prefrontal cortex (PFC) (Jones et al., 1996; Kalsbeek et al., 1989; Wang and Deutch, 2008). Conversely, activation of DA D2 receptors induces neurite elongation (preferentially axonal) in cortical regions (Reinoso et al., 1996). Evidence that neonatal DA depletion affects the macrostructure of the cortex is mixed with reports of both decreases and no change in cortical thickness; although morphological changes at this level may be subtle and/or restricted to specific cortical layers (Alvarez et al., 2002; Kalsbeek et al., 1987; Kalsbeek et al., 1989; Pappas et al., 1992). Evidence of an association between the DA receptor D4 (DRD4) 7-repeat allele and cortical thickness in normal children and those with attention-deficit/hyperactivity disorder (ADHD) indirectly supports an association between DA receptors and cortical development in humans (Shaw et al., 2007). In adulthood, chronic treatment with DA antagonists, D2 receptor antagonists in particular, reliably increases the volume of basal ganglia structures, especially the caudate, in both rodents and humans and may also increase the thickness of cortical layer V in non-human primates (Chakos et al., 1994; Lieberman et al., 2005; Selemon et al., 1999). The volume increase in the caudate associated with D2 antagonism is often attributed to a cascade of effects resulting from post-synaptic antagonism including antipsychotic induced disinhibition of striatal neurons, concomitant hypertrophy, and compensatory up-regulation of D2 receptors (Benes et al., 1985; Chakos et al., 1994; Joyce, 2001). Interestingly, D2 antagonism is associated with increased expression of D2 mRNA in the PFC and temporal cortex, and glial cell proliferation (Selemon et al., 1999). Taken together, these findings suggest that there may be a link between cerebral structure and the expression of DA D2 receptors, although the mechanisms underlying the association are not fully understood.
Elucidation of the relationship between cerebral morphology and the expression of DA D2 receptors may have important methodological implications for PET studies. Structural brain information acquired in PET imaging studies is rarely integrated into data analysis, beyond being used for the purposes of spatial normalization or region-of-interest (ROI) definition. Moreover, even when structural data is incorporated into PET imaging analyses it is usually treated as a nuisance variable (Ito et al., 2008). Spatial normalization and ROI analyses can control for partial volume effects; however, neither method may adequately account for individual differences in brain structure. ROIs can be used to correct for individual differences in neuroanatomy, provided volume estimates derived from the ROIs are included as covariates in statistical analyses of binding potential (BPND) data, although this is rarely done. It is generally assumed that spatial normalization corrects for overall variability in brain shape that exists across subjects by warping brains to a common stereotactic space. However, spatial normalization does not account for subtle differences in cerebral morphology that remain after spatial normalization. Residual variability in brain structure following spatial normalization is potentially very informative. Indeed, examination of the residual differences in morphology that exist after spatial normalization is central to voxel-based morphometry (VBM) and related morphometric techniques (Ashburner and Friston, 2000; Thompson et al., 2004). Such information is rarely incorporated into PET imaging studies (e.g. Ito et al., 2008). Thus, the extent to which residual differences in cerebral morphology relates to BPND is unknown.
Failure to appropriately control for brain structure is especially problematic in clinical PET studies if the regions demonstrating changes in receptor expression and grey matter volume overlap. This is perhaps best exemplified by studies of schizophrenia patients. Schizophrenia is characterized by localized grey matter changes in multiple neocortical and sub-cortical regions, including the medial PFC, structures of the temporal lobe, and basal ganglia; areas that express DA receptors at levels high enough to be detected in vivo using available radioligands (Honea et al., 2005; Mukherjee et al., 2005; Shenton et al., 2001). Reduced grey matter volume and DA receptor density in the thalamus has been reported by a number of investigators (Buchsbaum et al., 2006; Kemether et al., 2003). Indeed, in separate studies, Buchsbaum and colleagues reported reduced D2/D3 receptor concentration and grey matter volume loss in the dorsomedial and pulvinar sub-nuclei of the thalamus in a sample of 15 neuroleptic naïve patients (Buchsbaum et al., 2006; Kemether et al., 2003). However, the relationship between receptor levels and brain volume was not examined. Consequently, it remains unclear if reduced receptor expression in the thalamus is a primary pathophysiological feature of the disorder or is perhaps secondary to grey matter volume loss.
To better understand the relationship between DA receptor distribution and cerebral morphology, we examined the relationships between brain morphology and DA D2-like receptor binding in humans. We performed structural MRI and PET imaging of the high affinity D2-like ligand [18F]fallypride in 45 healthy adults. The relationships between D2-like BPND and structural features were examined using voxel-based morphometry with BPND treated as a covariate of interest on a voxel-by-voxel basis using the Biological Parametric Mapping (BPM) toolbox developed by Casanova and colleagues (Casanova et al., 2007). This approach was supplemented with an examination of BPND and volume/density for several subcortical regions of interest (ROIs) expressing relatively high levels of D2-like receptors.
Material and methods
Participants
45 subjects, 24 men and 21 women, mean age=24.4 (SD=5.8), with no history of psychiatric illness were recruited to participate through advertisements and word-of-mouth. All subjects were right-hand dominant and non-smokers. Exclusion criteria included history of neurological or psychiatric disorder, severe past or concomitant medical illness, borderline elevated blood pressure, any psychotropic medication usage over the preceding 6 months, history of substance abuse or dependence, inability to provide written informed consent, and pregnancy or lactation. All subjects received a physical and neurological examination, blood chemistries, urine analysis and drug screen, EKG, and underwent the Structured Clinical Interview for Diagnosing DSM-IV Disorders (SCID: First et al., 1996), to rule out Axis I psychopathology. This study was approved by the Vanderbilt University Institutional Review Board. Informed consent was obtained in writing from each subject following a thorough description of the experimental procedure, including benefits and potential risks.
PET scan acquisition and structural imaging
Subjects underwent a PET study which was performed on a GE Discovery LS PET scanner. 3-D emission acquisitions and transmission attenuation correction scans were performed following a 5.0mCi slow bolus injection of [18F] fallypride (specific activity greater than 3000Ci/mmol). Serial scans started simultaneously with the bolus injection of [18F]fallypride and were obtained for approximately 3.5h. The initial scan sequence coincided with the start of the [18F]fallypride injection and included the following frames: 8 for 15s, 6 for 30 s, 5 for 1 min, 2 for 2.5 min, 3 for 5 min, and 3 for 10 min. After the initial scan sequence, a 10-min transmission scan was obtained and the subject given a break. At approximately 85–90min post-injection, a second scan sequence of two frames of 25min each followed by a second transmission scan was obtained. The subject was then allowed a second scan break, and at approximately 165–170min, a 40-min emission scan followed by a third transmission scan was obtained. Parametric images of DA D2/D3 receptor BPND were calculated on a voxel-by-voxel basis using the full reference region method (Lammertsma et al., 1996), with the cerebellum serving as the reference region.
A high-resolution, T1-weighted sagittal SPGR sequence (TE=3.6 ms, TR=18.9 ms, TI=400 ms, in-plane resolution=0.5 × 0.5 mm (n=31) or 1.0 × 1.0 mm (n=14); slice thickness of 1.0–1.4 mm) was obtained on each subject. All structural scans were acquired on the same GE Signa LXi echospeed 1.5 T MRI scanner located at Vanderbilt University Medical Center. Scanning protocol, one of three, was entered as a nuisance covariate in the subsequent statistical analyses.
Consistent with our prior studies, each subject’s serial PET scans were coregistered to reduce potential modeling errors due to head motion using a mutual information based rigid body algorithm (Riccardi et al., 2006). Each participants BPND image was aligned with their target T1-weighted MRI based on the coregistration of the weighted average of the PET dynamic scans to the MRI using a mutual information rigid body algorithm (Maes et al., 1997; Pluim et al., 2000). All subsequent image processing and statistical analysis were performed using the SPM2 package (http://www.fil.ion.ucl.ac.uk/spm). Following coregistration, the structural MRIs were spatially normalized to the MNI152 T1 template brain and the warping parameters derived from normalization were then applied to the coregistered PET image to bring it into stereotactic space. Cerebral grey matter volume and density images were obtained from the original T1-weighted SPGRs using the ‘optimized’ VBM procedure (Good et al., 2001). Briefly, the images were first centered on the anterior commissure and normalized to the MNI template using a 12-parameter affine registration algorithm. Next, grey matter, white matter, and cerebrospinal fluid (CSF) templates were created by segmenting and spatially normalizing the original images then averaging each tissue class across subjects. Each template image (T1, grey matter, white matter, CSF) was then smoothed with an 8 mm FWHM Gaussian kernel. Following the creation of the template images, the original images underwent iterative segmentation and normalizations steps, first in native space, then in stereotactic space, using the customized, study-specific templates as tissue priors to optimize segmentation. After the final segmentation and normalization steps, the segmented images were multiplied (i.e. modulated) by the voxel-wise Jacobian determinants obtained during spatial normalization, thereby preserving the original volume of the images. Thus, two sets of grey matter images, modulated (i.e. volume) and unmodulated (i.e. density), were created. Finally, the modulated and unmodulated grey matter segmented images were smoothed with an 8 mm FWHM Gaussian kernel. The BPND images were not smoothed due to the inherent smoothness of these images which approximated 8 mm in the x, y, and z dimensions. All images (parametric BPND maps, grey matter density, and grey matter volume) were re-sampled to 2 × 2 × 2 mm voxels.
Statistical analysis
Prior to statistically analyzing the images, masks were created to exclude voxels with low values, either in BPND or grey matter volume/density. The resultant masks excluded voxels with BPND or grey matter volume/density below 0.15. Correlations between fallypride BPND and grey matter volume or density were examined on a voxel-by-voxel basis using the Biological Parametric Mapping (BPM) toolbox (Casanova et al., 2007). The BPM toolbox examines correlations between multi-modal images co-registered and aligned within the same space (i.e. MNI space). Statistical parametric maps displaying the voxel-wise partial correlation between fallypride BPND and grey matter volume or density were calculating after covarying for age, gender, structural scanning parameters, and, for the grey matter volume analysis, global grey matter volume. As recommended by the authors of the BPM toolbox, the resultant statistical parametric maps were calculated as non-homologous correlation maps and corrected for multiple comparisons at the cluster corrected alpha=.05 for a voxel-wise threshold of p<.001. Significant clusters were converted from MNI coordinates to Talairach coordinates using the ICBM_SPM2Tal transformation created by Lancaster and colleagues (Lancaster et al., 2007).
Neuroreceptor mapping studies often utilize ROI analyses instead, or in addition, to voxel-wise analyses. However, ROI analyses may also be impacted by differences in grey matter characteristics. Consequently, in addition to being relevant to voxel-wise analysis, significant associations between morphology and BPND at the ROI level may have implications for PET imaging studies employing an ROI approach. To determine if morphology-BPND associations might impact ROI analyses, BPND, grey matter volume, and grey matter density were extracted from the left and right caudate, putamen, thalamus, amygdala, and hippocampus, and correlations between the morphological measures and BPND were performed for each ROI. These subcortical ROIs were selected because they represent the greatest targets of midbrain DA projections, have significant D2/D3 receptor levels, and are frequently the focus of neuroreceptor mapping studies examining group differences in DA D2/D3 levels (Mukherjee et al., 2002; Riccardi et al., 2005). Mean BPND, grey matter density, and volume were extracted from the ROIs using the ExtractVals toolbox (http://www.fil.ion.ucl.ac.uk/spm/ext/#ExtractVals). The caudate, putamen, and thalamus ROIs were derived from the International Consortium for Brain Mapping (ICBM) probabilistic atlas (Shattuck et al., 2008). The hippocampus and amygdala ROIs were created using the Wake Forrest University Pick Atlas (Maldjian et al., 2003) and smoothed with an 8 mm kernel to account for anatomical variation in subjects that exists even after normalization. Correlations between grey matter volume and BPND were calculated as partial correlations after correcting for global grey matter volume.
Results
Voxelwise analysis
Grey matter volume correlations with binding potential
Areas of the brain where grey matter volume and BPND were correlated at the corrected alpha level are presented in Table 1 and Figure 1. Volume and BPND were correlated in a large region of the brainstem that extended from the superior aspect of the pons to the ventro-medial thalamus. This cluster included prominent peaks of correlation within the red nucleus, substantia nigra (SN), and thalamus that tended to be more widespread on the right side. Smaller clusters of positive correlations between volume and BPND were observed in regions of the prefrontal cortex corresponding to Brodmann’s areas (BA) 6, 9, and 47, parietal lobe, including inferior parietal lobule (BA 40) and precuneus (BA 7), and temporal lobe. An inverse correlation between volume and BPND was observed in the right parahippocampal gyrus corresponding to BA 34 and 36. Correlations, in absolute values, ranged from .51 to .73. Thus, grey matter volume accounted for approximately 26–53% of the variance in BPND within the significant clusters identified.
Table 1.
Correlations Between [18F]Fallypride BPND and Grey Matter Volume
| Talairach Coordinates | |||||||
|---|---|---|---|---|---|---|---|
| Brain Region | X | Y | Z | Correlation Coefficient | Corrected p-value | Voxels* | |
| Positive Correlation | Right Midbrain: Red Nucleus | 6 | −23 | −7 | 0.73 | <.001 | 693 |
| Right Midbrain: Substania Nigra | 10 | −12 | −11 | 0.72 | |||
| Right Thalamus | 1 | −12 | −2 | 0.69 | |||
| Left Middle Frontal Gyrus (BA 6) | −33 | 13 | 43 | 0.64 | .003 | 72 | |
| Left Middle Frontal Gyrus (BA 6) | −35 | 7 | 48 | 0.57 | |||
| Left Parahippocampal Gyrus (BA 36) | −38 | −29 | −23 | 0.60 | .008 | 62 | |
| Left Inferior Temporal Gyrus (BA 20) | −40 | −25 | −29 | 0.59 | |||
| Left Inferior Frontal Gyrus (BA 9) | −33 | 8 | 24 | 0.59 | .009 | 61 | |
| Left Middle Frontal Gyrus (BA 9) | −35 | 17 | 25 | 0.52 | |||
| Left Precuneus (BA 31) | −24 | −71 | 24 | 0.58 | .039 | 46 | |
| Left Inferior Parietal Lobule (BA 40) | −35 | −43 | 43 | 0.58 | .043 | 45 | |
| Left Precuneus (BA 7) | −28 | −47 | 48 | 0.51 | |||
| Right Parahippocampal Gyrus (BA 36) | 38 | −28 | −21 | 0.57 | .032 | 48 | |
| Right Parahippocampal Gyrus (BA 36) | 29 | −26 | −16 | 0.54 | |||
| Negative Correlation | Right Uncus (BA 34) | 14 | −3 | −19 | 0.71 | <.001 | 143 |
| Right Uncus (BA 36) | 20 | −4 | −28 | 0.59 | |||
Table shows up to 3 local maxima within a cluster more than 8.0mm apart
Voxel size = 2 × 2 × 2 mm
Abbreviations: BA=Brodmann’s Area
Figure 1.
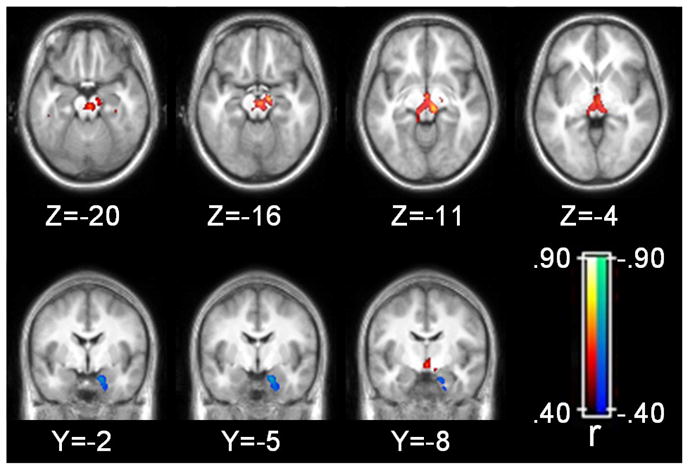
Grey matter volume correlations with binding potential. Statistical parametric map corrected at whole-brain cluster-wise p<.05. Axial images displayed in neurological format (i.e. left side of brain on left side of image).
Grey matter density correlations with binding potential
Areas of the brain where grey matter density and BPND were correlated after correcting for multiple comparisons are presented in Table 2 and Figure 2. The correlations between grey matter density and BPND appeared stronger and more widespread than the correlations between grey matter volume and BPND. Similar to the volumetric analysis, grey matter density and BPND were correlated in a large region of the midbrain that encompassed the red nucleus and SN, and extended up to the ventro-medial thalamus. As with the volumetric analysis, the correlations tended to be more prominent on the right side of the midbrain. Extensive positive correlations between BPND and density were observed in midline brain structures including a large cluster in the cingulate that extended from pre-genual BA 32 to approximately BA 23 of the ventral posterior cingulate cortex. Correlations between density and BPND within the cingulate gyrus appeared more extensive in the left hemisphere. Additional positive correlations were observed in midline structures including medial frontal areas corresponding to BA 6 and BA 8, and BA 7 in the precuneus. Multiple clusters were observed throughout the cortex including prefrontal cortical regions, bilateral insula, superior temporal gyrus, and parietal lobe (see Figure 3). Circumscribed clusters of negative correlation were observed bilaterally in the parahippocampal gyrus and right inferior frontal cortex corresponding to BA 47. The magnitude of the correlations ranged from .48 to .77 indicating that grey matter density explained 23–60% of the variance in BPND within the clusters indentified in the whole brain analysis.
Table 2.
Correlations Between [18F]Fallypride BPND and Grey Matter Density
| Talairach Coordinates | |||||||
|---|---|---|---|---|---|---|---|
| Brain Region | X | Y | Z | Correlation Coefficient | Corrected p-value | Voxels* | |
| Positive Correlation | Right Brainstem: Mammillary Body | 1 | −8 | −6 | 0.77 | <.001 | 844 |
| Right Brainstem: Substania Nigra | 10 | −12 | −11 | 0.71 | |||
| Right Brainstem: Red Nucleus | 1 | −22 | −1 | 0.70 | |||
| Left Cingulate Gyrus (BA 24) | −5 | 3 | 28 | 0.72 | <.001 | 708 | |
| Left Anterior Cingulate (BA 24) | −5 | 26 | 14 | 0.68 | |||
| Left Anterior Cingulate (BA 24) | −1 | 30 | 7 | 0.67 | |||
| Right Caudate Tail | 19 | −26 | 20 | 0.67 | <.001 | 69 | |
| Right Thalamus | 23 | −27 | 11 | 0.60 | |||
| Right Caudate Tail | 19 | −35 | 12 | 0.51 | |||
| Right Middle Frontal Gyrus (BA 9) | 32 | 31 | 37 | 0.66 | .003 | 49 | |
| Right Middle Frontal Gyrus (BA 8) | 32 | 24 | 43 | 0.52 | |||
| Right Superior Frontal Gyrus (BA 9) | 15 | 38 | 35 | 0.66 | .001 | 61 | |
| Right Superior Frontal Gyrus (BA 9) | 19 | 46 | 32 | 0.48 | |||
| Left Medial Frontal Gyrus (BA 6) | 0 | 2 | 57 | 0.66 | <.001 | 96 | |
| Left Inferior Frontal Gyrus (BA 47) | −19 | 24 | −5 | 0.64 | .014 | 38 | |
| Left Superior Frontal Gyrus (BA 8) | −2 | 24 | 50 | 0.64 | <.001 | 147 | |
| Left Superior Frontal Gyrus (BA 8) | −1 | 32 | 45 | 0.64 | |||
| Right Postcentral Gyrus (BA 40) | 54 | −24 | 17 | 0.64 | <.001 | 75 | |
| Right Postcentral Gyrus (BA 2) | 54 | −21 | 27 | 0.51 | |||
| Left Superior Temporal Gyrus (BA 22) | −44 | −25 | −4 | 0.63 | <.001 | 65 | |
| Left Parahippocampal Gyrus (BA 36) | −43 | −21 | −13 | 0.48 | |||
| Right Cingulate Gyrus (BA 24) | 12 | 12 | 31 | 0.62 | .001 | 55 | |
| Right Anterior Cingulate (BA 32) | 10 | 25 | 21 | 0.60 | |||
| Left Insula (BA 13) | −38 | 13 | −6 | 0.61 | <.001 | 195 | |
| Left Insula (BA 13) | −42 | −9 | −1 | 0.58 | |||
| Left Insula (BA 13) | −40 | 5 | −7 | 0.57 | |||
| Left Precuneus (BA 7) | −31 | −45 | 45 | 0.61 | <.001 | 130 | |
| Left Superior Parietal Lobule (BA 7) | −28 | −55 | 51 | 0.56 | |||
| Left Precuneus (BA 7) | 0 | −46 | 49 | 0.61 | <.001 | 89 | |
| Right Precuneus (BA 7) | 4 | −55 | 53 | 0.51 | |||
| Left Precuneus (BA 31) | −24 | −71 | 24 | 0.60 | <.001 | 82 | |
| Left Middle Occipital Gyrus (BA 19) | −26 | −82 | 19 | 0.49 | |||
| Left Parahippocampal Gyrus (BA 37) | −14 | −17 | −16 | 0.60 | .009 | 41 | |
| Right Middle Frontal Gyrus (BA 46) | 34 | 23 | 21 | 0.60 | .007 | 43 | |
| Right Middle Frontal Gyrus (BA 46) | 30 | 13 | 24 | 0.51 | |||
| Right Insula (BA 13) | 40 | 1 | −9 | 0.59 | .001 | 57 | |
| Right Inferior Parietal Lobule (BA 40) | 45 | −36 | 47 | 0.58 | .043 | 31 | |
| Right Insula (BA 13) | 40 | −17 | 7 | 0.57 | <.001 | 68 | |
| Right Insula (BA 13) | 43 | −11 | 4 | 0.56 | |||
| Right Superior Temporal Gyrus (BA 22) | 53 | −7 | −3 | 0.54 | |||
| Right Inferior Parietal Lobule (BA 40) | 39 | −55 | 47 | 0.56 | .043 | 31 | |
| Right Superior Parietal Lobule (BA 7) | 30 | −55 | 50 | 0.51 | |||
| Left Fusiform Gyrus (BA 20) | −38 | −5 | −22 | 0.56 | .031 | 33 | |
| Left Superior Parietal Lobule (BA 7) | −32 | −49 | 62 | 0.55 | .017 | 37 | |
| Left Inferior Parietal Lobule (BA 40) | −41 | −50 | 57 | 0.51 | |||
| Negative Correlation | Right Uncus (BA 28) | 14 | −3 | −25 | 0.62 | .019 | 36 |
| Right Inferior Frontal Gyrus (BA 47) | 22 | 11 | −21 | 0.61 | .017 | 37 | |
| Left Hippocampus | −28 | −11 | −13 | 0.59 | .023 | 35 | |
Table shows up to 3 local maxima more than 8.0mm apart
Voxel size = 2 × 2 × 2 mm
Abbreviations: BA=Brodmann’s Area
Figure 2.
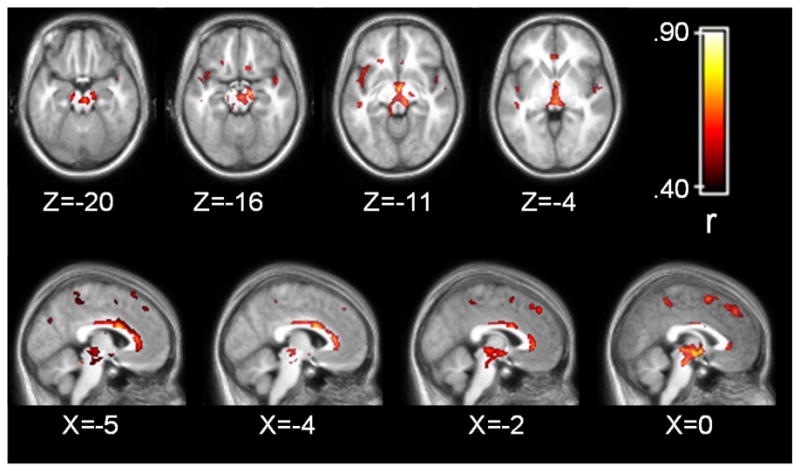
Grey matter density correlations with binding potential. Statistical parametric map corrected at whole-brain cluster-wise p<.05. Axial images displayed in neurological format (i.e. left side of brain on left side of image).
Figure 3.
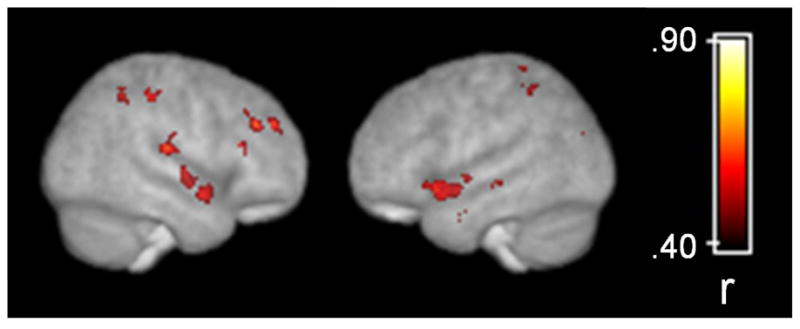
Grey matter density correlations with binding potential overlaid on a surface rendering of the customized template brain derived from 45 subjects. Statistical parametric map corrected at whole-brain cluster-wise p<.05.
Grey matter segmentation results in midbrain and basal ganglia
The validity of the results reported in the voxel-wise analyses rests upon the quality of the grey matter segmented images derived from VBM. As such, selected slices of the grey matter segmented images and corresponding normalized T1 images for three subjects at the level of the midbrain and basal ganglia are presented in Supplemental Figure 1.
Region-of-interest analysis
Results from the ROI analysis are presented in Table 3. Both volume and density correlated with BPND in several ROIs; however, similar to the voxel-wise analysis, density correlated more strongly with BPND than volume. Grey matter density and BPND were moderately correlated in bilateral caudate, thalamus, and amygdala (r ranged from .15 to .53). Volume and BPND were positively correlated in the bilateral caudate (r=.31-.41, p<.05). The amount of variance in BPND explained by grey matter volume and density ranged from 0% to 23% and 2% to 28%, respectively.
Table 3.
Correlations Between [18F]Fallypride BPND and Grey Matter Volume/Density for Selected Regions of Interest
| Caudate | Putamen | Region of Interest Thalamus | Amygdala | Hippocampus | ||||||
|---|---|---|---|---|---|---|---|---|---|---|
| Left | Right | Left | Right | Left | Right | Left | Right | Left | Right | |
| Volume† | .41** | .31* | −.07 | −.22 | −.24 | −.11 | .12 | −.09 | .01 | −.09 |
| Density | .53** | .52** | .15 | .15 | .31* | .40** | .33* | .33* | .17 | .26 |
Partial correlation after covarying for global grey matter volume
p<.05
p<.005
Discussion
The current results indicate that cerebral morphology, operationally defined as grey matter volume and density, correlates with the expression of D2-like receptors in a regionally specific manner in the human brain. Broadly, the association between morphology and BPND was strongest in areas of the midbrain, including the substantia nigra, midline cortical areas, including the anterior cingulate and medial PFC, insula, superior temporal gyrus, and circumscribed regions of the frontal and parietal lobes. Complementary ROI analyses revealed additional correlations in the caudate, thalamus, and amygdala. There are at least two possible explanations for the observed associations. The most straightforward interpretation is that grey matter positively correlates with D2 receptors simply because the denser or larger the volume of grey matter, the more D2 receptors it can support. In cortex this presumably relates to post-synaptic receptor expression, whereas in the midbrain it probably reflects presynaptic expression of somatodendritic autoreceptors. An alternative explanation is that the expression of DA D2-like receptors, and by extension DA function, alters cerebral structure during development and/or adulthood. As briefly reviewed earlier, disruption of DA function leads to changes at the neuronal (i.e. dendritic length) and macrostructural (i.e. cortical thickness) levels of cerebral morphology (Alvarez et al., 2002; Jones et al., 1996; Kalsbeek et al., 1987; Kalsbeek et al., 1989; Pappas et al., 1992; Reinoso et al., 1996; Wang and Deutch, 2008). The regional specificity of the associations and the presence of inverse correlations in some regions support the latter hypothesis. Examination of the associations between other in vivo markers of DA function, including pre and post synaptic radiotracers such as [18F]DOPA and [11C]NNC-112, and cerebral morphology would help to determine the specificity of the current findings and elucidate the mechanisms underlying the associations. Similarly, simultaneous application of VBM and PET imaging in non-human primates prior to and after manipulation of dopamine functioning would also facilitate interpretation of human studies. Animal studies examining the relationship between grey matter thickness and the relative concentration of dopamine receptors within a specific region would be most beneficial.
The implications of the current findings are largely methodological until the causal relationship between cerebral morphology and the expression of DA receptors is better understood in non-human primates and humans. The current findings strongly suggest that PET imaging studies of [18F]fallypride, and possibly other dopamine receptor ligands, may benefit by more fully integrating individual differences in cerebral morphology into data analyses. The current results are particularly pertinent to whole brain voxel-wise analyses. As mentioned in the introduction, it is common practice to warp BPND images to a standard template brain (i.e. Talairach or MNI space) prior to performing statistical analyses. The assumption underlying this method is that spatial normalization corrects for individual differences in cerebral morphology allowing for direct examination of voxel-wise BPND. The current results suggest that this method may be improved upon. Spatial normalization, as implemented in the SPM package, does not perfectly warp brains to a template. Rather, the goal is to correct for global shape differences across individuals (Ashburner and Friston, 2000). Residual differences in neuroanatomy after spatial normalization underlies VBM and comparison of these differences between groups has provided compelling evidence for structural brain changes, beyond those identified using traditional manual tracing techniques, in psychiatric and neurological disorders (Honea et al., 2005; Keller and Roberts, 2008). The current findings indicate that individual differences in cerebral morphology that remain after spatial normalization correlates with dopamine D2-like receptor BPND. The implications of the findings are further underscored by the fact that the correlations between cerebral morphology and BPND were most prominent in cortical regions demonstrating the highest [18F]fallypride BPND, including the anterior cingulate, medial PFC, and regions of the temporal cortex (Mukherjee et al., 2002). The results suggest that the statistical power of between groups or association studies may be improved by including grey matter density as a covariate in statistical analyses to remove unwanted variance in BPND related to individual differences in cerebral morphology. For a practical implication of the current results, consider the following example. In the current sample, females demonstrated significantly greater BPND than males in the caudate and hippocampus ROIs (all independent groups t-test p-values<.05). However, only the gender effect observed for the hippocampus ROI remained significant after covarying for grey matter density (main effect of gender p<.05 for left and right hippocampus for univariate ANCOVA). Consequently, the gender differences in BPND observed in the caudate appear to be driven by cerebral morphology differences between men and women, whereas the greater BPND observed in the hippocampus in women is independent of cerebral morphology.
There are few prior studies to compare the present results to and we are not aware of any other study examining correlations between cerebral morphology and [18F]fallypride BPND on a voxel-wise basis. Nonetheless, the current results are consistent with an earlier study that also did not find a correlation between hippocampal ROI volume and [18F]fallypride BPND in a small group of patients with medial temporal lobe epilepsy and healthy comparison subjects (Werhahn et al., 2006). The apparent specificity of the correlations between BPND and volume/density is noteworthy, particularly for sub-cortical structures that demonstrate the highest levels of [18F]fallypride BPND. ROI analyses revealed significant associations between grey matter volume/density and [18F]fallypride BPND in the caudate, but not putamen. It is possible that the absence of a significant relationship between receptor concentration and grey matter volume/density in the putamen is due to the relatively poorer grey/white matter contrast observed in the putamen relative to the caudate. Reduced grey/white contrast can adversely affect the sensitivity of automated segmentation algorithms used in VBM thereby reducing the chances of detecting a significant relationship in this region (Douaud et al., 2006). However, several observations suggest that the apparent lack of association between cerebral morphology and BPND in the putamen was not due to poor grey/white matter contrast in central brain structures. First, the potentially poorer grey/white contrast in central brain structures did not appear to hamper the ability to detect a significant relationship between grey matter density and BPND in the thalamus, a region notoriously difficult to segment on MRIs (Shenton et al., 2001). Second, the quality of the segmentation of the basal ganglia appeared reasonable upon visual inspection, at least for the caudate and putamen (see Supplemental Figure 1). The validity of the correlations identified in the midbrain, substantia nigra in particular, also rest upon the quality of the segmentation in this region. Numerous VBM studies have identified significant findings in the midbrain and inspection of the segmentation results for the present study confirmed that VBM is sensitive to grey/white matter differences in the region. However, replication using proton density scans, which provide better delineation of the substantia nigra than standard T1 weighted sequences, would increase confidence in the current findings.
The pattern of correlations with BPND was similar for both volume and density; however, the latter were greater in magnitude and more extensive for both the voxelwise and ROI analyses. It is unclear why the relationship between density and BPND appeared stronger than the associations between BPND and volume. Density and volume measures derived from VBM represent separate, but complementary aspects of cerebral morphology. Density is the relative amount of grey matter within a voxel after spatial normalization, whereas volume reflects the relative concentration after adjusting (i.e. modulating) voxel intensity values for the morphometric changes introduced during spatial normalization (Ashburner and Friston, 2000). It is possible that the closer association observed between density and BPND was due to the fact that neither image is modulated to incorporate information contained in the deformation fields derived from spatial normalization. In contrast, the voxel values in the volume images are modulated to retain information about the original morphometry of individual brains prior to spatial normalization. The relationships between BPND and volume might have been just as robust had the normalized BPND images also been modified to reflect information contained in the images prior to spatial normalization. In addition, a recent large scale VBM study comparing patients with schizophrenia to controls found that the standard error of measurement was larger for volume than density indicating that the latter has greater power to detect significant associations (Meda et al., 2008). It is also worth reiterating that global grey matter volume served as an additional covariate to the volume- BPND correlation analysis resulting in a slight diminution of statistical power compared to the grey matter density/BPND correlation analysis.
Positive associations between volume/density and BPND are not unexpected since it is reasonable to hypothesize that BPND in a region expressing DA receptors will vary positively with the size or relative density of grey matter within the region. Negative correlations on the other hand are unexpected. Consistent inverse associations between BPND and cerebral morphology were observed in circumscribed regions of the hippocampus and ventral hippocampal/parahippocampal region. The hippocampus and parahippocampal region receives dense DA projections from midbrain nuclei and dopaminergic drugs can modulate synaptic activity and plasticity in this region. Specifically, increasing DA activity in this area reduces neuronal firing and suppresses synaptic plasticity (Caruana et al., 2007; Caruana and Chapman, 2008). Longitudinal studies have established that VBM is sensitive to learning induced changes in synaptic plasticity suggesting that VBM is sensitive to the fine microstructure of the brain (Ilg et al., 2008). Speculatively, reduced dopamine activity in this region, as evinced by fewer DA receptors, may result in increased grey matter density. Alternatively, or perhaps in conjunction, the inverse association in this region might also relate to glial cell proliferation in response to reduced DA activity. Future research will be necessary to confirm this finding and clarify the causal direction and consequences of the association between DA functioning and hippocampal/parahippocampal structure.
Supplementary Material
Supplemental Figure 1. Grey matter segmentation results at the level of the midbrain and basal ganglia for three subjects (S1–S3). (A) Normalized brain at the level of the substantia nigra (inset). (B) Inset from A showing, clockwise from top left, normalized brain at level of midbrain; grey matter segmented at 1 mm isotropic voxel resolution; grey matter segmented resampled to 2 mm isotropic voxels; binding potential at 2 mm isotropic voxel resolution. (C) Representative slice from individual normalized brains, and grey matter segmented images at 1 mm and 2 mm isotropic voxel resolution demonstrating segmentation results of cortex, caudate, putamen, and thalamus.
Acknowledgments
This work was supported by NIDA (5RO1 DA019670) and NIH (5RO1 MH60898-03) grants awarded to author DHZ and RMK, respectively. We are grateful to Sharlet Anderson, Amy Bauernfeind, and Evan Schoenberg who assisted with subject recruitment and evaluations.
Footnotes
Publisher's Disclaimer: This is a PDF file of an unedited manuscript that has been accepted for publication. As a service to our customers we are providing this early version of the manuscript. The manuscript will undergo copyediting, typesetting, and review of the resulting proof before it is published in its final citable form. Please note that during the production process errors may be discovered which could affect the content, and all legal disclaimers that apply to the journal pertain.
References
- Alvarez C, Vitalis T, Fon EA, Hanoun N, Hamon M, Seif I, Edwards R, Gaspar P, Cases O. Effects of genetic depletion of monoamines on somatosensory cortical development. Neuroscience. 2002;115:753–764. doi: 10.1016/s0306-4522(02)00484-0. [DOI] [PubMed] [Google Scholar]
- Ashburner J, Friston KJ. Voxel-based morphometry--the methods. Neuroimage. 2000;11:805–821. doi: 10.1006/nimg.2000.0582. [DOI] [PubMed] [Google Scholar]
- Benes FM, Paskevich PA, Davidson J, Domesick VB. The effects of haloperidol on synaptic patterns in the rat striatum. Brain Res. 1985;329:265–273. doi: 10.1016/0006-8993(85)90532-3. [DOI] [PubMed] [Google Scholar]
- Breier A, Kestler L, Adler C, Elman I, Wiesenfeld N, Malhotra A, Pickar D. Dopamine D2 receptor density and personal detachment in healthy subjects. Am J Psychiatry. 1998;155:1440–1442. doi: 10.1176/ajp.155.10.1440. [DOI] [PubMed] [Google Scholar]
- Buchsbaum MS, Christian BT, Lehrer DS, Narayanan TK, Shi B, Mantil J, Kemether E, Oakes TR, Mukherjee J. D2/D3 dopamine receptor binding with [F-18]fallypride in thalamus and cortex of patients with schizophrenia. Schizophr Res. 2006;85:232–244. doi: 10.1016/j.schres.2006.03.042. [DOI] [PubMed] [Google Scholar]
- Caruana DA, Chapman CA. Dopaminergic suppression of synaptic transmission in the lateral entorhinal cortex. Neural Plast. 2008;2008:203514. doi: 10.1155/2008/203514. [DOI] [PMC free article] [PubMed] [Google Scholar]
- Caruana DA, Reed SJ, Sliz DJ, Chapman CA. Inhibiting dopamine reuptake blocks the induction of long-term potentiation and depression in the lateral entorhinal cortex of awake rats. Neurosci Lett. 2007;426:6–11. doi: 10.1016/j.neulet.2007.08.025. [DOI] [PubMed] [Google Scholar]
- Casanova R, Srikanth R, Baer A, Laurienti PJ, Burdette JH, Hayasaka S, Flowers L, Wood F, Maldjian JA. Biological parametric mapping: A statistical toolbox for multimodality brain image analysis. Neuroimage. 2007;34:137–143. doi: 10.1016/j.neuroimage.2006.09.011. [DOI] [PMC free article] [PubMed] [Google Scholar]
- Chakos MH, Lieberman JA, Bilder RM, Borenstein M, Lerner G, Bogerts B, Wu H, Kinon B, Ashtari M. Increase in caudate nuclei volumes of first-episode schizophrenic patients taking antipsychotic drugs. Am J Psychiatry. 1994;151:1430–1436. doi: 10.1176/ajp.151.10.1430. [DOI] [PubMed] [Google Scholar]
- Douaud G, Gaura V, Ribeiro MJ, Lethimonnier F, Maroy R, Verny C, Krystkowiak P, Damier P, Bachoud-Levi AC, Hantraye P, Remy P. Distribution of grey matter atrophy in Huntington’s disease patients: a combined ROI-based and voxel-based morphometric study. Neuroimage. 2006;32:1562–1575. doi: 10.1016/j.neuroimage.2006.05.057. [DOI] [PubMed] [Google Scholar]
- First MB, Spitzer RL, Gibbon M, Williams JBW. Structured Clinical Interview for DSM-IV Axis I Disorders, Clinical Version (SCID-CV) American Psychiatric Press Inc; Washington, D.C: 1996. [Google Scholar]
- Good CD, Johnsrude IS, Ashburner J, Henson RN, Friston KJ, Frackowiak RS. A voxel-based morphometric study of ageing in 465 normal adult human brains. Neuroimage. 2001;14:21–36. doi: 10.1006/nimg.2001.0786. [DOI] [PubMed] [Google Scholar]
- Honea R, Crow TJ, Passingham D, Mackay CE. Regional deficits in brain volume in schizophrenia: a meta-analysis of voxel-based morphometry studies. Am J Psychiatry. 2005;162:2233–2245. doi: 10.1176/appi.ajp.162.12.2233. [DOI] [PubMed] [Google Scholar]
- Ilg R, Wohlschlager AM, Gaser C, Liebau Y, Dauner R, Woller A, Zimmer C, Zihl J, Muhlau M. Gray matter increase induced by practice correlates with task-specific activation: a combined functional and morphometric magnetic resonance imaging study. J Neurosci. 2008;28:4210–4215. doi: 10.1523/JNEUROSCI.5722-07.2008. [DOI] [PMC free article] [PubMed] [Google Scholar]
- Ito H, Takahashi H, Arakawa R, Takano H, Suhara T. Normal database of dopaminergic neurotransmission system in human brain measured by positron emission tomography. Neuroimage. 2008;39:555–565. doi: 10.1016/j.neuroimage.2007.09.011. [DOI] [PubMed] [Google Scholar]
- Jones L, Fischer I, Levitt P. Nonuniform alteration of dendritic development in the cerebral cortex following prenatal cocaine exposure. Cereb Cortex. 1996;6:431–445. doi: 10.1093/cercor/6.3.431. [DOI] [PubMed] [Google Scholar]
- Joyce JN. D2 but not D3 receptors are elevated after 9 or 11 months chronic haloperidol treatment: influence of withdrawal period. Synapse. 2001;40:137–144. doi: 10.1002/syn.1035. [DOI] [PubMed] [Google Scholar]
- Kalsbeek A, Buijs RM, Hofman MA, Matthijssen MA, Pool CW, Uylings HB. Effects of neonatal thermal lesioning of the mesocortical dopaminergic projection on the development of the rat prefrontal cortex. Brain Res. 1987;429:123–132. doi: 10.1016/0165-3806(87)90145-3. [DOI] [PubMed] [Google Scholar]
- Kalsbeek A, Matthijssen MA, Uylings HB. Morphometric analysis of prefrontal cortical development following neonatal lesioning of the dopaminergic mesocortical projection. Exp Brain Res. 1989;78:279–289. doi: 10.1007/BF00228899. [DOI] [PubMed] [Google Scholar]
- Keller SS, Roberts N. Voxel-based morphometry of temporal lobe epilepsy: an introduction and review of the literature. Epilepsia. 2008;49:741–757. doi: 10.1111/j.1528-1167.2007.01485.x. [DOI] [PubMed] [Google Scholar]
- Kemether EM, Buchsbaum MS, Byne W, Hazlett EA, Haznedar M, Brickman AM, Platholi J, Bloom R. Magnetic resonance imaging of mediodorsal, pulvinar, and centromedian nuclei of the thalamus in patients with schizophrenia. Arch Gen Psychiatry. 2003;60:983–991. doi: 10.1001/archpsyc.60.9.983. [DOI] [PubMed] [Google Scholar]
- Kestler LP, Malhotra AK, Finch C, Adler C, Breier A. The relation between dopamine D2 receptor density and personality: preliminary evidence from the NEO personality inventory-revised. Neuropsychiatry Neuropsychol Behav Neurol. 2000;13:48–52. [PubMed] [Google Scholar]
- Lammertsma AA, Bench CJ, Hume SP, Osman S, Gunn K, Brooks DJ, Frackowiak RS. Comparison of methods for analysis of clinical [11C]raclopride studies. J Cereb Blood Flow Metab. 1996;16:42–52. doi: 10.1097/00004647-199601000-00005. [DOI] [PubMed] [Google Scholar]
- Lancaster JL, Tordesillas-Gutierrez D, Martinez M, Salinas F, Evans A, Zilles K, Mazziotta JC, Fox PT. Bias between MNI and Talairach coordinates analyzed using the ICBM-152 brain template. Hum Brain Mapp. 2007;28:1194–1205. doi: 10.1002/hbm.20345. [DOI] [PMC free article] [PubMed] [Google Scholar]
- Lieberman JA, Tollefson GD, Charles C, Zipursky R, Sharma T, Kahn RS, Keefe RS, Green AI, Gur RE, McEvoy J, Perkins D, Hamer RM, Gu H, Tohen M. Antipsychotic drug effects on brain morphology in first-episode psychosis. Arch Gen Psychiatry. 2005;62:361–370. doi: 10.1001/archpsyc.62.4.361. [DOI] [PubMed] [Google Scholar]
- Maes F, Collignon A, Vandermeulen D, Marchal G, Suetens P. Multimodality image registration by maximization of mutual information. IEEE Trans Med Imaging. 1997;16:187–198. doi: 10.1109/42.563664. [DOI] [PubMed] [Google Scholar]
- Maguire EA, Gadian DG, Johnsrude IS, Good CD, Ashburner J, Frackowiak RS, Frith CD. Navigation-related structural change in the hippocampi of taxi drivers. Proc Natl Acad Sci USA. 2000;97:4398–4403. doi: 10.1073/pnas.070039597. [DOI] [PMC free article] [PubMed] [Google Scholar]
- Maldjian JA, Laurienti PJ, Kraft RA, Burdette JH. An automated method for neuroanatomic and cytoarchitectonic atlas-based interrogation of fMRI data sets. Neuroimage. 2003;19:1233–1239. doi: 10.1016/s1053-8119(03)00169-1. [DOI] [PubMed] [Google Scholar]
- Meda SA, Giuliani NR, Calhoun VD, Jagannathan K, Schretlen DJ, Pulver A, Cascella N, Keshavan M, Kates W, Buchanan R, Sharma T, Pearlson GD. A large scale (N=400) investigation of gray matter differences in schizophrenia using optimized voxel-based morphometry. Schizophr Res. 2008;101:95–105. doi: 10.1016/j.schres.2008.02.007. [DOI] [PMC free article] [PubMed] [Google Scholar]
- Mukherjee J, Christian BT, Dunigan KA, Shi B, Narayanan TK, Satter M, Mantil J. Brain imaging of 18F-fallypride in normal volunteers: blood analysis, distribution, test-retest studies, and preliminary assessment of sensitivity to aging effects on dopamine D-2/D-3 receptors. Synapse. 2002;46:170–188. doi: 10.1002/syn.10128. [DOI] [PubMed] [Google Scholar]
- Mukherjee J, Christian BT, Narayanan TK, Shi B, Collins D. Measurement of d-amphetamine-induced effects on the binding of dopamine D-2/D-3 receptor radioligand, 18F-fallypride in extrastriatal brain regions in non-human primates using PET. Brain Res. 2005;1032:77–84. doi: 10.1016/j.brainres.2004.11.005. [DOI] [PubMed] [Google Scholar]
- Pappas BA, Murtha SJ, Park GA, Condon KT, Szirtes RM, Laventure SI, Ally A. Neonatal brain dopamine depletion and the cortical and behavioral consequences of enriched postweaning environment. Pharmacol Biochem Behav. 1992;42:741–748. doi: 10.1016/0091-3057(92)90023-9. [DOI] [PubMed] [Google Scholar]
- Pluim JP, Maintz JB, Viergever MA. Image registration by maximization of combined mutual information and gradient information. IEEE Trans Med Imaging. 2000;19:809–814. doi: 10.1109/42.876307. [DOI] [PubMed] [Google Scholar]
- Reinoso BS, Undie AS, Levitt P. Dopamine receptors mediate differential morphological effects on cerebral cortical neurons in vitro. J Neurosci Res. 1996;43:439–453. doi: 10.1002/(SICI)1097-4547(19960215)43:4<439::AID-JNR5>3.0.CO;2-G. [DOI] [PubMed] [Google Scholar]
- Riccardi P, Li R, Ansari MS, Zald D, Park S, Dawant B, Anderson S, Doop M, Woodward N, Schoenberg E, Schmidt D, Baldwin R, Kessler R. Amphetamine-induced displacement of [18F] fallypride in striatum and extrastriatal regions in humans. Neuropsychopharmacology. 2006;31:1016–1026. doi: 10.1038/sj.npp.1300916. [DOI] [PubMed] [Google Scholar]
- Riccardi P, Zald DH, Park S, Li R, Ansari MS, Dawant B, Anderson S, Woodward N, Schmidt D, Baldwin R, Kessler RM. Sex differences in amphetamine induced displacement of [18F] fallypride in striatal and extrastriatal regions: A PET study. Am J Psychiatry. 2005 doi: 10.1176/ajp.2006.163.9.1639. [DOI] [PubMed] [Google Scholar]
- Selemon LD, Lidow MS, Goldman-Rakic PS. Increased volume and glial density in primate prefrontal cortex associated with chronic antipsychotic drug exposure. Biol Psychiatry. 1999;46:161–172. doi: 10.1016/s0006-3223(99)00113-4. [DOI] [PubMed] [Google Scholar]
- Shattuck DW, Mirza M, Adisetiyo V, Hojatkashani C, Salamon G, Narr KL, Poldrack RA, Bilder RM, Toga AW. Construction of a 3D probabilistic atlas of human cortical structures. Neuroimage. 2008;39:1064–1080. doi: 10.1016/j.neuroimage.2007.09.031. [DOI] [PMC free article] [PubMed] [Google Scholar]
- Shaw P, Gornick M, Lerch J, Addington A, Seal J, Greenstein D, Sharp W, Evans A, Giedd JN, Castellanos FX, Rapoport JL. Polymorphisms of the dopamine D4 receptor, clinical outcome, and cortical structure in attention-deficit/hyperactivity disorder. Arch Gen Psychiatry. 2007;64:921–931. doi: 10.1001/archpsyc.64.8.921. [DOI] [PubMed] [Google Scholar]
- Shenton ME, Dickey CC, Frumin M, McCarley RW. A review of MRI findings in schizophrenia. Schizophr Res. 2001;49:1–52. doi: 10.1016/s0920-9964(01)00163-3. [DOI] [PMC free article] [PubMed] [Google Scholar]
- Thompson PM, Hayashi KM, Sowell ER, Gogtay N, Giedd JN, Rapoport JL, de Zubicaray GI, Janke AL, Rose SE, Semple J, Doddrell DM, Wang Y, van Erp TG, Cannon TD, Toga AW. Mapping cortical change in Alzheimer’s disease, brain development, and schizophrenia. Neuroimage. 2004;23(Suppl 1):S2–18. doi: 10.1016/j.neuroimage.2004.07.071. [DOI] [PubMed] [Google Scholar]
- Volkow ND, Fowler JS, Wang GJ, Baler R, Telang F. Imaging dopamine’s role in drug abuse and addiction. Neuropharmacology. 2008 doi: 10.1016/j.neuropharm.2008.05.022. [DOI] [PMC free article] [PubMed] [Google Scholar]
- Wang HD, Deutch AY. Dopamine depletion of the prefrontal cortex induces dendritic spine loss: reversal by atypical antipsychotic drug treatment. Neuropsychopharmacology. 2008;33:1276–1286. doi: 10.1038/sj.npp.1301521. [DOI] [PMC free article] [PubMed] [Google Scholar]
- Werhahn KJ, Landvogt C, Klimpe S, Buchholz HG, Yakushev I, Siessmeier T, Muller-Forell W, Piel M, Rosch F, Glaser M, Schreckenberger M, Bartenstein P. Decreased dopamine D2/D3-receptor binding in temporal lobe epilepsy: an [18F]fallypride PET study. Epilepsia. 2006;47:1392–1396. doi: 10.1111/j.1528-1167.2006.00561.x. [DOI] [PubMed] [Google Scholar]
- Zipursky RB, Meyer JH, Verhoeff NP. PET and SPECT imaging in psychiatric disorders. Can J Psychiatry. 2007;52:146–157. doi: 10.1177/070674370705200303. [DOI] [PubMed] [Google Scholar]
Associated Data
This section collects any data citations, data availability statements, or supplementary materials included in this article.
Supplementary Materials
Supplemental Figure 1. Grey matter segmentation results at the level of the midbrain and basal ganglia for three subjects (S1–S3). (A) Normalized brain at the level of the substantia nigra (inset). (B) Inset from A showing, clockwise from top left, normalized brain at level of midbrain; grey matter segmented at 1 mm isotropic voxel resolution; grey matter segmented resampled to 2 mm isotropic voxels; binding potential at 2 mm isotropic voxel resolution. (C) Representative slice from individual normalized brains, and grey matter segmented images at 1 mm and 2 mm isotropic voxel resolution demonstrating segmentation results of cortex, caudate, putamen, and thalamus.