

Abstract
Public quality reports of hospitals, health plans, and physicians are being used to promote efficiency and quality in the health care system. Shrinkage estimators have been proposed as superior measures of quality to be used in these reports because they offer more conservative and stable quality ranking of providers than traditional, nonshrinkage estimators. Adopting the perspective of a patient faced with choosing a local provider on the basis of publicly provided information, we examine the advantages and disadvantages of shrinkage and nonshrinkage estimators and contrast the information made available by them. We demonstrate that 2 properties of shrinkage estimators make them less useful than nonshrinkage estimators for patients making choices in their area of residence.
Measuring the performance of medical care providers has become an important facet of the American health care system over the last 2 decades. It is 1 of the 4 cornerstones of the Bush Administration's 2006 “Value-Driven Health Care Initiative,”1 which called for measuring and publishing information about quality and using this information to improve quality and promote the efficiency of medical care. Quality measures, based on either patient outcomes (e.g., risk-adjusted mortality rates) or process measures (e.g., percentage of health maintenance organization [HMO] enrollees with diabetes who received an eye examination), are reported in public report cards2,3 and are driving Pay for Performance programs.4–6
The accuracy of quality measures depends on a number of factors, including data quality,7 the impact of risk adjustment,8–12 sample size,13 and the specification of the quality measures themselves (i.e., whether they are defined as the difference or the ratio of observed to expected outcome rates).14,15 The use of shrinkage estimators rather than the traditional, nonshrinkage estimators (defined in the next section) has also been shown to result in different quality rankings.16–19
We focus on the choice between specifying quality measures based on shrinkage versus the more traditional nonshrinkage estimators, and we discuss the merits and the implications of each approach. Unlike other researchers, who have argued in favor of shrinkage estimators because of their stability,16–18 we approach this issue from the perspective of a patient whose objective is to choose the best provider from among those available locally, and thus consider different criteria in evaluating the usefulness of the quality measures. We first describe the 2 approaches to the estimation of quality measures and define the shrinkage- and nonshrinkage-based measures. We then discuss their advantages and disadvantages, and conclude by considering the options for best meeting the needs of patients.
DEFINING SHRINKAGE AND NONSHRINKAGE ESTIMATORS
We focus our discussion on quality measures that compare patient outcomes (e.g., mortality) across providers. We recognize that unbiased measurement of quality requires risk adjustment, but the issues that we discuss here apply equally to both risk-adjusted and unadjusted measures. Therefore, for simplicity of exposition we omit risk adjustment from our discussion, and note that the arguments we make and the conclusions we reach are not affected by this omission.
Consider the measurement of quality based on a health outcome such as mortality. Denote by Oij the health outcome for patient i treated by provider j. The quality measure we seek is based on the average outcomes experienced by all patients treated by provider j. For example, if mortality is the outcome of interest, the average mortality rate for all patients treated in hospital j, or some function of it, can be defined as the quality measure for hospital j, and then used to compare and rank the performance of all hospitals on this outcome.
The unshrunk estimator (also called “nonshrinkage estimator”) of the quality of provider j is defined as the mean for all patients treated by provider j, denoted as  . This is an accurate (i.e., unbiased) estimate of the provider's outcome rate. Its precision depends on the sample size used to calculate it. Providers treating a large number of patients will have more precise estimates of than those treating fewer patients.
Stein20 and later James and Stein21 proposed a different measure, called the shrinkage estimator,  , and showed that it is more efficient (i.e., has a lower squared mean error) than the unshrunk estimator, . The shrinkage estimator is defined as a weighted average of the unshrunk estimator, , and the average outcome rate calculated over all providers (i.e., the grand mean,
  ). Conceptually, the shrinkage estimator is designed to be close to the unshrunk estimator, , when provider j has a large sample and thus can be estimated with high precision, and to be close to the grand mean, , when provider j has a small sample and cannot be estimated precisely. In the latter case, it is assumed that the grand mean is a better reflection of the true outcome (see further discussion in this section for the rationale for this and alternative assumptions), and therefore the estimator is pulled, or “shrunk,” toward the grand mean. The name “shrinkage estimator” is derived from this property of the estimator.
Specifically, the shrinkage estimator is calculated as  , where the weight αj depends on the relative variance of the outcome within each provider, the sample size within each provider, and the variance across providers.22 When the variance within the provider is relatively small and the sample size is large, the weight will be close to 1 and the shrinkage estimator will be dominated by the second term in the equation and will approximate the unshrunk estimator, . When the variance within the provider is large relative to the variance across providers and the sample size is small, αj will be very small, the second term in the equation will converge to zero, and the shrinkage estimator will be dominated by the first term (i.e., the grand mean, ).
This shrinkage estimator is often referred to as an empirical Bayesian estimator. In the context of empirical Bayesian estimation, it can be viewed as follows. Prior to the measurement of the outcome, we have beliefs about the distribution of outcomes across providers. We perform the measurement and obtain new information about these outcomes. Because of the stochastic nature of outcome data, the new information is imprecise. Therefore, instead of completely abandoning our prior beliefs, we only partially update them to incorporate the new information. The degree of updating depends on our confidence in the new information, which in turn depends on the sample size used to estimate the outcome rates. The larger the sample size, the higher the confidence in the new information and the more the estimator will be weighed toward the new information, which is the unshrunk mean. The smaller the sample size, the less confidence we have in the new data and the more we weigh the estimator toward the prior belief. Typically, in the context of quality measurement, the analyst adopts a prior belief that all providers have the same performance and thus all observed outcomes rates are shrunk toward the grand mean for all providers. Clearly, a different choice of prior belief (or, in the parlance of statisticians, “prior”) could lead to vastly different estimators.
Calculation of Shrinkage Estimators
To illustrate how shrinkage estimators are calculated and how they differ from the unshrunk estimators, we provide an example constructed to highlight their salient properties. Table 1 provides data from the 2004 New York State Cardiac Surgery Report23 on coronary artery bypass graft procedures for 10 hospitals. For each hospital, we show the number of cases (sample size), the number of deaths, the observed mortality rate (which is the unshrunk estimator), and the variance within the hospital. From these, we calculated the grand mean and variance across all hospitals and, on the basis of these, the shrinkage factors and the shrinkage estimators for each hospital. As Table 1 shows, hospital 1, with the largest sample, has the largest shrinkage factor, therefore its shrinkage estimator is very similar to its observed, unshrunk estimator (2.31 and 2.38, respectively). By contrast, hospital 6 has the smallest shrinkage factor because it has the smallest sample and the largest variance. For this hospital, because of its small sample, one has little confidence in the observed mortality rate, therefore the shrinkage estimator is very close to the grand mean of 2.10 rather than to its observed mortality rate of 3.70. This reflects the belief (i.e., the “prior”) that this hospital's true mortality rate is more likely to be similar to the average of all other hospitals than to its actual mortality that year (i.e., 2004), which might be an aberration.
TABLE 1.
Example of Calculation of Shrinkage Estimator, Based on Data From New York State 2004 Adult Cardiac Surgery Report
| Hospital | No. of Cases (nj) | No. of Deaths | Unshrunk Estimator (): Mortality Rate per 100 Cases |
Variance Within the Hospital ( ) ) |
Shrinkage Factor (αj)a | Shrunk Estimator (): Mortality Rate per 100 Casesb
|
| 6 | 81 | 3 | 3.70 | 0.0357 | 0.127 | 2.30 |
| 10 | 89 | 2 | 2.25 | 0.0220 | 0.205 | 2.13 |
| 2 | 118 | 2 | 1.69 | 0.0167 | 0.311 | 1.97 |
| 3 | 132 | 1 | 0.76 | 0.0075 | 0.528 | 1.39 |
| 4 | 256 | 5 | 1.95 | 0.0191 | 0.460 | 2.03 |
| 8 | 277 | 4 | 1.44 | 0.0142 | 0.554 | 1.73 |
| 9 | 286 | 8 | 2.80 | 0.0272 | 0.402 | 2.38 |
| 7 | 290 | 5 | 1.72 | 0.0169 | 0.522 | 1.90 |
| 5 | 488 | 11 | 2.25 | 0.0220 | 0.586 | 2.19 |
| 1 | 1050 | 25 | 2.38 | 0.0232 | 0.742 | 2.31 |
Note.  (variance across hospitals) = 0.0000638, calculated from “unshrunk estimator” column. (overall mean) = 2.10, calculated from “unshrunk estimator” column.
Source. New York State Department of Health.23
Calculated as 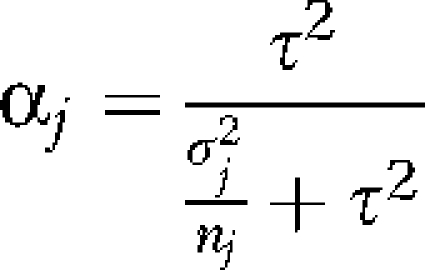 .
.
Calculated as .
Figure 1 depicts the same information graphically. The unshrunk estimators are shown at the bottom, and their shrinkage counterparts are shown at the top. For example, the estimate for hospital 2, with 118 patients, is shrunk more toward the overall mean than the estimator for hospital 8, with 277 patients.
FIGURE 1.

The relationship between unshrunk and shrinkage estimators.
Note. Values are based on data from the New York State Department of Health.23 Calculations are available from the authors upon request. Each numbered line corresponds to the hospital with the same number.
Use of Shrinkage Estimators in Multivariate Regressions
In the preceding sections, we did not take into account the issue of risk adjustment. Clearly, however, risk adjustment is important in the context of quality measurement. Shrinkage estimators can be calculated for quality measures that are risk adjusted as well, by using random effect models. These multivariate regression models, which predict patient outcomes (e.g., mortality) based on individual patient risks, assume that the intercept of the model is different for each provider. The provider-specific intercept is equivalent to the shrinkage estimator and is calculated in a manner analogous to the equation for given previously, such that it equals the provider-specific outcome rate when the provider has a large sample and small variance, and is shrunk toward the grand mean as its sample declines and the variance increases. These estimators can be calculated in standard statistical packages, such as SAS (SAS Institute Inc, Cary, North Carolina), which offers proc MIXED for linear regression models and proc GLIMMIX for models with discrete dependent variables. For examples using random effects risk adjustment models, see Glance et al.19 and Arling et al.18
Note that we focus our discussion on the use of shrinkage estimators for quality measurement, but random effect models can be used in other instances, such as multicenter clinical trials or observational studies involving hierarchical data structures.24
Advantages of Shrinkage Estimators
Stable predictions.
Stein20 and James and Stein21 have argued that the shrinkage estimator is superior to the unshrunk estimator. They have shown that it always results in lower expected total square errors for the group of providers as a whole. This result is achieved because the shrinkage estimator trades the bias introduced when estimates are shrunk toward the grand mean with higher efficiency (lower mean squared error).
The intuition behind this result is that when samples are small, there is a higher likelihood that any one summary measurement will result in an extreme value. Thus, if a small hospital that treats a small number of patients has a high mortality rate this year, it might be due to chance rather than true poor quality. In the following year, the same hospital may have a much lower mortality rate. If we believe that all hospitals have the same average mortality rate, we will expect that an observed extreme rate in a given year is a fluke and that next year we will observe it “regressing to the mean.” Note that this result crucially depends on the assumption that the smaller hospital provides the same quality of care as the larger hospitals.
Adjustment for multiple comparisons.
Another advantage of the shrinkage estimator is that it adjusts for multiple comparisons. It is defined in such a way that the degree of shrinkage depends on the number of groups (e.g., hospitals) that are compared. The more comparisons, the larger the shrinkage.24,25
The multiple comparison problem arises when we want to answer the question of whether the outcome of a specific provider is a statistical outlier compared with the average outcomes of all providers. In other words, having observed an extreme outcome rate for this provider, can we conclude that it is due to a true difference in the quality of care of this provider, or is it due to the stochastic nature of outcome measures? We can expect that a certain percentage will be flagged as outliers, even if in truth they are not—type I error in the language of statisticians. The multiple comparison problem can be stated as follows: if we compare 100 hospitals and use a P value of .05 to identify outliers, 5 of these hospitals, or 5%, will have a P value below .05 by chance alone and we will therefore conclude that they are outliers, even though their outcome rate is not truly different from all other providers.
The typical remedy to guard against such type I errors is to require a more conservative (lower P value) threshold for concluding that an observation is a statistical outlier. The Bonferroni correction26 is a common approach that can be applied to the unshrunk estimators, if one chooses.
The shrinkage estimator incorporates the number of comparisons into the shrinkage formula, such that the larger the number of comparisons, the larger the shrinkage of the measured value toward the grand mean. Thus, the likelihood that one would consider a given provider an outlier diminishes as the number of comparisons increases and the shrinkage factor increases.
Disadvantages of Shrinkage Estimators
Best prediction.
The predictive efficiency of the shrinkage estimators derives from the assumption that all providers are similar and are likely to have the same average performance. If that assumption is correct, then shrinking extreme values toward the grand mean mimics the naturally observed “regression to the mean” phenomenon that will occur in the next period of measurement (e.g., the following year). Thus, for the group of providers as a whole, the shrinkage estimator is superior; however, for any specific provider, this may not be the case. For those providers whose performance truly deviates from the performance of others, the naturally occurring “regression to the mean” phenomenon will result in a regression to a value that is different from the grand mean. They will regress to the mean of their own performance and to a distribution different from that of the grand mean. Therefore, the shrinkage estimate will not provide a superior prediction for these providers.
In fact, the motivation for quality report cards is the notion that some providers perform at substantially different levels from their peers. For them, one would not anticipate regression to the grand mean, and as Efron and Morris25 note, for such providers the shrinkage estimator would do substantially worse as a predictor than the unshrunk estimator.
Ranking providers—the “black box.”
As we have shown, the degree of shrinkage increases as the sample size and the precision of the outcome measurement for each provider decreases. A resulting artifact is that the rank order of providers changes because of the shrinkage. This is demonstrated in Table 1 and Figure 1 for hospitals 1 and 6. Hospital 1 is large, with a mortality rate close to the grand mean. Hospital 6 is small, with a very high mortality rate. The shrinkage estimator for hospital 1, because it has a large sample, is very close to the unshrunk estimator. The shrinkage estimator for hospital 6, however, because it is much smaller and its own average mortality rate is imprecise, will be shrunk substantially toward the mean. The end result is that the shrinkage estimators for both are almost the same, suggesting that both hospitals offer the same quality care. Consumers reviewing a report card based on shrinkage estimators will conclude that they will do equally well with either.
This, however, is not an accurate interpretation of the data, because in reality the two are very different. For hospital 1, we know with a high degree of certainty that it performs at the average level. For hospital 6, however, we do not really know. The observed high mortality rate may be due to chance because of the sample size or it may be due to the fact that it actually provides lower quality care. Given the extant literature that shows that higher volume is usually associated with better patient outcomes,27–31 one might actually find the second hypothesis more reasonable.
For patients, whose objective it is to choose the best provider for themselves, the shrinkage estimator is misleading. It offers patients a black box that combines information about the estimated mortality rate with the precision of this estimate but does not allow them to weigh these 2 pieces of information separately, in ways consistent with their own preferences.
For sophisticated consumers who are statistically savvy, such as large employers or payers, this problem might be somewhat mitigated if the report card also provides a confidence interval around the shrinkage estimate. For the average patient, who may have difficulty understanding quality measures in general, the statistical significance information is likely to be ignored, so this does not provide a remedy.
The assumption about the “prior.”
The shrinkage estimator is typically calculated as the weighted average of the unshrunk estimate and prior distribution, with a mean equal to the grand mean across all providers. It is unclear, however, whether this is the best, or most believable, assumption about the prior distribution. As mentioned, there is a body of literature that indicates an association between provider volume and outcomes—that hospitals and physicians treating larger patient populations tend to have better outcomes. Given this information, it would be more reasonable to adopt a prior distribution with a mean that depends on each provider's sample size. Using such a prior, the shrinkage estimator will no longer pull all estimates toward the grand mean; rather, the smaller provider will have estimates that are pulled toward lower quality.
Furthermore, the relationship between volume and outcomes is not universal. It seems to be important for some conditions, such as coronary artery bypass graft,27 and not others, such as trauma.32–34 Therefore, one might consider using a prior specific to the medical condition being measured. Adopting such more-informed priors would mitigate the problem we identified in the previous section, in which a large average hospital has the same quality estimate as a small hospital with extreme outcome rates.
Irrelevant multiple comparisons.
We noted in the section “Adjustment for Multiple Comparisons” that the shrinkage estimator also incorporates an adjustment for multiple comparisons. The larger the number of comparisons, the more the estimator is shrunk toward the grand mean. Unlike the impact of differential sample sizes, the number of comparisons is the same for all providers included in the analysis, hence the impact on the estimates of their quality is the same. Thus, the multiple comparison adjustment does not affect the rank order of providers. It does reduce the variation in outcome rates, however. As shown in Figure 1, the range of values of the shrinkage estimators is more limited than the range of the unshrunk estimator.
The number of comparisons is typically determined by the availability of data and the nature of the entity calculating the quality measures, and is not related to the number of relevant choices that the consumer faces. For example, the 2004 New York State Cardiac Surgery Report included over 150 cardiac surgeons. Although, in principle, all might be relevant to patients considering cardiac surgery, in practice, studies have found that patients tend to stay within their area of residence. An analysis of migration patterns in New York identified 9 distinct referral areas in the state, with most patients (about 95%) staying within these areas.35 For a patient residing in the Rochester area, whose choice includes 7 surgeons, adjusting the shrinkage estimator for over 150 comparisons—most of which are irrelevant—might result in inappropriate shrinking of the quality measure, to the point that no variation between the 7 relevant providers remains. Similarly, if the Centers for Medicaid and Medicare Services were to adopt this approach for its Nursing Home Compare report card, which includes over 16 000 nursing homes nationwide, in all likelihood there would be no discernible variation between these facilities, rendering the report card uninformative and irrelevant.
DISCUSSION
The choice between shrinkage and nonshrinkage estimators for quality measurement is important, as it clearly changes the rank order of providers, the degree of variation among them, and the identification of statistical outliers. Several studies have demonstrated these differences and argued in favor of adopting shrinkage estimators in quality reporting.18,36 Our analysis of the properties of these 2 estimators suggests that although the shrinkage estimators may be preferred if the objective is to increase the accuracy of predicted mortality across all providers, it may not serve the needs of individual patients who are making a choice among the providers available to them locally, and who may have different prior beliefs and different preferences over the “riskiness” of the quality measures than those held by the analyst producing the information. In particular, shrinkage estimators tend to be the most biased for providers who are extreme quality outliers. These providers are exactly those that patients and third-party payers are most interested in identifying.
Unfortunately, there does not seem to be one correct solution. The uncertainty in quality measures based on outcomes is inherent and can only be addressed by increasing sample size, often an impractical solution given the realities of medical care. A strategy proposed by Spiegelhalter et al.24 is to perform sensitivity analysis and present shrinkage estimates based on several prior distributions, allowing consumers to choose the prior that is most consistent with their beliefs. For example, one might include in report cards measures based on uninformative priors, as is current practice, as well as priors related to provider volume. Report cards based on this strategy are likely to be complex and difficult to understand for most patients. They may also face political obstacles if the priors are unacceptable to strong stakeholder groups. For example, the most obvious prior to consider, as mentioned previously, is one based on volume, in which low-volume providers are assumed to have lower quality relative to higher-quality providers. Would the Centers for Medicaid and Medicare Services be able to publish a hospital public report card with quality measures based on such a prior given the strong lobbying power of hospitals?
Another strategy, adopted by New York State in its Cardiac Surgery Reports and the Centers for Medicaid and Medicare Services in the Nursing Home Compare report, is to present unshrunk estimators but to include in the public report only information about providers that have met a minimum volume cutoff. Unlike using shrinkage estimators, this strategy clearly identifies those cases in which the precision of the measures has been judged to be insufficient. The disadvantage of this strategy is that the analyst imposes his or her own judgment of what is an acceptable level of accuracy for quality measures, which also may lead to bias. For example, cardiac patients in New York State can obtain information only about the quality of surgeons who performed at least 200 procedures in the last 3 years.23 For patients in Pennsylvania, however, the report card available for access will offer measures on all surgeons who performed at least 30 procedures in the last year.37
Although none of these strategies offers a completely satisfying solution to the problems inherent in evaluating quality based on outcomes, in the spirit of transparency—which is the aim of public reporting on provider quality—we prefer the unshrunk measures, which, when accompanied by a measure of their statistical significance such as a P value or a confidence interval, do not present patients with a “black box” but are explicit about the degree of uncertainty in the estimated quality measures. The challenge remains to present the information in such a way that patients and those who help them make referral decisions (family members, physicians, social workers, payers, and others) can understand the information, its accuracy, and its precision, and to apply it to their specific choices in accordance with their own preferences.
Acknowledgments
We gratefully acknowledge funding from the National Institute on Aging (grant AG027420) and the Agency for Healthcare Research and Quality (grant HS016737).
Human Participant Protection
There were no human participants involved in this study.
References
- 1.US Dept of Health and Human Services Value-driven health care. Available at: http://www.hhs.gov/valuedriven/fourcornerstones/index.html. Accessed August 15, 2007
- 2.US Dept of Health and Human Services Hospital compare. Available at: http://www.hospitalcompare.hhs.gov/Hospital/Search/SearchMethod.asp. Accessed August 15, 2007
- 3.Centers for Medicare & Medicaid Services Nursing home compare report card. Available at: http://www.medicare.gov/NHCompare. Accessed April 1, 2007
- 4.Rosenthal MB, Landon BE, Normand SL, Frank RG, Epstein AM. Pay for performance in commercial HMOs. N Engl J Med 2006;355(18):1895–1902 [DOI] [PubMed] [Google Scholar]
- 5.Centers for Medicare & Medicaid Services Medicare “Pay for Performance (P4P)” Initiatives. Available at: http://www.cms.hhs.gov/apps/media/press/release.asp?Counter=1343. Accessed June 20, 2007
- 6.Silow-Carroll S, Alteras T. Value-driven health care purchasing: four states that are ahead of the curve. The Commonwealth Fund, vol 67, August 15, 2007. Available at: http://www.commonwealthfund.org/publications/publications_show.htm?doc_id=515778&#doc515778. Accessed November 5, 2009
- 7.Lawthers AG, McCarthy EP, Davis RB, Peterson LE, Palmer RH, Iezzoni LI. Identification of in-hospital complications from claims data: is it valid? Med Care 2000;38(8):785–795 [DOI] [PubMed] [Google Scholar]
- 8.Iezzoni LI, Shwartz M, Ash AS, Mackiernan Y, Hotchkin EK. Risk adjustment methods can affect perceptions of outcomes. Am J Med Qual 1994;9(2):43–48 [DOI] [PubMed] [Google Scholar]
- 9.Iezzoni LI, Shwartz M, Ash AS, Hughes JS, Daley J, Mackiernan YD. Severity measurement methods and judging hospital death rates for pneumonia. Med Care 1996;34(1):11–28 [DOI] [PubMed] [Google Scholar]
- 10.Iezzoni LI, Ash AS, Shwartz M, Daley J, Hughes JS, Mackiernan YD. Judging hospitals by severity-adjusted mortality rates: the influence of the severity-adjustment method. Am J Public Health 1996;86(10):1379–1387 [DOI] [PMC free article] [PubMed] [Google Scholar]
- 11.Mukamel DB, Brower CA. The influence of risk adjustment methods on conclusions about quality of care in nursing homes based on outcome measures. Gerontologist 1998;38(6):695–703 [DOI] [PubMed] [Google Scholar]
- 12.Glance LG, Osler TM, Dick A. Rating the quality of intensive care units: is it a function of the intensive care unit scoring system? Crit Care Med 2002;30(9):1976–1982 [DOI] [PubMed] [Google Scholar]
- 13.Localio AR, Hamory BH, Fisher AC, TenHave TR. The public release of hospital and physician mortality data in Pennsylvania: a case study. Med Care 1997;35(3):272–286 [DOI] [PubMed] [Google Scholar]
- 14.Mukamel DB, Dick A, Spector WD. Specification issues in measurement of quality of medical care using risk adjusted outcomes. J Econ Soc Meas 2000;26(3–4):267–281 [Google Scholar]
- 15.Li Y, Dick A, Glance LG, Cai X, Mukamel D. Misspecification issues in risk adjustment and construction of outcome based quality indicators. Health Serv Outcomes Res Methodol 2007;7(1–2):39–56 [Google Scholar]
- 16.Shahian DM, Torchiana DF, Shemin RJ, Rawn JD, Normand SL. Massachusetts cardiac surgery report card: implications of statistical methodology. Ann Thorac Surg 2005;80(6):2106–2113 [DOI] [PubMed] [Google Scholar]
- 17.Normand SL, Glickman ME, Gatsonis CA. Statistical methods for profiling providers of medical care: issues and applications. J Am Stat Assoc 1997;92:803–814 [Google Scholar]
- 18.Arling G, Lewis T, Kane RL, Mueller C, Flood S. Improving quality assessment through multilevel modeling: the case of nursing home compare. Health Serv Res 2007;42(3 pt 1):1177–1199 [DOI] [PMC free article] [PubMed] [Google Scholar]
- 19.Glance LG, Dick A, Osler TM, Li Y, Mukamel DB. Impact of changing the statistical methodology on hospital and surgeon ranking: the case of the New York State cardiac surgery report card. Med Care 2006;44(4):311–319 [DOI] [PubMed] [Google Scholar]
- 20.Stein C. Inadmissibility of the usual estimator for the mean of a multivariate normal distribution. : Proceedings of the Third Berkeley Symposium on Mathematical Statistics and Probability Vol1 Berkeley: University of California Press; 1955:197–206 [Google Scholar]
- 21.James W, Stein C. Estimation with quadratic loss. : Proceedings of the Fourth Berkeley Symposium on Mathematical Statistics and Probability Vol1 Berkeley: University of California Press; 1960:361–380 [Google Scholar]
- 22.Hox J. Multilevel Analysis: Techniques and Applications Mahwah, NJ: Lawrence Erlbaum Associates; 2002 [Google Scholar]
- 23.Adult Cardiac Surgery in New York State 2002– 2004 Albany: New York State Dept of Health; June 2006 [Google Scholar]
- 24.Spiegelhalter DJ, Abrams KR, Myles JP. Bayesian Approaches to Clinical Trials and Health-Care Evaluation New York, NY: Wiley & Sons; 2004 [Google Scholar]
- 25.Efron B, Morris C. Stein's paradox in statistics. Sci Am 1977;236:119–127 [Google Scholar]
- 26.Abdi H. The Bonferroni and Sidak corrections for multiple comparisons. Encyclopedia of Measurement and Statistics Available at: http://www.utdallas.edu/∼herve/Abdi-Bonferroni2007-pretty.pdf. Accessed January 28, 2008
- 27.Hughes RG, Hunt SS, Luft HS. Effect of surgeon volume and hospital volume on quality of care in hospitals. Med Care 1987;25(6):489–503 [DOI] [PubMed] [Google Scholar]
- 28.Gordon TA, Bowman HM, Bass EB, et al. Complex gastrointestinal surgery: impact of provider experience on clinical and economic outcomes. J Am Coll Surg 1999;189(1):46–56 [DOI] [PubMed] [Google Scholar]
- 29.Long DM, Gordon T, Bowman H, et al. Outcome and cost of craniotomy performed to treat tumors in regional academic referral centers. Neurosurgery 2003;52(5):1056–1063; discussion, 1063–1065 [PubMed] [Google Scholar]
- 30.Barbieri CE, Lee B, Cookson MS, et al. Association of procedure volume with radical cystectomy outcomes in a nationwide database. J Urol 2007;178(4 pt 1):1418–1421 [DOI] [PubMed] [Google Scholar]
- 31.Nguyen NT, Paya M, Stevens CM, Mavandadi S, Zainabadi K, Wilson SE. The relationship between hospital volume and outcome in bariatric surgery at academic medical centers. Ann Surg 2004;240(4):586–593; discussion, 593–594 [DOI] [PMC free article] [PubMed] [Google Scholar]
- 32.Glance LG, Osler TM, Dick A, Mukamel D. The relation between trauma center outcome and volume in the National Trauma Databank. J Trauma 2004;56(3):682–690 [DOI] [PubMed] [Google Scholar]
- 33.Cooper A, Hannan EL, Bessey PQ, Farrell LS, Cayten CG, Mottley L. An examination of the volume–mortality relationship for New York State trauma centers. J Trauma 2000;48(1):16–23; discussion, 23–24 [DOI] [PubMed] [Google Scholar]
- 34.Margulies DR, Cryer HG, McArthur DL, Lee SS, Bongard FS, Fleming AW. Patient volume per surgeon does not predict survival in adult level I trauma centers. J Trauma 2001;50(4):597–601; discussion, 601–603 [DOI] [PubMed] [Google Scholar]
- 35.Mukamel DB, Mushlin AI, Weimer DL, Zwanziger J, Parker T, Indridason I. Do quality report cards play a role in HMOs' contracting practices? Evidence from New York State. Health Serv Res 2000;35(1 pt 2):319–332 [PMC free article] [PubMed] [Google Scholar]
- 36.Shahian DM, Normand SL, Torchiana DF, et al. Cardiac surgery report cards: comprehensive review and statistical critique. Ann Thorac Surg 2001;72(6):2155–2168 [DOI] [PubMed] [Google Scholar]
- 37.Pennsylvania Healthcare Cost Containment. Pennsylvania Guide to Coronary Bypass Graft Surgery. Available at: http://www.phc4.org/reports/cabg/05/docs/cabg2005report.pdf. Accessed December 11, 2009