Abstract
Human myeloid leukemia cells exposed to 1,25-dihydroxyvitamin D3 (1,25D), a major cancer chemopreventive agent, acquire features of normal monocytes and arrest in the G1 phase of the cell cycle, due to the upregulation of p27Kip1 and p21Cip1, but the mechanism is not clear. Here evidence is provided that an exposure of HL60 and U937 cells to low (1–10 nM) concentrations of 1,25D decreases the expression of miR181a and miR181b in a concentration and time-dependent manner. Since the predicted miR181 targets include the 3'-UTR of p27Kip1, we expressed pre-miR181a in these cells, and found that the elevation of cellular miR181a levels abrogates the 1,25D-induced increase in p27Kip1 at both mRNA and protein levels. In contrast, transfection of pre-miR181a resulted in a slight elevation of p21Cip1 expression. Importantly, transfection of pre-miR181a blunted the effect of 1,25D on the expression of monocytic differentiation markers, and reduced the G1 block in 1,25D-treated cells, while transfection of anti-miR181a increased 1,25D-induced differentiation. Together, these data show that miR181a participates in 1,25D-induced differentiation of HL60 and U937 cells, and suggest that a high constitutive expression of members of miR181 family may contribute to the malignant phenotype in the myeloid lineage.
Keywords: MicroRNA 181, vitamin D, p27Kip1, p21Cip1, myeloid leukemia, differentiation
Introduction
One of the unsolved puzzles in hematopoiesis is how cell differentiation is coupled to the retardation, and then cessation, of proliferative activity. The practical importance of this coupling is that impaired differentiation leads to uncontrolled cellular proliferation and its attendant genetic instability results in malignancy. Thus, studies of the reversal of the malignant phenotype are likely to provide clues to the mechanistic basis for the differentiation-growth arrest connection.
Among cellular systems used for such studies, the promyeloblastic leukemia HL60 and pro-monocytic leukemia U937 cells have been widely utilized, and the physiological derivative of vitamin D, 1,25-dihydroxyvitamin D3 (1,25D) can induce (HL60 cells) or enhance (U937 cells) the monocytic phenotype and arrest their proliferation, predominantly in the G1 phase of the cell cycle.1–4 Important mechanistic insights were obtained when it was reported that the expression of p27Kip1 and p21Cip1, the small protein inhibitors of cyclin-dependent kinases (Cdks), is upregulated by 1,25D in both HL60 and U937 cells,5–7 and that in the case of p27Kip1 this is largely the result of the stabilization of this protein due to reduced expression of subunits of S-phase kinase protein-2 (Skp2).8 Further studies demonstrated that p27Kip1 degradation is also controlled by the cyclin-dependent subunit 1 (Cks1),9 and by Spy1.10 In addition, p27Kip1 can be inactivated by cytoplasmic sequestration,11 or downregulated by miR221/222 in a number of solid tumors.12–14
The evidence presented here demonstrates that in cultured human myeloid cells the expression of p27Kip1 can also be regulated by at least two members of miR181 family, and that 1,25D-induced repression of these microRNAs contributes to the accumulation of p27Kip1 and the arrest of the cell cycle progression in G1 phase.
Results
Exposure of HL60 and U937 cells to 1,25D downregulates the expression of miR181a and miR181b in a dose and time-dependent manner
MicroRNAs repress protein expression at the posttranscriptional level, and are coming into prominence as regulators of most biological functions, including differentiation and hematopoiesis. For instance, retinoic acid downregulates the expression of miR181b in APL cells. Using a miRNA microarray platform21 we found that the principal miRNAs downregulated by 1,25D in HL60 cells were several members of the miR181 family, with the most markedly downregulated one being miR181a (data not shown).
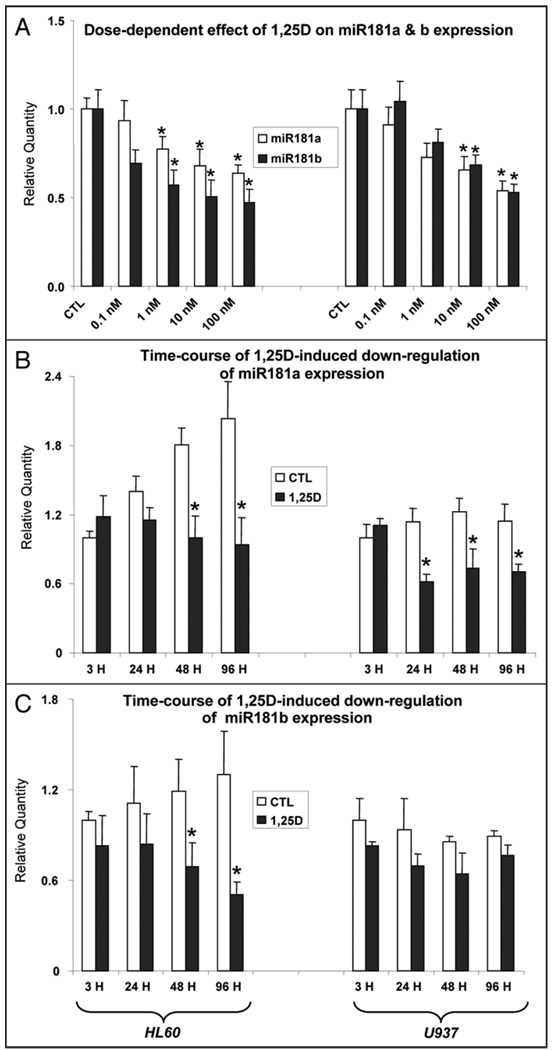
The dose-dependent decreases in miR181a and miR181b were confirmed by qRT-PCR (Fig. 1A), and the downregulation of these miRs was also time-dependent (Fig. 1B and C), as was 1,25D-induced downregulation of miR181c (not shown). The 1,25D-induced decreases in miRs181 were less marked in U937 than in HL60 cells, possibly due to the later stage of the arrest of hematopoietic maturation of U937 cells, with cellular programs for monocytic phenotype already partially in place.
Figure 1.
Dose and time-dependent downregulation of miR181a and miR181b expression determined by qRT-PCR. (A) Mir181 levels after an exposure for 48 hr (H) to the indicated concentrations of 1,25D of HL60 (left), or U937 cells (right). (B) Time-dependent decrease in miR181a following an exposure to 1 nM (HL60) or 10 nM (U937) cells, which are less sensitive to 1,25D. (C) As (B), but levels of miR181b are shown here. Asterisks show the statistically significant differences from the corresponding vehicle-treated control (CTL) (p < 0.05; mean values +/− SE, n = 3).
The 3'-UTR of p27Kip1 has a potential miR-181 binding site
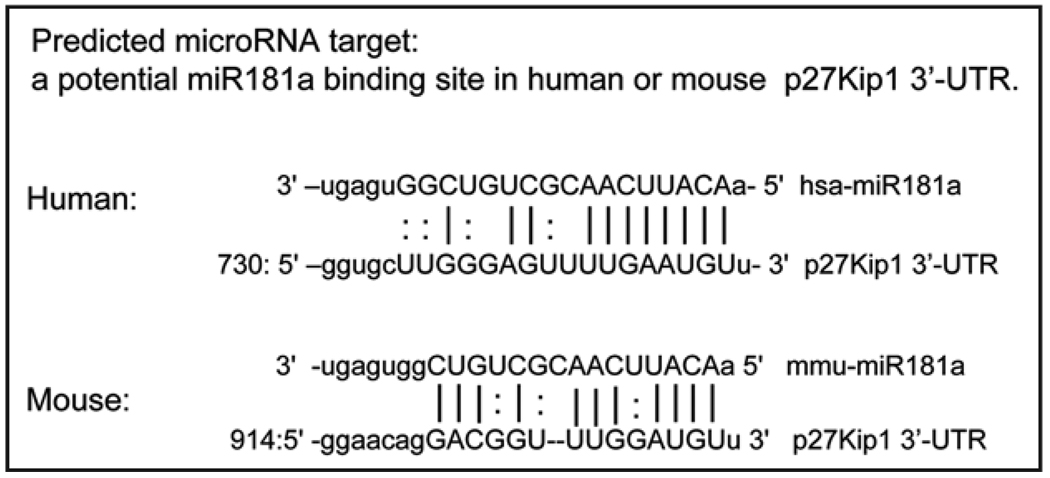
Public web-based prediction sites were used to predict target sites in the 3' untranslated regions (3'-UTR) of human gene transcripts for possible binding of miRNAs, e.g., microRNA. org,16 and TargetScan.17 In addition, three target prediction online softwares (MIRANDA, TARGETSCAN and PICTAR-VERT) are available for miR181a at Sanger miRBase. As indicated in Figure 2, there is a potential miR181 binding site in the 3'-UTR of p27Kip1 gene,16,17 which shares homology with the mouse p27Kip1 gene. The alignment scores with the human gene are: 181a= 158; 181b= 150; 181c = 148; and 181d = 145.16,17 No potential binding sites for miRs181 in the p21Cip1 gene were reported.16,17
Figure 2.
The predicted miR181a binding site in p27Kip1 3'-UTR. Schematic representation of potential miR181a binding sites within the 3'-UTR of human and mouse p27Kip1 genes.
Transfection of pre-miR181a abrogates 1,25D-induced upregulation of p27Kip1, but not p21Cip1 gene
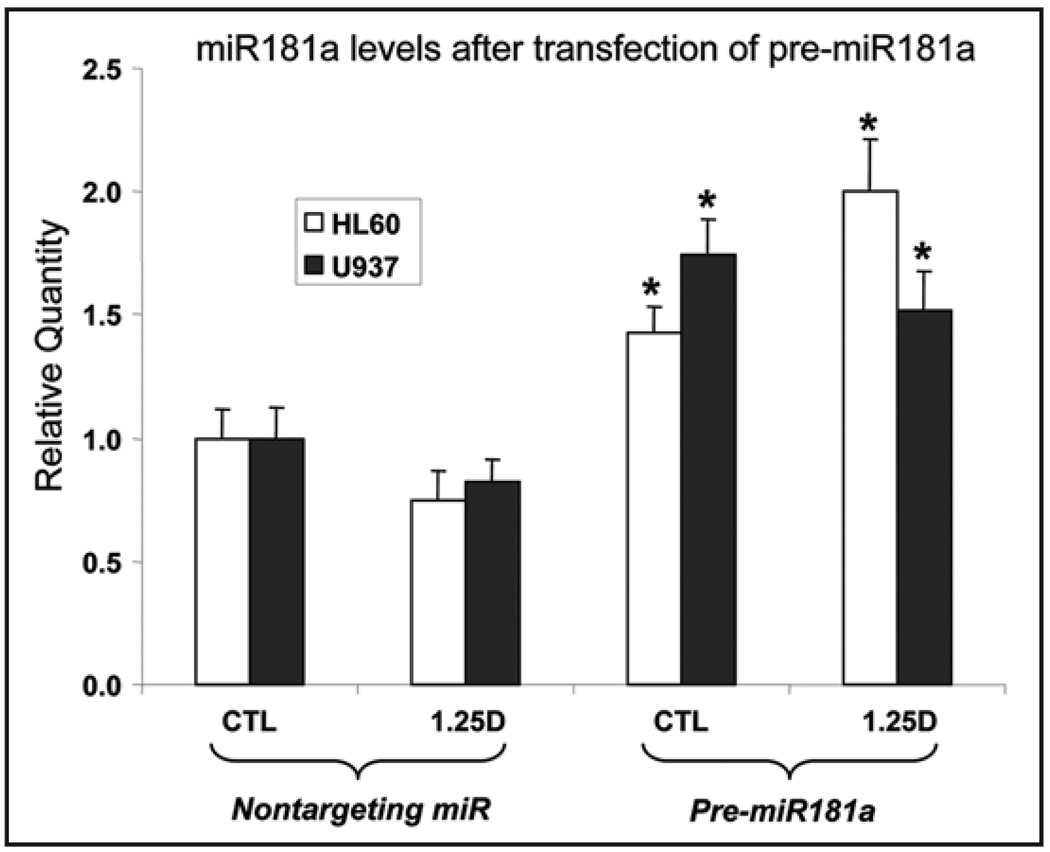
Since miR181a has the best predicted alignment with the p27Kip1 target site, the subsequent experiments focused on this miR. When exogenous pre-miRs are expressed in leukemia cells they are processed to functional miRs.22 We first confirmed the efficiency of the transfection procedure by transfecting a test miRNA, pre-miR1, and found that compared to the non-targeting miR, it reduced the levels of protein tyrosine kinase 9 (PTK9) mRNA, the target of miR1, to approximately 30% of the control level (data not shown). Direct measurement of miR181a levels in HL60 and U937 cells transfected with pre-miR181a and treated with 1,25D showed that miR181a levels approximately doubled (Fig. 3).
Figure 3.
Cellular levels of miR 181a following transfection of HL60 cells with pre-miR181a or the nontargeting (NT) control miR, and 24 hr later addition of ethanol vehicle or 1 nM 1,25D for additional 48 hr. Asterisks show the statistically significant differences from the corresponding NT miRNA-treated control (p < 0.05; mean values +/− SE, n = 3).
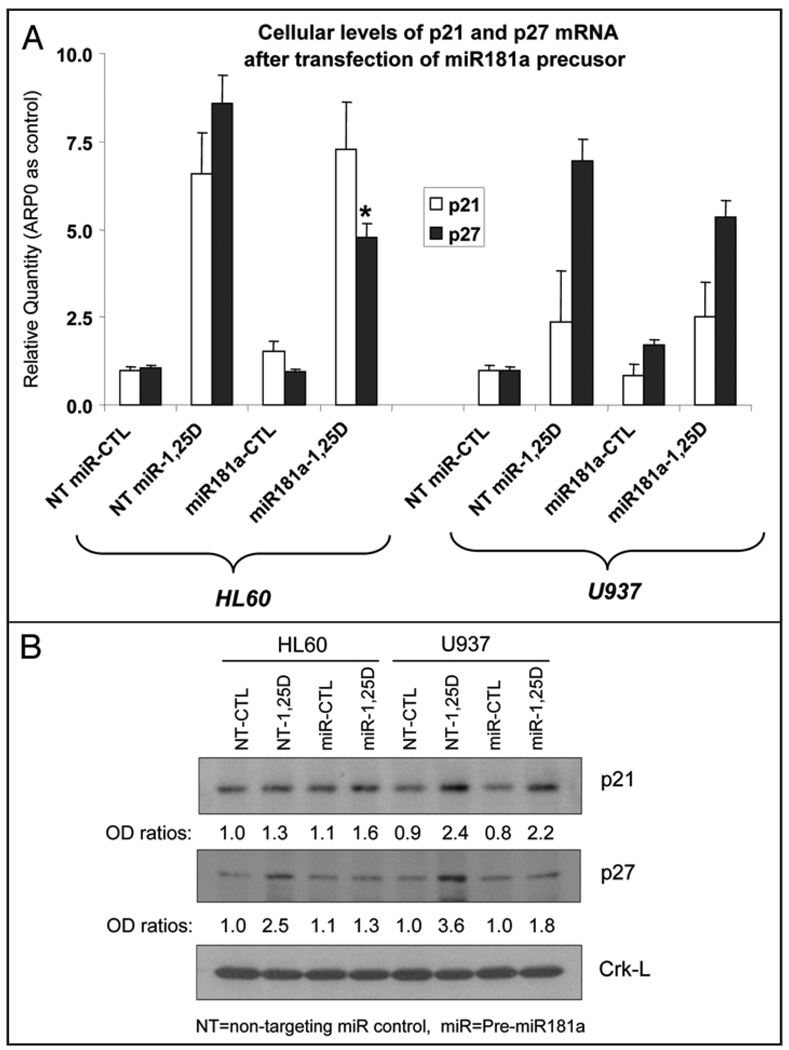
The results of pre-miR181a transfections in HL60 and U937 cells on the p27Kip1 target are shown in Figure 4A and B. In HL60 cells there was a marked reduction in p27Kip1 mRNA and protein levels compared to non-target miR transfection, and less marked decreases in U937 cells were also observed. However, there appeared to be no significant decrease in either p21Cip1 mRNA (Fig. 4A) or protein levels (Fig. 4B) following pre-miR181a transfection. These results show that in 1,25D-treated myeloid leukemia cells p27Kip1 is a specific target of miR181a, in contrast to the situation in solid tumors such as glioblastoma, hepatocellular carcinoma, and thyroid carcinoma, in which miRs221/222 have this role.12–14 However, it is also possible that in other circumstances miRs181 and 221/222 can act in concert.23
Figure 4.
Transfection of pre-miR181a abrogates 1,25D-induced upregulation of p27Kip1. (A) Levels of p27Kip1 and p21Cip1 mRNA determined by qRT-PCR. The asterisk shows the statistically significant difference from the corresponding non-targeting miRNA-treated control (p < 0.05; mean values +/− SE, n = 3). (B) Levels of p27Kip1 and p21Cip1 protein determined by Western blotting. The concentration of 1,25D was 10 nM, treatment for 48 hr. NT = non-targeting miR control; miR=pre miR 181a. Protein levels of Crk-L were loading controls, and were used to normalize the optical density (“OD ratios”) of each band shown below each panel. The blots shown are representative of three experiments.
Transfection of pre-miR181a inhibits 1,25D-induced expression of monocytic differentiation markers and G1 arrest
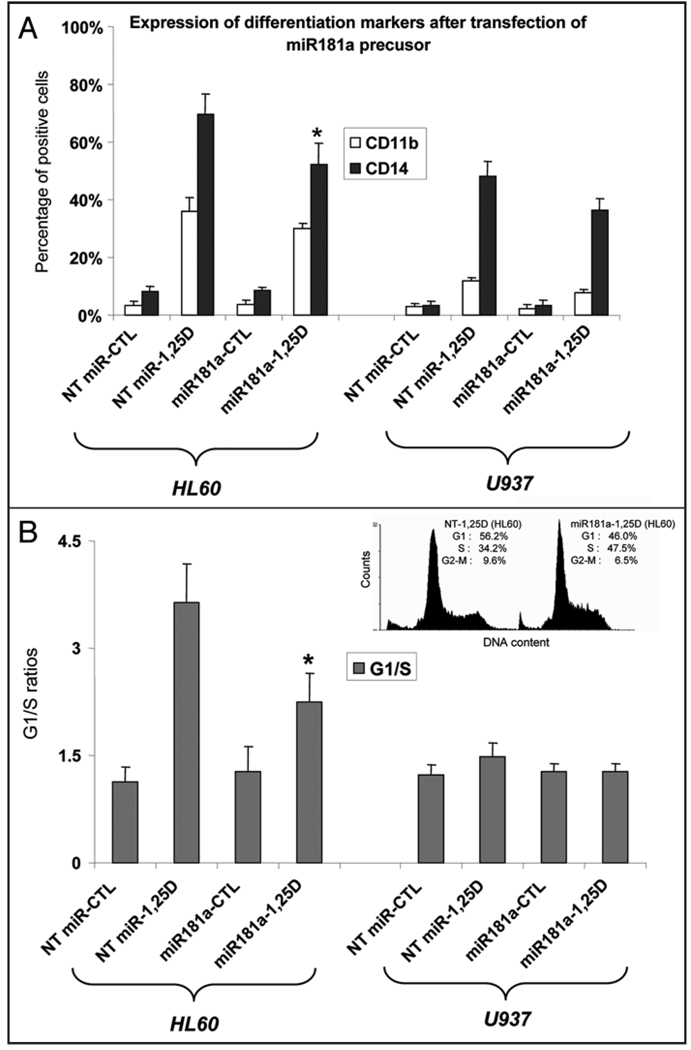
The modulation by miR181a of the 1,25D effect on leukemia cell differentiation marker CD14 appears to parallel the downregulation of p27 mRNA levels in both HL60 and U937 cells (compare Fig. 5A with Fig. 4A). The reduction in the surface marker CD11b was less marked, and no difference was noted in the basal levels of either marker, consistent with little change in miR181a RNA levels in cells not treated with 1,25D. This suggests that the principal action of the transfected miR181a occurs in the context of 1,25D-induced cellular alterations, and that threshold levels of miR181a are necessary for the biological effects.
Figure 5.
Inhibition of 1,25D-induced differentiation and cell cycle block by miR181a. (A) Effect of miR181a on the expression of differentiation markers CD11b and CD14. 10 nM 1,25D was used for 48 hr. (B) Effect on the G1 to S phase ratios of the proportion of cells in each compartment, determined by flow cytometry. The insets in panel B show examples of the abrogation of 1,25D-induced G1 to S phase block by transfection of pre-miR181a in HL60 cells. (In control cells G1 was 46.2%, S phase was 38.0%; cells exposed only to miR181a: G1 was 42.5%, S phase was 48.8%. For comparison, the values shown in the inset for 1,25D-treated cells were G1: 56.2%, S phase: 34.2%, while miR181a transfection and treatment with 1,25D, the values were G1: 46.0%, S phase: 47.5%). Asterisks show the statistically significant differences from the corresponding non-targeting (NT) miRNA-treated control (p < 0.05; mean values +/− SE, n = 3).
The 1,25D-induced G1 cell cycle arrest in HL60 cells was also markedly reduced by pre-miR181a transfection (Fig. 5B), but in an experiment performed in parallel 1,25D did not induce a significant G1 block in U937 cells. However, the small G1 block apparent in U937 cells in Figure 5B, was consistently seen in individual experiments, and was reduced when pre-miR181a was transfected (not shown).
MiR181a inhibitor enhances differentiation induced by low concentration of 1,25D
To further confirm that miR181a is a negative regulator of monocytic differentiation, we transfected miR181a inhibitor, as well as non-targeting microRNA, and treated HL60 cells with 1 nM 1,25D for 48 h. Determination of surface markers of differentiation showed that in cells transfected with miR181a antagonist oligo CD14 expression increased by 23.9% compared to control transfection , CD11b increased by 25.0%, and the measurements of cell cycle parameters showed a 22.2% increase in the G1/S phase ratio, indicating that inhibition of miR181a expression accelerates monocytic differentiation.
Discussion
Vitamin D is a major cancer chemopreventive agent, but the mechanisms of its actions are not well understood. The studies presented here demonstrate that miRs181 contribute to the control of G1 to S phase transition in myeloid leukemia cells differentiating when treated with 1,25D. This is a new role for miRs181, previously linked to the B-lineage cells in mouse bone marrow in which it is preferentially expressed.24 In murine cells miR181a was also found to have increased expression in mature T cells, where it acts as a “rheostat” which governs T cell sensitivity to antigens.25
The current report provides the first evidence for an involvement of miR181 in the modulation of the expression of the cell cycle regulator p27Kip1. It is clear that miRs181 contribute to the control of G1 to S phase transition in myeloid leukemia cells differentiating when treated with 1,25D. It appears that in proliferating HL60 cells the constitutively high expression of miRs181 results in low levels of p27Kip1 mRNA and protein, which are insufficient to inhibit Cdk4/6 activity, and thus the cells continue to traverse the cell cycle. When 1,25D is added, miRs181 levels are reduced, resulting in increases at first in p27Kip1 mRNA, then p27Kip1 protein levels, contributing to the G1 block. It is not surprising that when the levels of miR181a are artificially increased by the transfection of exogenous pre-miR181a there is only a modest, although significant (p < 0.05), reversal of the cell cycle block, since p21Cip1 is also involved in the G1 block, and p21Cip1 levels are increased by 1,25D.5,7 Further, protein levels of p27Kip1 are also regulated by its phosphorylation on S10,26 and T198,27 which stabilize p27Kip1, and on T187,28 which is followed by Skp2-dependent ubiquitination,8,29 with involvement of Cks1,9 and Spy1.10 Clearly, the importance to the cell survival of a smooth G1 to S phase transition requires a concerted action of several mechanisms, and an interference with only one such mechanism may have only a moderate effect. Thus, it would not be realistic to expect a complete control of p27 levels by miRs181 alone.
It is also interesting that retinoic acid, as mentioned above, has been reported to downregulate the expression of miR181b in Acute Promyelocytic Leukemia cells, though the effects on the other miRs, 181a, 181c and 181d, and the link between the downregulation of miR181b and cell cycle control were not addressed in that study.21 Nonetheless, the Garzon et al. report21 and the present study combine to demonstrate that the downregulation of miRs181 is important for the induced differentiation of myeloid leukemia cells. These studies also illustrate the exquisite cell context-specificity of microRNA expression and their functional targets,30 and support the possibility that enhanced miR181 expression contributes to the initiation of the neoplastic changes that lead to myeloid leukemias.
Materials and Methods
Chemicals and antibodies
1,25D was a kind gift from Dr. Milan Uskokovic (Bioxell, Nutley NJ). Complete protease inhibitor cocktail was purchased from Hoffmann-La Roche (Nutley, NJ). For Western blotting studies, antibodies p21, p27 and Crk-L, were obtained from Santa Cruz Biotechnology (Santa Cruz, CA). Anti-rabbit and anti-goat antibodies linked to HRP were purchased from Cell Signaling Technologies (Danvers, MA).
Cell culture
HL60-G cells, derived from a patient with promyeloblastic leukemia,15 were cultured in suspension in RPMI-1640 medium supplemented with 10% bovine calf serum (Hyclone, Logan, UT) in a humidified atmosphere containing 5% CO2 at 37°C. U937 cells obtained from ATCC (Manassas, VA) were cultured under the same conditions as HL60 cells, though the concentration of 1,25D routinely used was 10 nM, as U937 cells are less sensitive to 1,25D than HL60 cells, which unless indicated otherwise, were treated with 1 nM 1,25D. Cells were passaged 2–3 times a week and were used in the exponential growth phase. Cells were routinely tested for mycoplasma by selective culture techniques. For all experiments the cells were suspended in fresh medium and the experiment was repeated at least three times.
MicroRNA target predictions
Public web-based prediction sites were used to predict target sites in the 3' untranslated regions (3'UTR) of human gene transcripts for possible binding of miRNAs, e.g., microRNA.org resource (http://www.microrna.org/microrna),16 and TargetScan (http://www.targetscan.org).17 In addition, and as example, three target prediction online softwares (MIRANDA, TARGETSCAN and PICTAR-VERT) are available for miR181a at Sanger miRBase of http://microrna.sanger.ac.uk/cgi-bin/sequences/mirna_entry.pl?acc=MI0000289.
Transfection of miRNA precursors and inhibitors
This was carried out using Endo-Porter delivery reagent from Gene Tools Inc., (Philomath, OR). Pre-miR181a and non-targeting pre-miR miRNA precursors (Ambion, Austin, TX) were transfected at a final concentration of 10 nM for 24 hr before exposure to other compounds. Pre-miR-1 miRNA precursor was designed for use as a positive control in the optimization of transfection conditions. This positive control can effectively downregulate the expression of PTK-9 at the mRNA level.18 Anti-miR181a or anti-miR Negative Control #1 (Ambion) were transfected at a final concentration of 10 nM for 24 hr before exposure to other compounds.
Markers of monocytic differentiation
Aliquots of 1 × 10⁶ cells were harvested, washed twice with phosphate buffered saline (PBS), suspended and incubated for 45 min at room temperature with 0.5 µl MY4-RD-1 and 0.5 µl MO1-FITC antibodies to analyze the expression of surface cell markers CD14 and CD11b, respectively. The cells were then washed three times with ice-cold PBS, resuspended in 1 ml PBS and analyzed using EPICS XL Flow Cytometer (Beckman Coulter). Isotypic mouse IgG1 was used to set threshold parameters.
Cell cycle analysis
The DNA content of HL60 cells was determined as follows: one million cells were harvested and washed twice with phosphate buffered saline (PBS), then fixed with 75% ethanol at −20°C for 24 hr. Cells were then collected and resuspended in 1 ml of PBS with RNase (at 10 µg/ml, Sigma) and propidium iodide (PI at 10 µg/ml, Sigma) for 30 min. at 37°C. PI stained cells were analyzed using EPICS flow cytometer. The resultant histogram of DNA content was gated and analyzed using the multicycle program to determine the proportions of cell cycle.
RNA extraction, miRNA expression profiling and qRT-PCR confirmation
Total RNA containing microRNA was extracted by using Trizol (Invitrogen, CA) according to manufacturer’s protocol. miRNA expression profiling was performed on OSUCCC version 4.0 arrays (ArrayExpress Accession # A-MEXP-1246) and the methodology of miRNA profiling was as described.19 In brief, 2.5–5 µg of total RNA was reverse transcribed into first strand cDNA using biotin end-labeled random octamer oligo primers. The biotin-labeled cDNA targets hybridize to probes on array and the hybridization signal was further amplified and detected using Streptavidin Alexa 647 (Invitrogen). The assayed arrays were scanned by Axon 4000B (Molecular Device, CA) using GenePix 6.0 software. The miRNAs expressed differentially on the array were further validated and confirmed using qRT-PCR as described here. cDNA was synthe using TaqMan microRNA Reverse Transcription Kit (Applied Biosystems, Foster City, CA). Mature miRs were quantitated using two-step TaqMan real-time PCR with TaqMan microRNA kit for each microRNA studied here. MiR181 expression levels shown here were normalized using U6 rRNA (Applied Biosystems). In preliminary experiments normalization using 18S RNA also showed similar results.
Quantitative Real Time PCR for p21Cip1 and p27Kip1 was carried out using a lightcycler with FastStart DNA SYBR Green PCR kit (Roche Diagnostics, Indianapolis, IN) as described before.20 Fold changes of mRNA levels in target gene relative to the RNA polymerase II (RPII) control were calculated by relative quantification analysis. Primers used for p21 were: upstream 5'-TTA GCA GCG GAA CAA GGA GTC AGA-3', downstream 5'-ACA CTA AGC ACT TCA GTG CCT CCA-3'; primers for p27 were upstream 5'-AGC AAT GCG CAG GAA TAA GGA AGC-3', downstream 5'-TAC GTT TGA CGT CTT CTG AGG CCA-3'. For RNA Pol II the primers were: upstream 5'-GCA CCA CGT CCA ATG ACA T-3', downstream 5'-GTG CGG CTG CTT CCA TAA-3'. The quality of PCR product was monitored using post-PCR melting curve analysis.
Western blotting
Western blotting was performed using whole cell extracts as described before.20 Briefly, membranes were incubated overnight with different primary antibodies, and then blotted with a horseradish peroxidase-linked secondary antibody for 1 hr. The protein bands were visualized using a chemiluminescence assay system (Pierce Biotechnology, Rockford, IL), each membrane was stripped and reprobed for internal control Crk-L. The optical density of each band was quantitated using ImageQuant 5.0 (Molecular Dynamics, Sunnyvale, CA).
Statistical methods
Each experiment was performed at least three times and the results were expressed as percentages (mean ± SE) of the vehicle controls. Significance of the differences between mean values was assessed by a two-tailed Student’s t-test. All computations were performed with an IBM-compatible personal computer using Microsoft EXCEL.
Acknowledgements
Supported by NIH grant RO1-CA 44722-19 from the National Cancer Institute. We thank Drs. Bin Tian, Elizabeth Raveche and Robert Donnelly for helpful suggestions and comments on the manuscript.
Abbreviations
- miR
microRNA
- 1,25D
1,25-dihydroxyvitamin D3
- UTR
untranslated region
References
- 1.Studzinski GP, Bhandal AK, Brelvi ZS. Cell cycle sensitivity of HL-60 cells to the differentiation-inducing effects of 1-alpha,25-dihydroxyvitamin D3. Cancer Res. 1985;45:3898–3905. [PubMed] [Google Scholar]
- 2.Defacque H, Piquemal D, Basset A, Marti J, Commes T. Transforming growth factor-beta1 is an autocrine mediator of U937 cell growth arrest and differentiation induced by vitamin D3 and retinoids. J Cell Physiol. 1999;178:109–119. doi: 10.1002/(SICI)1097-4652(199901)178:1<109::AID-JCP14>3.0.CO;2-X. [DOI] [PubMed] [Google Scholar]
- 3.Rots NY, Iavarone A, Bromleigh V, Freedman LP. Induced differentiation of U937 cells by 1,25-dihydroxyvitamin D3 involves cell cycle arrest in G1 that is preceded by a transient proliferative burst and an increase in cyclin expression. Blood. 1999;93:2721–2729. [PubMed] [Google Scholar]
- 4.Wang QM, Studzinski GP, Chen F, Coffman FD, Harrison LE. p53/56(lyn) antisense shifts the 1,25-dihydroxyvitamin D3-induced G1/S block in HL60 cells to S phase. J Cell Physiol. 2000;183:238–246. doi: 10.1002/(SICI)1097-4652(200005)183:2<238::AID-JCP10>3.0.CO;2-1. [DOI] [PubMed] [Google Scholar]
- 5.Schwaller J, Koeffler HP, Niklaus G, Loetscher P, Nagel S, Fey MF, et al. Posttranscriptional stabilization underlies p53-independent induction of p21WAF1/CIP1/SDI1 in differentiating human leukemic cells. J Clin Invest. 1995;95:973–979. doi: 10.1172/JCI117806. [DOI] [PMC free article] [PubMed] [Google Scholar]
- 6.Wang QM, Jones JB, Studzinski GP. Cyclin-dependent kinase inhibitor p27 as a mediator of the G1-S phase block induced by 1,25-dihydroxyvitamin D3 in HL60 cells. Cancer Res. 1996;56:264–267. [PubMed] [Google Scholar]
- 7.Liu M, Lee MH, Cohen M, Bommakanti M, Freedman LP. Transcriptional activation of the Cdk inhibitor p21 by vitamin D3 leads to the induced differentiation of the myelomonocytic cell line U937. Genes Dev. 1996;10:142–153. doi: 10.1101/gad.10.2.142. [DOI] [PubMed] [Google Scholar]
- 8.Lin R, Wang TT, Miller WH, Jr, White JH. Inhibition of F-Box protein p45(SKP2) expression and stabilization of cyclin-dependent kinase inhibitor p27(KIP1) in vitamin D analog-treated cancer cells. Endocrinology. 2003;144:749–753. doi: 10.1210/en.2002-0026. [DOI] [PubMed] [Google Scholar]
- 9.Lehmann BD, Brooks AM, Paine MS, Chappell WH, McCubrey JA, Terrian DM. Distinct roles for p107 and p130 in Rb-independent cellular senescence. Cell Cycle. 2008;7:1262–1268. doi: 10.4161/cc.7.9.5945. [DOI] [PMC free article] [PubMed] [Google Scholar]
- 10.McAndrew CW, Gastwirt RF, Meyer AN, Porter LA, Donoghue DJ. Spy1 enhances phosphorylation and degradation of the cell cycle inhibitor p27. Cell Cycle. 2007;6:1937–1945. doi: 10.4161/cc.6.15.4520. [DOI] [PubMed] [Google Scholar]
- 11.Blain SW, Scher HI, Cordon-Cardo C, Koff A. p27 as a target for cancer therapeutics. Cancer Cell. 2003;3:111–115. doi: 10.1016/s1535-6108(03)00026-6. [DOI] [PubMed] [Google Scholar]
- 12.Gillies JK, Lorimer IA. Regulation of p27Kip1 by miRNA 221/222 in glioblastoma. Cell Cycle. 2007;6:2005–2009. doi: 10.4161/cc.6.16.4526. [DOI] [PubMed] [Google Scholar]
- 13.Visone R, Russo L, Pallante P, De Martino I, Ferraro A, Leone V, et al. MicroRNAs (miR)-221 and miR-222, both overexpressed in human thyroid papillary carcinomas, regulate p27Kip1 protein levels and cell cycle. Endocr Relat Cancer. 2007;14:791–798. doi: 10.1677/ERC-07-0129. [DOI] [PubMed] [Google Scholar]
- 14.Medina R, Zaidi SK, Liu CG, Stein JL, van Wijnen AJ, Croce CM, et al. MicroRNAs 221 and 222 bypass quiescence and compromise cell survival. Cancer Res. 2008;68:2773–2780. doi: 10.1158/0008-5472.CAN-07-6754. [DOI] [PMC free article] [PubMed] [Google Scholar]
- 15.Gallagher R, Collins S, Trujillo J, McCredie K, Ahearn M, Tsai S, et al. Characterization of the continuous, differentiating myeloid cell line (HL-60) from a patient with acute promyelocytic leukemia. Blood. 1979;54:713–733. [PubMed] [Google Scholar]
- 16.Betel D, Wilson M, Gabow A, Marks DS, Sander C. The microRNA.org resource: targets and expression. Nucleic Acids Res. 2008;36:149–153. doi: 10.1093/nar/gkm995. [DOI] [PMC free article] [PubMed] [Google Scholar]
- 17.Lewis BP, Burge CB, Bartel DP. Conserved seed pairing, often flanked by adenosines, indicates that thousands of human genes are microRNA targets. Cell. 2005;120:15–20. doi: 10.1016/j.cell.2004.12.035. [DOI] [PubMed] [Google Scholar]
- 18.Lim LP, Lau NC, Garrett-Engele P, Grimson A, Schelter JM, Castle J, et al. Microarray analysis shows that some microRNAs downregulate large numbers of target mRNAs. Nature. 2005;433:769–773. doi: 10.1038/nature03315. [DOI] [PubMed] [Google Scholar]
- 19.Liu CG, Calin GA, Meloon B, Gamliel N, Sevignani C, Ferracin M, et al. An oligonucleotide microchip for genome-wide microRNA profiling in human and mouse tissues. Proc Natl Acad Sci USA. 2004;101:9740–9744. doi: 10.1073/pnas.0403293101. [DOI] [PMC free article] [PubMed] [Google Scholar]
- 20.Wang X, Patel R, Studzinski GP. hKSR-2, a vitamin D-regulated gene, inhibits apoptosis in arabinocytosine-treated HL60 leukemia cells. Mol Cancer Ther. 2008;7:2798–2806. doi: 10.1158/1535-7163.MCT-08-0276. [DOI] [PMC free article] [PubMed] [Google Scholar]
- 21.Garzon R, Pichiorri F, Palumbo T, Visentini M, Aqeilan R, Cimmino A, et al. MicroRNA gene expression during retinoic acid-induced differentiation of human acute promyelocytic leukemia. Oncogene. 2007;26:4148–4157. doi: 10.1038/sj.onc.1210186. [DOI] [PubMed] [Google Scholar]
- 22.Schmittgen TD, Lee EJ, Jiang J, Sarkar A, Yang L, Elton TS, et al. Real-time PCR quantification of precursor and mature microRNA. Methods. 2008;44:31–38. doi: 10.1016/j.ymeth.2007.09.006. [DOI] [PMC free article] [PubMed] [Google Scholar]
- 23.Ivanovska I, Cleary MA. Combinatorial microRNAs: working together to make a difference. Cell Cycle. 2008;7:3137–3142. doi: 10.4161/cc.7.20.6923. [DOI] [PubMed] [Google Scholar]
- 24.Chen CZ, Li L, Lodish HF, Bartel DP. MicroRNAs modulate hematopoietic lineage differentiation. Science. 2004;303:83–86. doi: 10.1126/science.1091903. [DOI] [PubMed] [Google Scholar]
- 25.Li QJ, Chau J, Ebert PJ, Sylvester G, Min H, Liu G, et al. miR-181a is an intrinsic modulator of T cell sensitivity and selection. Cell. 2007;129:147–161. doi: 10.1016/j.cell.2007.03.008. [DOI] [PubMed] [Google Scholar]
- 26.Borriello A, Cucciolla V, Criscuolo M, Indaco S, Oliva A, Giovane A, et al. Retinoic acid induces p27Kip1 nuclear accumulation by modulating its phosphorylation. Cancer Res. 2006;66:4240–4248. doi: 10.1158/0008-5472.CAN-05-2759. [DOI] [PubMed] [Google Scholar]
- 27.Kossatz U, Vervoorts J, Nickeleit I, Sundberg HA, Arthur JS, Manns MP, et al. C-terminal phosphorylation controls the stability and function of p27kip1. Embo J. 2006;25:5159–5170. doi: 10.1038/sj.emboj.7601388. [DOI] [PMC free article] [PubMed] [Google Scholar]
- 28.Yarmishyn A, Child ES, Elphick LM, Mann DJ. Differential regulation of the cyclin-dependent kinase inhibitors p21(Cip1) and p27(Kip1) by phosphorylation directed by the cyclin encoded by Murine Herpesvirus 68. Exp Cell Res. 2008;314:204–212. doi: 10.1016/j.yexcr.2007.09.016. [DOI] [PubMed] [Google Scholar]
- 29.Carrano AC, Eytan E, Hershko A, Pagano M. SKP2 is required for ubiquitin-mediated degradation of the CDK inhibitor p27. Nat Cell Biol. 1999;1:193–199. doi: 10.1038/12013. [DOI] [PubMed] [Google Scholar]
- 30.Brown BD, Gentner B, Cantore A, Colleoni S, Amendola M, Zingale A, et al. Endogenous microRNA can be broadly exploited to regulate transgene expression according to tissue, lineage and differentiation state. Nat Biotechnol. 2007;25:1457–1467. doi: 10.1038/nbt1372. [DOI] [PubMed] [Google Scholar]


