

Abstract
BACKGROUND
Benign prostatic hyperplasia (BPH) is one of the most common diseases among aging men in the United States. In addition to aging, the presence of androgens is another major risk factor in BPH development. However, whether androgen signaling is altered in BPH remains unclear. To determine androgen signaling in BPH, we characterized the expression of 4 different androgen-responsive genes, Eaf2/U19, ELL2, FKBP5, and PSA, in BPH and adjacent normal glandular epithelial cells.
METHODS
A set of 17 BPH specimens were from patients over 60 years of age with clinical symptoms of BPH. Laser-capture microdissection (LCM) was used to isolate glandular epithelial cells from BPH areas and adjacent normal areas, separately. LCM isolated cells from individual specimens were lysed and RNA isolation, reverse transcription, and real-time PCR were performed using CellsDirect™ One-Step qRT-PCR Kit (Invitrogen, Carlsbad, CA).
RESULTS
All of the assayed genes displayed increased expression from ~2-fold to ~6-fold, in BPH as compared to the adjacent normal epithelial cells. We also generated a composite androgen response index based on the expression levels of the 4 genes, which provides a reliable readout for overall androgen action. Our study showed that the composite androgen response index in BPH is ~4-fold as compared to that in the adjacent normal tissues.
CONCLUSIONS
Androgen signaling is significantly elevated in BPH relative to the adjacent normal prostate. Understanding the mechanisms causing elevated androgen signaling may lead to novel approaches for prevention and/or treatment of BPH.
Keywords: human, BPH, androgens, androgen-responsive genes
Introduction
Benign prostatic hyperplasia (BPH) contributes substantially to the disease burden in aging men. The prevalence of BPH increases linearly with age, from almost nil in the third decade of life to almost 100% in the ninth decade (1–3). While BPH is not synonymous with clinical disease, prostatic enlargement with underlying hyperplasia is a major determinant of lower urinary tract symptoms (LUTS) (2,4,5).
The socio-economic costs of BPH are tremendous. Three out of four men over the age of seventy will have some degree of LUTS, and more than half of these will have moderate to severe symptoms (3). The annual medical expenditure of BPH in the United States, including medical services and pharmaceuticals, is about $4 billion, ~twice that of prostate cancer (CaP) (6–8). Although BPH is almost never fatal, the morbidity of LUTS, and the potential complications due to BPH place a great burden on patients as well as the health care system (2,4,5,7).
BPH differs from prostate cancer in localization, clinical presentation, and management considerations, and is believed to have a different etiopathogenesis. Yet both are strongly associated with aging and androgens (2,9). BPH is a hyperplastic process (10), but despite having an increased number of glandular elements, these cells do not progress to CaP. Clearly, the multiplicative effect of aging and androgens need to be analyzed in the context of these very different disease responses.
One strategy to explore this would be to study the expression of various genes, particularly androgen-responsive genes. Although there are many studies examining gene expression patterns in prostate cancer, very few look at BPH epithelia. The few studies that have focused on the transciptome changes in both BPH as well as CaP have revealed varied and interesting patterns of gene expression. Differential expression of genes involved in cell regulation, signaling/transcription, and stromal composition have been reported (11–14). Differences in results may be due in part to tissue heterogeneity caused by mixing of normal and diseased cells, epithelial and stromal components, mixing of samples from different prostate zones, and sample pooling (11,12,14). The slow-growing nature of BPH implies the likelihood that modest transcriptome changes may be important in the primary pathology of this disease (14). These changes may be difficult to detect in the analysis of heterogeneous samples mentioned above.
As mentioned previously, androgens and aging play essential roles in the development of BPH and CaP. Men who are castrated before puberty do not develop BPH or CaP (15). Androgens are required for growth, development, and differentiation of the prostate, and the continued presence of androgens through aging is necessary for the development of both BPH and CaP (15,16). Therefore, the androgen signal signature, especially when viewed from a long term perspective, may provide important clues regarding the pathogenesis of BPH. Data on androgen signaling in BPH are limited and the role of androgen signaling in BPH pathogenesis remains unclear. The expression of the androgen receptor has been reported to be both increased and decreased in BPH cells (14,16). These differences could be due, in part, to the selection and measurement biases outlined above. Additionally, there is a paucity of data in clinical specimens which explore androgen response gene expression in BPH and contrast it to that in normal adjacent tissue.
This study was designed to examine potential differential androgen-responsive gene expression in BPH as compared to adjacent normal tissue and to establish reproducible gene expression data. The genes investigated in our study were the androgen receptor (AR) and 4 androgen-responsive genes, consisting of prostate specific antigen (PSA), FKBP5, Eleven-nineteen lysine-rich leukemia gene 2 (ELL2), and up-regulated gene 19/ELL-associated factor 2 (U19/EAF2). PSA is a secretory gene widely used as a tool for diagnosis, prognostication, and follow up for prostate cancer (17,18). FKBP5 is an immunophilin with reported functions in cellular trafficking of steroid-hormone receptors (19,20). ELL2 is a member of ELL family proteins and could function as an RNA polymerase II elongation factor, is also regulated by androgens in the prostate (21,22). U19/EAF2 is a positive regulator of the RNA polymerase II elongation activity of ELL proteins and has been shown to have tumor suppressive activities in vitro and in vivo (23–26). Characterizing the expression of these genes will provide insights into possible alterations in androgen action in these prostatic diseases. We restricted our studies to tissue samples which correlated with clinical significance by including BPH samples only from patients over 60 years of age with clinical symptoms of LUTS and who also underwent prostatectomy because of BPH. Using laser-capture microdissection and quantitative RT-PCR, we compared the expression levels of AR and the above mentioned 4 androgen-responsive genes in BPH epithelial cells with that in the adjacent normal epithelial cells.
Materials and Methods
Tissue acquisition and laser-capture microdissection
Human BPH specimens were obtained from the Health Sciences Tissue Bank at the University of Pittsburgh Medical Center under approval by the UPMC Institutional Review Board following a standard protocol. All the specimens were from patients over 60 years of age with clinical symptoms of BPH and who also underwent prostatectomy because of BPH. No incidental foci of carcinoma were present in this cohort. Prostate specimens were embedded in Tissue Tek OCT (Sakura Finetek U.S.A, Torrance, CA) and stored at −80°C until sections were cut at 8μm. Sections were mounted on PEN membrane slides (Leica Microsystems, Wetzlar, Germany). Serial specimens were histologically reviewed by a pathologist to identify specific pathological areas. Tissue sections were fixed in 70% EtOH for 30 seconds and rinsed with double distilled H2O. Sections were stained with Mayer’s Hematoxylin (Sigma-Aldrich, St. Louis, MO) for 30 seconds, rinsed with double distilled H2O and placed in 0.01% Eosin (Acros Organics, Geel, Belgium) for 5 seconds. Prostate specimens were dehydrated for 30 seconds twice in 95% ethanol, 30 seconds in 100% ethanol, and 2 minutes in Xylenes. The tissue was air-dried and LCM was performed using the Leica LMD6000 (Leica Microsystems, Wetzlar, Germany). Approximately 2000–5000 excised cells were captured into 0.5ml Eppendorf tube caps.
RNA isolation and real-time PCR analysis
Captured individual tissue specimens were lysed and RNA isolation, reverse transcription, and real-time PCR were performed using CellsDirect™ One-Step qRT-PCR Kit (Invitrogen, Carlsbad, CA). Gene-specific primers and Taqman probes cross exon/exon junctions and were designed with Primer 3 Software (27) (Primer3, Totowa, NJ) (Table 1). Probes contained FAM fluorophore and TAMRA quencher. TBP was purchased from Applied Biosystems (Foster City, CA). The primer and probe combination were optimized within suitable ranges for efficiency and correlation coefficient using standard curve dilutions and data output on the ABI Step-One Plus thermocycler (Applied Biosystems, Foster City, CA). We also performed Taqman real-time PCR and showed that all of the primers used in our study only amplified cDNA and not genomic DNA. The reactions were analyzed in triplicate and normalized to GAPDH. All oligos were tested to ensure genomic DNA was not amplified. Real-time PCR was performed on a Bio-Rad IQ5 (Bio-Rad Laboratories, Hercules, CA) or ABI Step-One Plus (Applied Biosystems, Foster City, CA). Real-time PCR data were analyzed by ΔCp (crossing point) method as R=2[Cp sample −Cp control] (28) to generate the relative expression ratio (R) of each target gene relative to GAPDH. We typically used 2000–5000 isolated glandular epithelial cells per sample in the real-time qPCR assays (Fig 1). However, we were able to perform reverse transcription and qPCR from as few as 300 isolated cells. All of our primer-probe combinations showed efficiencies of greater than 90% (Table 1).
Table 1.
Forward (For) and reverse (Rev) primers and corresponding probes in real-time PCR assays for indicated human gene expression in BPH specimens. TBP was purchased from ABI (Foster City, CA) and its sequence is proprietary and not included in the table. The specificity of the primer-probe combinations was confirmed by running parallel reactions with human genomic DNA, which did not amplify. The amplification efficiency of each primer pair was also indicated.
| Gene | Primer/Probe | Efficiency |
|---|---|---|
| AR |
For 5′-AAG CTG CAA GGT CTT CTT CAA-3′ Rev 5′-TCC TTC GGA ATT TAT CAA TAG TGC-3′ Probe 5′-6FAM AAC AGA AGT ACC TGT GCG CCA GCA TAMRA-3′ |
99% |
| U19/Eaf2 |
For 5′-CCA GGA CTC CCA ATC TTG TAA A-3′ Rev 5′-TAG CTT CTG CCT TCA GTT CTC TT-3′ Probe 5′-6FAM CTC CAT CTG AAG ATA AGA TGT CCC CAG CA TAMRA-3′ |
99% |
| ELL2 |
For 5′- TGA CTG CAT CCA GCA AAC AT-3′ Rev 5′-TCG TTT GTT GCA CAC ACT GTA A-3′ Probe 5′-6FAM TCT CCA GCT CTG GAG CCT CCC A TAMRA-3′ |
92% |
| FKBP5 |
For 5′-AAA TCC AAA CGA AGG AGC AA-3′ Rev 5′-GCC ACA TCT CTG CAG TCA AA-3′ Probe 5′-6FAM AGT AGA AAT CCA CCT GGA AGG CCG CT TAMRA-3′ |
99% |
| PSA |
For 5′-CAT CAG GAA CAA AAG CGT GA-3′ Rev 5′-AGC TGT GGC TGA CCT GAA AT-3′ Probe 5′-6FAM CAC AGC CTG TTT CAT CCT GAA GAC ACA TAMRA-3′ |
104% |
| GAPDH |
For 5′-CAT GTT CGT CAT GGG TGT GA-3′ Rev 5′-GGT GCT AAG CAG TTG GTG GT-3′ Probe 5′-6FAM ACA GCC TCA AGA TCA TCA GCA ATG CCT C TAMRA-3′ |
96% |
Fig 1.

A. An H&E stained BPH (left) and its serial section after laser capture microdissection (LCM) (right). The arrow displays an area of a BPH epithelial nodule dissected for RT-qPCR. B. Representative real-time amplification of PSA (1), GAPDH (2), U19/EAF2 (3), and ELL2 (4) in LCM captured prostate epithelial cells. Epithelial cells were LCM dissected from fresh frozen human tissue.
Statistics were performed using Graphpad Software (Graphpad Software, La Jolla, CA) for paired student’s t test for means. Descriptive statistics were also generated by Graphpad Software.
Results
The expression of AR is elevated in BPH epithelial cells relative to the adjacent normal epithelial cells
According to literature, AR protein level in BPH specimens is about 47% higher than that the normal prostate tissues (16). To determine if AR expression in BPH epithelia is higher than that in the adjacent normal controls, we used LCM coupled with real-time RT-PCR. Fig. 2 shows that the expression of AR mRNA is about 1.9-fold relative to that in the adjacent normal control epithelial cells. The difference was not statistically significant, mainly due to large variations in different specimens. However, our finding is consistent with the result in the literature.
Fig 2.

Expression of androgen receptor (AR) in BPH and adjacent normal (Normal) glandular prostate epithelial cells. Prostate epithelia were laser-capture microdissected from fresh frozen prostate after briefly staining with H&E. RT-qPCR was performed and relative expression was analyzed as described in Material and Methods. The columns show the means; error bars represent S.E.M.; and n is number of specimens. The p values were calculated using the paired Student’s t-test.
The expression of androgen-responsive genes is elevated in BPH epithelial cells relative to the adjacent normal epithelial cells
Androgen action is mediated through AR, a ligand-dependent transcription factor that regulates the expression of androgen-responsive genes. Thus, the best readout for AR activity is the mRNA levels of androgen-responsive genes, particularly those that are up-regulated by androgens in the prostate. The genes that are down-regulated by androgens are not suitable in this study because their expression is very low or not detectable in intact prostate.
Our study tested the expression of 4 androgen-responsive genes, PSA, U19/Eaf2, ELL2, and FKBP5, in clinical BPH specimens resected from 17 different patients. Fig. 3 shows that the mRNA levels of PSA, U19/EAF2, ELL2, and FKBP5 were upregulated 5.4-fold (p=.01), 2.2-fold (p=.01), 6.0-fold (p=.05), and 3.4-fold (p=.05), respectively, in BPH epithelial cells relative to that in the adjacent normal epithelial cells. This result indicates that the expression of these androgen-responsive genes is elevated in BPH epithelial cells relative to the normal adjacent control.
Fig. 3.
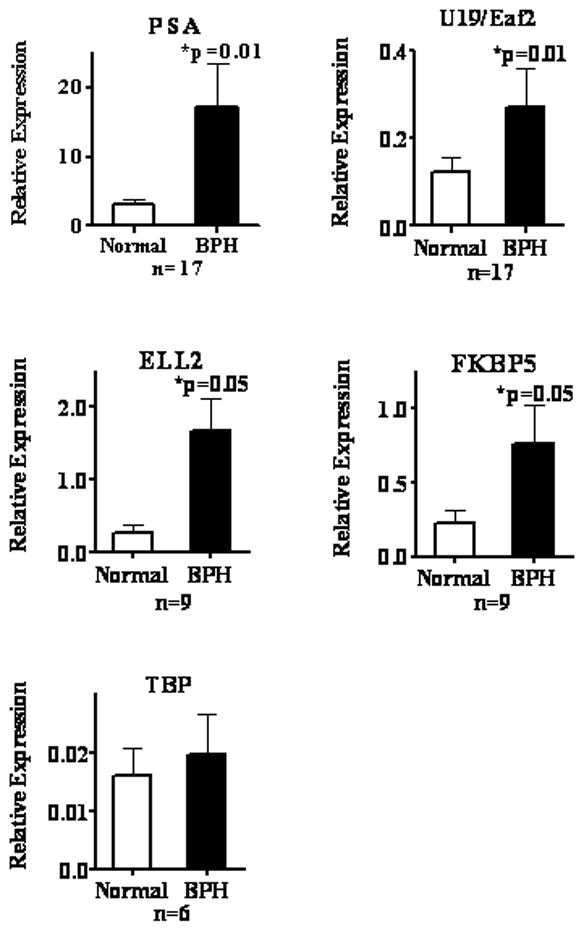
Expression of indicated genes in BPH and normal (Normal) areas adjacent to BPH in the transitional zone of human prostate. U19/Eaf2, ELL2, FKBP5, and PSA are androgen-responsive genes. TATA-box binding protein (TBP) is a housekeeping gene used as a control. The expression of each gene relative to GAPDH (Relative Expression) was determined as described in Material and Methods. The columns show the means; error bars represent S.E.M.; and n is number of specimens. The p values were calculated using the paired Student’s t-test.
TATA box binding protein (TBP) was used as a control for global changes and does not show transcription level changes. Our findings suggest that the expression of other androgen-responsive genes in BPH epithelial cells should also be elevated relative to the adjacent normal control.
Composite androgen-responsive index provides a readout for overall androgen signaling
The use of an individual androgen-responsive gene as readout may not be an optimal indicator of overall androgen signaling. There were significant variations in the expression of individual androgen-responsive genes in different specimens. To provide a better description of overall androgen response in the prostate, we decided to develop a way to include all 4 androgen response gene expression data collected in this study into a composite androgen-responsive index of multiple androgen-responsive genes. The composite androgen response index should be a more accurate readout for overall androgen response than a single androgen-responsive gene and mitigate the large variation in some androgen response genes. In our studies, the composite androgen index was determined by taking the sum of the normalized levels of 4 different androgen-responsive genes and divided that by 4 (Fig. 4A). The following is the formula used in the calculation:
where N is the number of androgen-response genes used in the calculation. Since we used 4 different androgen-responsive genes in the present study, the N was 4 in Fig. 4A. Normalized relative expression of a gene is a value of relative expression of the gene divided by the mean of relative expression of that gene in the normal areas adjacent to BPH.
Fig. 4.

A. Composite androgen-response index (Androgen Signal; see text for definition) in BPH and adjacent normal (Normal) epithelial cells. The columns show the means; error bars represent S.E.M.; and n is number of specimens. The p value was calculated using the paired Student’s t-test. B. Fold of androgen signaling up-regulation in BPH relative to adjacent normal areas. Four different androgen-responsive genes, ELL2 (6.0-fold), PSA (5.4-fold), FKBP5 (3.4-fold) and U19/Eaf2 (2.2-fold), were analyzed. The fold of up-regulation in composite androgen-response indexes was calculated using 1, 2, 3, or 4 genes in all possible combinations. C. Coefficient of Variation (%) of composite androgen-response indexes calculated using 1, 2, 3, or 4 genes in all possible combinations in both BPH and adjacent normal samples.
The composite androgen-response index minimizes the variability associated with using individual androgen-response genes as the readout (Fig. 4B). The ratio of the composite index in BPH relative to the normal adjacent is expected to remain ~4-fold as seen in the composite androgen index, when additional androgen-responsive genes are included. As expected, the coefficient of variation decreased when more genes were used in the composite index calculation (Fig. 4C). When 4 genes were used, the coefficients of variation were 0.433 and 0.505 for BPH and adjacent normal cells, respectively. Thus, the composite androgen-response index provides an acurate and sensitive readout for overall androgen response in human prostate specimens.
Discussion
This study reports the finding that all of the assayed 4 androgen-responsive genes, PSA, FKBP5 U19/Eaf2, and ELL2, displayed elevated (2- to 6-fold) expression in BPH cells relative to the adjacent normal epithelial cells in clinical specimens. PSA and FKBP5 are two well characterized androgen-responsive genes abundantly expressed in the prostate (17,19,20). U19/Eaf2 is a newly discovered tumor suppressor that regulates prostate growth (23,25,26). ELL2 is a binding partner of U19/Eaf2 (21,23). These 4 genes consist of very different primary sequences and are expressed at different levels. One thing in common for these genes is that they are all up-regulated by androgens in the prostate. Since many other androgen-responsive genes are regulated by AR similarly, it is likely that most androgen-responsive genes would have similar up-regulation in BPH cells. Thus, characterization of these 4 different genes should provide insights into the overall androgen response in BPH pathogenesis.
Using a single androgen-responsive gene as readout is associated with high variations in its expression levels in different specimens and may not reflect the overall androgen response adequately. Thus, we utilized a composite index of normalized expression of the 4 different androgen-responsive genes, which we have termed the “composite androgen response index”, as the readout for androgen response. A major advantage of using the composite androgen response index is that the variation of the composite index is much smaller than using any individual androgen-responsive gene as readout, which will allow the use of a smaller sample size to achieve statistically significant results in future studies. Also, the composite index is more representative of the overall androgen response than any individual androgen-responsive genes.
We recognize that many factors could affect the expression of androgen-regulated genes without crosstalk with the AR in the prostate. However, AR remains the dominant factor regulating the expression of prostatic androgen-responsive genes. It is well established that the expression of androgen-responsive genes requires active AR and that their expression levels are dramatically down-regulated when the AR is inactive under castration conditions (19,29,30). Thus, the expression levels of androgen-responsive genes reflect AR activity in the prostate and, therefore, can serve as a reliable readout for androgen response.
It is well established that stromal-epithelial interaction plays a key role in androgen action in the prostate (31,32). However, the stromal androgen action is difficult to assess because very few stromal androgen-responsive genes have been reported. Androgen regulation of these potential stromal androgen-responsive genes in vivo is not clear. For example, Nemeth and colleagues showed that the expression of KGF in vivo is not greatly influenced by androgen manipulation (33). Without reliable readout for stromal androgen action, it is difficult to assess whether stromal androgen action is altered in BPH development.
Our results are in agreement with findings reported in the literature. Irer et al reported that androgen-responsive gene Nkx3.1 expression is increased in both mRNA and protein levels in BPH as compared to the non-BPH tissues (34). Also, ornithine decarboxylase activity and its mRNA expression are increased in BPH tissues (35) and ODC expression in the prostate is regulated by androgens (36). Our findings here and the data in the literature together strongly argue that androgen signaling is significantly elevated in BPH pathogenesis.
Alterations in androgen signaling in BPH appear to be very different from that in prostate cancer. Although androgens play important roles in the development and progression of both diseases, BPH tissues displayed a significant increase in the expression of androgen-responsive genes. In contrast, prostate cancer specimens exhibited down-regulation of androgen-responsive genes, including U19/Eaf2 (26), NKX3.1 (37), PMEPA1 (38) and many other androgen-responsive genes (39). Given that many of the androgen-responsive genes are tumor suppressive, down-regulation of tumor suppressive androgen-responsive genes may be an essential step leading to prostate cancer progression. In contrast, elevated expression of tumor suppressive androgen-responsive genes may be in part responsible for keeping BPH from becoming malignant. Difference in androgen-responsive gene expression between BPH and prostate cancer would represent a fundamental difference between these two common diseases.
The 4-fold up-regulation in the composite index of the expression of androgen-responsive genes in BPH is significant and likely to have functional impact on BPH pathogenesis. Thus, understanding the mechanism by which the androgen signaling is elevated in BPH glandular epithelial cells will have significant implications in BPH prevention and the treatment. One possible mechanism causing the elevated expression of androgen-responsive genes in BPH may involve inflammatory cytokines which are intimately associated with BPH and are known to enhance androgen signaling both in cultured cells and in animal models (40–50). Another possible mechanism may involve the enhanced expression of 5α-reductase II (SRDA5) in BPH specimens (51). The elevated expression of SRDA5 may increase DHT levels in BPH areas relative to the normal adjacent tissues and lead to elevated expression of androgen-responsive genes. Both inflammation and elevated SRDA5 expression may contribute to the increased composite androgen response index in BPH cells. Clinical studies will be needed to determine the importance of inflammation, SRDA5, and other factors in the elevated expression of androgen-responsive genes in BPH.
In summary, our studies showed that the composite androgen-response index of 4 different androgen-responsive genes is elevated ~4-fold in BPH relative to adjacent normal tissues. This dramatic increase in androgen signaling is likely to play a key role in BPH development and progression. Elucidating the mechanisms responsible for the elevated androgen signaling in BPH may lead to new approaches of BPH prevention and treatment.
Acknowledgments
This investigation was supported in part by NIH grants R37 DK51993, R01 CA 120386, and 5P20 CA103730. We thank Shubham Gupta and Marie Acquafondata for excellent technical assistance. We thank all the members of Wang Lab for helpful discussion.
References
- 1.Roherborn CGaM JD. Campbell-Walsh Urology. Vol. 9. Philadelphia: Saunders Elsevier; 2007. Benign Prostatic Hyperplasia: Etiology, Pathophysiology, Epidemiology, and Natural History. [Google Scholar]
- 2.Lee C, Kozlowski JM, Grayhack JT. Etiology of benign prostatic hyperplasia. Urol Clin North Am. 1995;22(2):237–246. [PubMed] [Google Scholar]
- 3.Berry S, Coffey D, Walsh P, Ewing L. The development of human benign prostatic hyperplasia with age. Journal of Urology. 1984;132(3):474–479. doi: 10.1016/s0022-5347(17)49698-4. [DOI] [PubMed] [Google Scholar]
- 4.Greco KA, McVary KT. The role of combination medical therapy in benign prostatic hyperplasia. Int J Impot Res. 2008;20 (Suppl 3):S33–43. doi: 10.1038/ijir.2008.51. [DOI] [PubMed] [Google Scholar]
- 5.McVary KT. BPH: epidemiology and comorbidities. Am J Manag Care. 2006;12(5 Suppl):S122–128. [PubMed] [Google Scholar]
- 6.Weis KA, Epstein RS, Huse DM, Deverka PA, Oster G. The costs of prostatectomy for benign prostatic hyperplasia. Prostate. 1993;22(4):325–334. doi: 10.1002/pros.2990220407. [DOI] [PubMed] [Google Scholar]
- 7.Kortt MA, Bootman JL. The economics of benign prostatic hyperplasia treatment: a literature review. Clin Ther. 1996;18(6):1227–1241. doi: 10.1016/s0149-2918(96)80078-6. [DOI] [PubMed] [Google Scholar]
- 8.Penson DF, Chan JM. Prostate cancer. J Urol. 2007;177(6):2020–2029. doi: 10.1016/j.juro.2007.01.121. [DOI] [PubMed] [Google Scholar]
- 9.Isaacs JT, Coffey DS. Etiology and disease process of benign prostatic hyperplasia. Prostate Suppl. 1989;2:33–50. doi: 10.1002/pros.2990150506. [DOI] [PubMed] [Google Scholar]
- 10.McNeal J. Pathology of benign prostatic hyperplasia. Insight into etiology. Urol Clin North Am. 1990;17(3):477–486. [PubMed] [Google Scholar]
- 11.Fromont G, Chene L, Latil A, Bieche I, Vidaud M, Vallancien G, Mangin P, Fournier G, Validire P, Cussenot O. Molecular profiling of benign prostatic hyperplasia using a large scale real-time reverse transcriptase-polymerase chain reaction approach. J Urol. 2004;172(4 Pt 1):1382–1385. doi: 10.1097/01.ju.0000137819.92305.46. [DOI] [PubMed] [Google Scholar]
- 12.Luo J, Dunn T, Ewing C, Sauvageot J, Chen Y, Trent J, Isaacs W. Gene expression signature of benign prostatic hyperplasia revealed by cDNA microarray analysis. Prostate. 2002;51(3):189–200. doi: 10.1002/pros.10087. [DOI] [PubMed] [Google Scholar]
- 13.Cazares LH, Adam BL, Ward MD, Nasim S, Schellhammer PF, Semmes OJ, Wright GL., Jr Normal, benign, preneoplastic, and malignant prostate cells have distinct protein expression profiles resolved by surface enhanced laser desorption/ionization mass spectrometry. Clin Cancer Res. 2002;8(8):2541–2552. [PubMed] [Google Scholar]
- 14.Bauman DR, Steckelbroeck S, Peehl DM, Penning TM. Transcript profiling of the androgen signal in normal prostate, benign prostatic hyperplasia, and prostate cancer. Endocrinology. 2006;147(12):5806–5816. doi: 10.1210/en.2006-0627. [DOI] [PubMed] [Google Scholar]
- 15.Marcelli M, Cunningham GR. Hormonal signaling in prostatic hyperplasia and neoplasia. J Clin Endocrinol Metab. 1999;84(10):3463–3468. doi: 10.1210/jcem.84.10.6083. [DOI] [PubMed] [Google Scholar]
- 16.Coffey DS, Walsh PC. Clinical and experimental studies of benign prostatic hyperplasia. Urol Clin North Am. 1990;17(3):461–475. [PubMed] [Google Scholar]
- 17.Kim J, Coetzee GA. Prostate specific antigen gene regulation by androgen receptor. J Cell Biochem. 2004;93(2):233–241. doi: 10.1002/jcb.20228. [DOI] [PubMed] [Google Scholar]
- 18.Loeb S, Catalona WJ. Prostate-specific antigen in clinical practice. Cancer Lett. 2007;249(1):30–39. doi: 10.1016/j.canlet.2006.12.022. [DOI] [PubMed] [Google Scholar]
- 19.Clegg N, Eroglu B, Ferguson C, Arnold H, Moorman A, Nelson PS. Digital expression profiles of the prostate androgen-response program. J Steroid Biochem Mol Biol. 2002;80(1):13–23. doi: 10.1016/s0960-0760(01)00167-4. [DOI] [PubMed] [Google Scholar]
- 20.Magee JA, Chang LW, Stormo GD, Milbrandt J. Direct, androgen receptor-mediated regulation of the FKBP5 gene via a distal enhancer element. Endocrinology. 2006;147(1):590–598. doi: 10.1210/en.2005-1001. [DOI] [PubMed] [Google Scholar]
- 21.Shilatifard A, Duan DR, Haque D, Florence C, Schubach WH, Conaway JW, Conaway RC. ELL2, a new member of an ELL family of RNA polymerase II elongation factors. Proc Natl Acad Sci U S A. 1997;94(8):3639–3643. doi: 10.1073/pnas.94.8.3639. [DOI] [PMC free article] [PubMed] [Google Scholar]
- 22.Bolton EC, So AY, Chaivorapol C, Haqq CM, Li H, Yamamoto KR. Cell- and gene-specific regulation of primary target genes by the androgen receptor. Genes Dev. 2007;21(16):2005–2017. doi: 10.1101/gad.1564207. [DOI] [PMC free article] [PubMed] [Google Scholar]
- 23.Simone F, Luo RT, Polak PE, Kaberlein JJ, Thirman MJ. ELL-associated factor 2 (EAF2), a functional homolog of EAF1 with alternative ELL binding properties. Blood. 2003;101(6):2355–2362. doi: 10.1182/blood-2002-06-1664. [DOI] [PubMed] [Google Scholar]
- 24.Kong SE, Banks CA, Shilatifard A, Conaway JW, Conaway RC. ELL-associated factors 1 and 2 are positive regulators of RNA polymerase II elongation factor ELL. Proc Natl Acad Sci U S A. 2005;102(29):10094–10098. doi: 10.1073/pnas.0503017102. [DOI] [PMC free article] [PubMed] [Google Scholar]
- 25.Xiao W, Jiang F, Wang Z. ELL binding regulates U19/Eaf2 intracellular localization, stability, and transactivation. Prostate. 2006;66(1):1–12. doi: 10.1002/pros.20309. [DOI] [PubMed] [Google Scholar]
- 26.Xiao W, Zhang Q, Jiang F, Pins M, Kozlowski JM, Wang Z. Suppression of prostate tumor growth by U19, a novel testosterone-regulated apoptosis inducer. Cancer Res. 2003;63(15):4698–4704. [PubMed] [Google Scholar]
- 27.Rozen S, Skaletsky H. Bioinformatics Methods and Protocols: Methods in Molecular Biology. Vol. 2000. Totowa: Humana Press; Primer3. 2000. p Primer3 on WWW for general users and for biologist programmers. [DOI] [PubMed] [Google Scholar]
- 28.Livak K. ABI Prism 7700 Sequence Detection System User Bulletin #2 Relative quantification of gene expression. ABI company publication; 1997&2001. [Google Scholar]
- 29.Wang Z, Tufts R, Haleem R, Cai X. Genes regulated by androgen in the rat ventral prostate. Proc Natl Acad Sci USA. 1997;94:12999–13004. doi: 10.1073/pnas.94.24.12999. [DOI] [PMC free article] [PubMed] [Google Scholar]
- 30.Jiang F, Wang Z. Identification of androgen-responsive genes in the rat ventral prostate by complementary deoxyribonucleic acid subtraction and microarray. Endocrinology. 2003;144(4):1257–1265. doi: 10.1210/en.2002-220718. [DOI] [PubMed] [Google Scholar]
- 31.Cunha G. Androgenic effects upon prostatic epithelium are mediated via trophic influences from stroma [Review] Progress in Clinical & Biological Research. 1984;145:81–102. [PubMed] [Google Scholar]
- 32.Cunha GR, Chung LW, Shannon JM, Reese BA. Stromal-epithelial interactions in sex differentiation. Biology of Reproduction. 1980;22(1):19–42. doi: 10.1095/biolreprod22.1.19. [DOI] [PubMed] [Google Scholar]
- 33.Nemeth JA, Zelner DJ, Lang S, Lee C. Keratinocyte growth factor in the rat ventral prostate: androgen-independent expression. J Endocrinol. 1998;156(1):115–125. doi: 10.1677/joe.0.1560115. [DOI] [PubMed] [Google Scholar]
- 34.Irer B, Toylu A, Aslan G, Celebi I, Yorukoglu K, Atabey N. Increased expression of NKX3.1 in benign prostatic hyperplasia. Urology. 2009;73(5):1140–1144. doi: 10.1016/j.urology.2008.02.039. [DOI] [PubMed] [Google Scholar]
- 35.Liu X, Wang L, Lin Y, Teng Q, Zhao C, Hu H, Chi W. Ornithine decarboxylase activity and its gene expression are increased in benign hyperplastic prostate. Prostate. 2000;43(2):83–87. doi: 10.1002/(sici)1097-0045(20000501)43:2<83::aid-pros2>3.0.co;2-o. [DOI] [PubMed] [Google Scholar]
- 36.Cyriac J, Haleem R, Cai X, Wang Z. Androgen regulation of spermidine synthase expression in the rat prostate. Prostate. 2002;50(4):252–261. doi: 10.1002/pros.10052. [DOI] [PubMed] [Google Scholar]
- 37.Bowen C, Bubendorf L, Voeller HJ, Slack R, Willi N, Sauter G, Gasser TC, Koivisto P, Lack EE, Kononen J, Kallioniemi OP, Gelmann EP. Loss of NKX3.1 expression in human prostate cancers correlates with tumor progression. Cancer Res. 2000;60(21):6111–6115. [PubMed] [Google Scholar]
- 38.Xu LL, Shi Y, Petrovics G, Sun C, Makarem M, Zhang W, Sesterhenn IA, McLeod DG, Sun L, Moul JW, Srivastava S. PMEPA1, an androgen-regulated NEDD4-binding protein, exhibits cell growth inhibitory function and decreased expression during prostate cancer progression. Cancer Res. 2003;63(15):4299–4304. [PubMed] [Google Scholar]
- 39.Tomlins SA, Mehra R, Rhodes DR, Cao X, Wang L, Dhanasekaran SM, Kalyana-Sundaram S, Wei JT, Rubin MA, Pienta KJ, Shah RB, Chinnaiyan AM. Integrative molecular concept modeling of prostate cancer progression. Nat Genet. 2007;39(1):41–51. doi: 10.1038/ng1935. [DOI] [PubMed] [Google Scholar]
- 40.Culig Z. Androgen receptor cross-talk with cell signalling pathways. Growth Factors. 2004;22(3):179–184. doi: 10.1080/08977190412331279908. [DOI] [PubMed] [Google Scholar]
- 41.Culig Z, Hobisch A, Cronauer MV, Radmayr C, Trapman J, Hittmair A, Bartsch G, Klocker H. Androgen receptor activation in prostatic tumor cell lines by insulin-like growth factor-I, keratinocyte growth factor, and epidermal growth factor. Cancer Res. 1994;54(20):5474–5478. [PubMed] [Google Scholar]
- 42.Debes JD, Schmidt LJ, Huang H, Tindall DJ. p300 mediates androgen-independent transactivation of the androgen receptor by interleukin 6. Cancer Res. 2002;62(20):5632–5636. [PubMed] [Google Scholar]
- 43.Ueda T, Mawji NR, Bruchovsky N, Sadar MD. Ligand-independent activation of the androgen receptor by interleukin-6 and the role of steroid receptor coactivator-1 in prostate cancer cells. J Biol Chem. 2002;277(41):38087–38094. doi: 10.1074/jbc.M203313200. [DOI] [PubMed] [Google Scholar]
- 44.Lee SO, Chun JY, Nadiminty N, Lou W, Gao AC. Interleukin-6 undergoes transition from growth inhibitor associated with neuroendocrine differentiation to stimulator accompanied by androgen receptor activation during LNCaP prostate cancer cell progression. Prostate. 2007;67(7):764–773. doi: 10.1002/pros.20553. [DOI] [PubMed] [Google Scholar]
- 45.Lee SO, Lou W, Hou M, de Miguel F, Gerber L, Gao AC. Interleukin-6 promotes androgen-independent growth in LNCaP human prostate cancer cells. Clin Cancer Res. 2003;9(1):370–376. [PubMed] [Google Scholar]
- 46.Lee SO, Pinder E, Chun JY, Lou W, Sun M, Gao AC. Interleukin-4 stimulates androgen-independent growth in LNCaP human prostate cancer cells. Prostate. 2008;68(1):85–91. doi: 10.1002/pros.20691. [DOI] [PubMed] [Google Scholar]
- 47.Lee LF, Louie MC, Desai SJ, Yang J, Chen HW, Evans CP, Kung HJ. Interleukin-8 confers androgen-independent growth and migration of LNCaP: differential effects of tyrosine kinases Src and FAK. Oncogene. 2004;23(12):2197–2205. doi: 10.1038/sj.onc.1207344. [DOI] [PubMed] [Google Scholar]
- 48.Hayes SA, Zarnegar M, Sharma M, Yang F, Peehl DM, ten Dijke P, Sun Z. SMAD3 represses androgen receptor-mediated transcription. Cancer Res. 2001;61(5):2112–2118. [PubMed] [Google Scholar]
- 49.Kang HY, Lin HK, Hu YC, Yeh S, Huang KE, Chang C. From transforming growth factor-beta signaling to androgen action: identification of Smad3 as an androgen receptor coregulator in prostate cancer cells. Proc Natl Acad Sci U S A. 2001;98(6):3018–3023. doi: 10.1073/pnas.061305498. [DOI] [PMC free article] [PubMed] [Google Scholar]
- 50.Jin RJ, Lho Y, Connelly L, Wang Y, Yu X, Saint Jean L, Case TC, Ellwood-Yen K, Sawyers CL, Bhowmick NA, Blackwell TS, Yull FE, Matusik RJ. The nuclear factor-kappaB pathway controls the progression of prostate cancer to androgen-independent growth. Cancer Res. 2008;68(16):6762–6769. doi: 10.1158/0008-5472.CAN-08-0107. [DOI] [PMC free article] [PubMed] [Google Scholar]
- 51.Luo J, Dunn TA, Ewing CM, Walsh PC, Isaacs WB. Decreased gene expression of steroid 5 alpha-reductase 2 in human prostate cancer: implications for finasteride therapy of prostate carcinoma. Prostate. 2003;57(2):134–139. doi: 10.1002/pros.10284. [DOI] [PubMed] [Google Scholar]