

Abstract
Common diseases with a genetic basis are likely to have a very complex etiology, in which the mapping between genotype and phenotype is far from straightforward. A new comprehensive statistical and computational strategy for identifying the missing link between genotype and phenotype has been proposed, which emphasizes the need to address heterogeneity in the first stage of any analysis and gene-gene interactions in the second stage. We applied this two-stage analysis strategy to late-onset Alzheimer disease (LOAD) data, which included functional and positional candidate genes and markers in a region of interest on chromosome 10. Bayesian Classification found statistically significant clusterings for independent family-based and case-control datasets, which used the same five markers in LRRTM3 as the most influential in determining cluster assignment. In subsequent analyses to detect main effects and gene-gene interactions, markers in three genes—PLAU, ACE and CDC2—were found to be associated with late-onset Alzheimer disease in particular subsets of the data based on their LRRTM3 multilocus genotype. All of these genes are viable candidates for LOAD based on their known biological function, even though PLAU, CDC2 and LRRTM3 were initially identified as positional candidates. Further studies are needed to replicate these statistical findings and to elucidate possible biological interaction mechanisms between LRRTM3 and these genes.
Keywords: Alzheimer Disease, complex disease, statistical genetics, heterogeneity, gene-gene interaction, epistasis, linkage, association, multifactor dimensionality reduction, logistic regression, clustering, Bayesian classification
Introduction
Alzheimer’s disease (AD; MIM: 104300) is a neurodegenerative disorder characterized clinically by a decline in two or more areas of cognition, one of which is usually episodic memory, in the absence of acute causes (Pericak-Vance MA and Haines JL, 2002). Presenting symptoms range from memory impairment to visuospatial disorientation, language impairment, depression and psychotic episodes. AD is defined pathologically by the presence of two abnormalities in the cerebral cortex. The first is senile plaques that have an amyloid beta (Aβ) protein core, and the second is neurofibrillary tangles, which contain the microtubule-associated protein tau (Goedert M, 1999; Wisniewski T et al., 1993). It remains controversial whether the plaques and tangles are themselves pathogenic or whether they are merely “tombstones” of other pathogenic processes (Glabe C, 2000). Only a weak link between plaque load and severity of illness has been found, while the load of neurofibrillary tangles might be more strongly correlated with severity (Guillozet AL et al., 2003; Mufson EJ et al., 1999). Also, both plaques and tangles have been found in normal older adults, leading many to suggest that these abnormalities are secondary effects arising from the true pathological mechanisms underlying AD.
In addition, Lewy bodies, which contain fibrils of aggregated, insoluble alpha-synuclein (McKeith I et al., 2004), have been observed in up to 20% of AD cases in the substantia nigra (which is characteristic of PD) and elsewhere in the brain (Ditter SM and Mirra SS, 1987; Growden JH, 1995; McKeith IG et al., 1996). A growing body of literature suggests substantial overlap among AD, dementia with Lewy bodies, and Parkinson Disease (Metzler-Baddeley C, 2007; Meyer JS et al., 2007). It is possible that the developments of Aβ plaques, neurofibrillary tangles and Lewy bodies have common physiological pathways. However, it is also possible each one of these features is a distinct trait, suggesting that AD is a heterogeneous trait better defined as the coincident state of having both plaques and tangles. Likewise, AD with PD could then be better described as the concomitance of the three traits for plaques, tangles and Lewy bodies. To the extent that each of these traits is likely to have its own distinct genetic etiology, trait heterogeneity can be manifest statistically in a way similar to genetic heterogeneity.
While AD can occur as early as the third decade of life (Cruts M et al., 1995), it most commonly occurs after the sixth decade. The age of onset for late-onset Alzheimer disease (LOAD) is generally defined to be after age 60 or 65 but extends into the ninth decade. The only confirmed gene conferring risk for LOAD is apolipoprotein E (APOE). It is estimated that at least fifty percent of the genetic effect of LOAD remains unexplained (Daw EW et al., 2000; Roses AD et al., 1995; Slooter AJC et al., 1998). Over 115 LOAD candidate genes have been tested and have generated a positive main effect, but all except APOE have failed to be consistently replicated (Bertram L et al., 2007a). While the initial reports might have been false positive findings, alternatively, these inconsistencies could be indicative of heterogeneity and/or environmental interactions across the entire phenotype. Reported differences of incidence and prevalence between ethnic and gender groups are also indicative of interactions with environment and/or genetic background. The possibility of gene-gene interactions has been explored only superficially and most recently (Bagli M et al., 2000; Martin ER et al., 2005; Mateo I et al., 2006).
Late Onset Alzheimer Disease is just one example of a complex disease, in which traditional statistical methods of analysis such as linkage and association have failed to identify main effect genes. Among the possible reasons for this failure are false positives due to population stratification and true differences in genetic etiology between study populations (Hirschhorn JN et al., 2002). In addition, while a small number of supervised computational methods exist for discovering gene-gene interactions, the power of these methods drops dramatically when locus or trait heterogeneity is present (Ritchie MD et al., 2003). There is extensive evidence that heterogeneity exists in LOAD, within and between positional candidate regions (Liang X et al., 2007a; Lin PI et al., 2006b; Olson JM et al., 2002). Current statistical approaches for detecting genetic heterogeneity, such as the admixture test (Ott J and Hoh J, 2003; Smith CAB, 1963), are neither sensitive nor powerful and can merely account for, not resolve, any underlying heterogeneity.
It is possible that phenotypic data could be utilized to improve the performance of these methods in the face of genetic or trait heterogeneity by facilitating heuristic stratification of data. For instance, age of onset data was used to stratify AD patients, leading to the detection of association with the apolipoprotein ε4 allele in late-onset and sporadic cases (Corder EH et al., 1993; Saunders AM et al., 1993; Strittmatter WJ et al., 1993). However, for most diseases, particularly neurological diseases, little detailed phenotypic data has been consistently collected in combination with genotypic data. Postmortem histological data are rare for cases, even rarer for controls, and neuroimaging can be expensive and challenging with mentally ill patients. It is for these reasons that an unsupervised method, such as the Bayesian Classification cluster analysis method investigated elsewhere (Thornton-Wells TA et al., 2006) or the Grade of Membership latent class analysis approach (Corder EH and Beaumont H, 2007; Corder EH and Woodbury MA, 1993), which does not rely on phenotypic data, would be valuable to mine potentially heterogeneous genotypic data as a means of data stratification and hypothesis generation.
A comprehensive two-step approach to analysis has been proposed in which heterogeneity is first addressed and then main effects and interactions are subsequently investigated in the more homogeneous subsets discovered in the first stage (Thornton-Wells TA et al., 2004). Here we present an application of this two-stage approach to a LOAD dataset where cluster analysis is first used to uncover heterogeneity and to subdivide the data into more homogeneous groups. Then in the second stage, traditional linkage and association tests are used to detect main effects and a computational data reduction method is used to investigate gene–gene interactions within each of the subgroups.
Subjects and Methods
Specifics of Late-Onset Alzheimer Disease Dataset
The late-onset Alzheimer Disease dataset includes samples obtained by (1) the Collaborative Alzheimer Project (CAP) (Vanderbilt University, Duke University and UCLA), (2) the Indiana University (IU) Alzheimer Disease Center National Cell Repository, and (3) the National Institute of Mental Health (NIMH) Alzheimer Disease Genetics Initiative. Although the IU and NIMH samples represent a rich resource for generating hypotheses, they are used by multiple groups (including CAP). In contrast, the CAP-collected sample represents an independent set of families that can be used to confirm and extend initial findings. All subjects are Caucasian Americans. Written consent was obtained from all participants in agreement with protocols approved by the Institutional Review Board at each contributing institution. Alzheimer Disease was diagnosed according to the NINCDS-ADRDA criteria (McKhann G et al., 1984). Age of onset was recorded as the age at which the first symptoms were noted by the participant or family member. Only subjects with an age of onset of 65 or greater were included in this late-onset dataset.
From these three samples, two datasets were assembled—a family-based dataset and a case-control dataset. The family-based dataset, derived from all three ascertainment sources, consists of 654 families with 1422 subjects with possible, probable or definite LOAD and 744 cognitively normal elderly individuals. Of these families, 328 contain a total of 1279 discordant sibling pairs (DSPs), in which one sibling is affected with LOAD and the other is unaffected. The CAP dataset also includes a clinic-based unrelated case-control sample of 451 cases with possible, probable or definite LOAD and 699 cognitively normal elderly controls who were either spouses of AD patients or subjects recruited from outpatient clinics at the participating institutions.
Markers previously genotyped in over 25 positional or functional candidate genes and a region of interest (ROI) on chromosome 10 were initially included in the datasets, totally 185 markers. Markers with more than 10% missing data and subjects with more than 15% missing data were removed. The data were then processed to remove markers with more than 10 percent missing data and subjects with more than 15 percent missing data. This was an iterative process that resulted in a dataset with 148 markers in 22 genes on eight chromosomes—82 markers, covering 18 genes, that were common to both datasets. Thirteen of the 22 genes had the same markers genotyped in both the case-control and the family-based datasets. Of the remaining nine, GAPDH was only genotyped in the case-control dataset, and A2M, LRP1 and OLR1 were only genotyped in the family-based dataset. In addition, some genes had more markers genotyped in the case-control dataset (GAPDHS, UBQLN1) or the family-based dataset (ACE, LRRTM3, VR22). In results tables, when a marker is not present in one of the datasets, the appropriate cell is grayed out to indicate this. Many of these markers were chosen and genotyped prior to information about linkage disequilibrium was available from the HapMap Project (Gibbs RA et al., 2003), and in order to minimize loss of information, sometimes even when multiple markers were known to be in high LD, they were all genotyped.
Most of the functional candidate genes chosen are purported to have some role in LOAD through their involvement in the processing of amyloid precursor protein (APP; MIM: 104760), the secretion of its product, Aβ, and/or the phosphorylation of tau or regulation of microtubules within neurons. Table 1 lists alphabetically the 22 genes genotyped in one or both of the samples, along with their full names. Information about known function for these and other genes that have been reportedly associated with Alzheimer Disease can be found at ALZGENE.org.
Table 1.
Genes Covered by Markers Genotyped in One or Both Samples
| Symbol | Location | Name | OMIM ID | Gene ID |
|---|---|---|---|---|
| A2M | 12p13.3-p12.3 | Alpha-2-macroglobulin | 103950 | 2 |
| A2MP | 12p13.3-p12.3 | Alpha-2-macroglobulin pseudogene | - | 3 |
| ACE | 17q23.3 | Angiotensin 1 converting enzyme (petidyl-dipeptidase A) | 106180 | 1636 |
| AGT | 1q42-q43 | angiotensinogen | 106150 | 183 |
| APOE | 19q13.2 | Apolipoprotein E | 107741 | 348 |
| CDC2 | 10q21.1 | Cell division cycle 2 | 116940 | 983 |
| COG2 | 1q42.2 | component of oligomeric Golgi complex 2 | 606974 | 22796 |
| GAPDH | 12p13 | Glyceraldehydes-3-phosphate dehydrogenase | 138400 | 2597 |
| GAPDHS | 19q13.1 | Glyceraldehydes-3-phosphate dehydrogenase, spermatogenic | 609169 | 26330 |
| IDE | 10q23-q25 | Insulin degrading enzyme | 146680 | 3416 |
| LIPC | 15q21-q23 | Lipase, hepatic | 151670 | 3990 |
| LRP1 | 12q13-q14 | Low-density lipoprotein receptor-related protein 1 | 107770 | 4035 |
| LRRTM3 | 10q21.3 | Leucine-rich repeat transmembrane neuronal 3 protein | - | 347731 |
| LTA | 6p21.3 | Lymphotoxin alpha (TNF superfamily, member 1) | 153440 | 4049 |
| OLR1 | 12p13.2-p12.3 | Oxidized density lipoprotein (lectin-like) receptor 1 | 602601 | 4973 |
| PLAU | 10q24 | Urokinase-type plasminogen activator | 191840 | 5328 |
| PPM1H | 12q14.1-q14.2 | Protein phosphotase 1H (PP2C domain containing) | - | 57460 |
| PZP | 12p13-p12.2 | Pregnancy-zone protein | 176420 | 5858 |
| TNF | 6p21.3 | Tumor necrosis factor (TNF superfamily, member 2) | 191160 | 7124 |
| TNFRSF6/FAS | 10q24.1 | Necrosis factor receptor superfamily member 6 | 134637 | 355 |
| UBQLN1 | 9q21.2-q21.3 | Ubiquilin 1 | 605046 | 29979 |
| VR22/CTNNA3 | 10q22.2 | Catenin (cadherin-associated protein), alpha 3 | 607667 | 29119 |
Statistical Analysis
A comprehensive, two-stage approach to analysis was performed in which heterogeneity was first investigated in the dataset and then main effects and gene-gene interactions were investigated among the resulting subsets or clusters of data (Figure 1). Although all of the markers in the dataset had been previously tested for main effects and some even for interactions, this testing was performed at different time points over the past 10 years and, therefore, the samples on which they were tested vary to different degrees from the sample being analyzed in the current study. It is for this reason that a preliminary analysis of the complete datasets was performed prior to the two-stage analysis, using all the main effect and interaction-detection methods proposed for the subsets of data.
Figure 1.

Flowchart of Comprehensive Two-Stage Analysis Approach Applied to LOAD Data.
Analysis of deviations from Hardy-Weinberg equilibrium (HWE) and linkage equilibrium were tested using the Haploview program (Barrett JC et al., 2005) on the complete case-control and family-based datasets. Population stratification was investigated using the STRUCTURE program (Pritchard JK et al., 2000). The Bayesian Classification method (Cheeseman P and Stutz J, 1996; Hanson R et al., 1991), previously investigated in simulation studies described elsewhere (Thornton-Wells TA et al., 2006), was used to detect heterogeneity. For the family-based and case-control data, separately, the affected individuals in the dataset were subjected to cluster analysis (based on their marker genotypes) to create more homogeneous subsets of affected individuals. Each cluster subset was then recombined with the entire group of unaffected individuals from the respective dataset for subsequent analysis of main effects and interactions.
Bayesian Classification aims to find the most probable clustering of data given the data and the prior probabilities. In the case of genotypic data, prior probabilities are based on genotype frequencies. The most probable clustering of data is determined from two posterior probabilities. The first involves the probability that a particular individual belongs to its ‘assigned’ cluster, or otherwise stated as the probability of the individual’s multilocus genotype, conditional on it belonging to that cluster, with its characteristic genotypes. The second posterior probability involves the probability of a cluster given its assigned individuals, or otherwise stated as the probability of the cluster’s characteristic genotypes, conditional on the multilocus genotypes of the individuals assigned to that cluster.
In actuality, individuals are not ‘assigned’ to clusters in the hard classification sense but instead in the fuzzy sense they are temporarily assigned to the cluster to which they have the greatest probability of belonging. Thus, each individual has its own vector of probabilities of belonging to each of the clusters. A ranked listing is produced of all loci in the dataset with their corresponding normalized “attribute influence” values (ranging between 0 and 1), which provide a rough heuristic measure of relative influence of each locus in differentiating the classes from the overall dataset. This information that can then be used to more directly stratify affected (and/or unaffected) individuals, for instance, by using the top n most influential loci identified, and to enable meaningful interpretation of the clustering result.
For the family-based data, two-point heterogeneity lod score (HLOD) linkage analysis using FASTLINK and HOMOG (Ott J, 1999) and the pedigree disequilibrium test (PDT) for detecting main effect association (Martin ER et al., 2000; Martin ER et al., 2001)—were performed. While the cluster subsets are more homogeneous than the overall dataset, at least with regard to the markers with high influence values, it is not possible to know whether heterogeneity still exists in any one of those subsets with regard to the other loci. Therefore, HLOD scores were used both in the overall dataset and in the cluster subsets. The PDT is based on the transmission disequilibrium test and is robust to population stratification. For the linkage analysis, both recessive and dominant disease models were tested, and the maximum heterogeneity lod score, which is the highest lod score found for either model under the full range of possible theta values, is reported. For the case-control data, a chi-square test of independence was used to detect main effect associations. In each case, a genotype-based model was tested.
For both the family-based and the case-control datasets, the multifactor dimensionality reduction (MDR) method was used to detect gene-gene interactions (Hahn LW et al., 2003; Moore JH, 2007; Moore JH et al., 2006; Ritchie MD et al., 2001). MDR is a nonparametric and genetic model-free method that uses constructive induction to change the representation space of the data to make nonadditive interactions easier to detect using classification methods such as naïve Bayes or logistic regression. This is accomplished by pooling high-risk genotype combinations into one group and low-risk genotypes into another group thus defining a new single constructed variable. Here, we used a simple probabilistic classifier that is similar to naïve Bayes to model the relationship between variables constructed with MDR and our discrete endpoint of disease status. Using 5-fold cross validation, we measured the average balanced prediction accuracy (across the five cross-validation intervals) of every possible combination for the best one-, two- and three-way MDR models (Moore JH et al., 2006; Velez DR et al., 2007). For each of the one-locus, two-locus and three-locus combinations, the ‘best’ MDR model was chosen as the one with the best average balanced prediction accuracy. All ‘best’ MDR models were evaluated for statistical significance using an omnibus permutation test with 1000 permutations.
Since MDR works by comparing the ratio of affected to unaffected individuals but does not account for intrafamilial correlations only discordant sibpairs (DSPs) are used in the analysis of family-based data. Two datasets were created—the first with only one randomly chosen DSP per family (designated ‘1DSP’) and the second with all individuals who are part of one or more DSPs in a family (designated ‘AllDSPs’). An alternative method, the MDR-PDT, which uses the geno-PDT instead of balanced accuracy as the test statistic, does allow for inclusion of additional family members with the potential for increased power (Martin ER et al., 2006). However, the version of MDR-PDT that is currently available does not incorporate cross-validation, and as a result, there is some concern over whether its results are generalizable. In addition, since the majority of the families are made up of discordant sibpairs, not extended families, the MDR method is likely to produce very similar results to that of the MDR-PDT. A newer version of MDR-PDT that does include cross-validation is under development.
For each of the ‘best’ two- and three-marker MDR models achieving prediction accuracy of 55 percent or greater, the markers in those MDR models were used in logistic regression analyses to further characterize the underlying statistical models. For the case-control data, a logistic regression analysis was performed in SPSS, and for the family-based data, a multivariate logistic regression method, which controls for intrafamily correlation, was implemented in SAS (Martin ER et al., 2006; Siegmund KD et al., 2000) and applied to all discordant sibpairs.
Results
Analysis of Complete Datasets
Linkage and association results for the complete dataset are presented in Table 2. Linkage analysis detected the known effect of APOE (HetLOD = 7.96), but no other marker achieved a score above 1.5 (nominal significance). The PDT detected the known association with APOE (χ2=98.388, df=2, p<0.001), two other substantial effects—one in A2M (χ2=6.772, df=1, p=0.009) and one in ACE (χ2=7.104, df=1, p=0.008)—and 10 other marginal effects (χ2> 4.5, p<0.05). Analysis using the chi-square test of independence on the complete case-control dataset detected the known association with APOE (χ2=171.62, df=5, p<0.001) and seven other marginal effects in CDC2, VR22, LRRTM3 and GAPDH (χ2>6.2, p<0.05).
Table 2.
Main Effect Analysis Results for Complete Dataset.
| PDT | Pearson | |||||||
|---|---|---|---|---|---|---|---|---|
| Chrom | Gene | Marker | Minor Allele Freq | 2-Pt Linkage Max HetLOD | Chi-Square | p-value | Chi-Square | p-value |
| 10 | CDC2 | rs2448347 | 0.45 | 0.090 | 0.059 | 0.808 | 6.581 | 0.037 |
| 10 | VR22 | rs1786927 | 0.41 | 0.000 | 0.116 | 0.734 | 7.035 | 0.030 |
| 10 | VR22 | rs2441718 | 0.31 | 1.407 | 0.312 | 0.577 | 8.553 | 0.014 |
| 10 | VR22 | rs2456737 | 0.15 | 1.038 | 1.143 | 0.285 | 6.222 | 0.045 |
| 10 | VR22 | rs7909676 | 0.48 | 1.068 | 4.540 | 0.033 | 0.349 | 0.840 |
| 10 | LRRTM3 | rs942780 | 0.19 | 0.000 | 2.770 | 0.096 | 7.586 | 0.023 |
| 10 | LRRTM3 | rs1925617 | 0.44 | 0.343 | 1.604 | 0.205 | 6.465 | 0.039 |
| 10 | PLAU | rs2227568 | 0.16 | 0.000 | 5.170 | 0.023 | 1.254 | 0.534 |
| 10 | PLAU | rs4065 | 0.43 | 0.000 | 3.152 | 0.076 | 1.028 | 0.598 |
| 10 | rs4933194 | 0.49 | 0.052 | 4.676 | 0.031 | |||
| 12 | GAPDH | rs1060621 | 0.20 | 7.188 | 0.027 | |||
| 12 | A2M | rs3832852 | 0.16 | 0.011 | 6.772 | 0.009 | ||
| 12 | LRP1 | rs1800154 | 0.34 | 0.000 | 4.017 | 0.045 | ||
| 12 | LRP1 | rs9669595 | 0.35 | 0.003 | 4.599 | 0.032 | ||
| 12 | LRP1 | rs7956957 | 0.37 | 0.000 | 4.059 | 0.044 | ||
| 17 | ACE | rs4291 | 0.37 | 0.000 | 7.104 | 0.008 | 2.828 | 0.243 |
| 17 | ACE | rs4646994 | 0.47 | 0.000 | 5.481 | 0.019 | 1.180 | 0.554 |
| 17 | ACE | rs4343 | 0.48 | 0.000 | 4.516 | 0.034 | 3.175 | 0.204 |
| 17 | ACE | rs4353 | 0.48 | 0.000 | 4.887 | 0.027 | ||
| 17 | ACE | rs4978 | 0.48 | 0.000 | 6.503 | 0.011 | ||
| 19 | APOE | rs440446 | (E4) 0.35 | 7.963 | 98.388 | < 0.001 | 171.62 | < 0.001 |
MDR gene-gene interaction analysis was performed on both the complete family-based and complete case-control datasets. MDR detected the main effect of APOE in all three datasets (Case-Control, 1DSP and AllDSPs) by choosing APOE as the best one-locus model with perfect (5 of 5) cross-validation consistency and by including APOE in the best two- and three-locus models as well, all of which were statistically significant (p < 0.05). To give MDR the opportunity to detect other effects without interference of the APOE effect, we excluded APOE from the datasets and re-ran the analysis. In these subsequent analyses, none of the best one-, two- or three-locus models achieved average balanced prediction accuracies of greater than 53 percent or cross-validation consistency values of more than 2, and none were statistically significant (p > 0.20).
Detection of Heterogeneity
Bayesian Classification was applied to each of the complete case-control and family-based datasets. Only affected individuals were used in the cluster analysis. The family-based dataset produced twelve clusters, and the case-control dataset produced four clusters. To focus on heterogeneity that might be present in both datasets, we took the top 30 markers from each dataset with the highest influence values and selected those markers present in both datasets (31 markers). A marker’s influence value provides a rough heuristic measure of the relative influence that marker had in differentiating the clusters from the overall dataset. Then, we performed the cluster analysis again using only those 31 markers. This second analysis produced 15 clusters in the family-based dataset and 6 clusters in the case-control dataset.
After again ranking the markers by their influence values, it was discovered that the top 5 markers were the same in both datasets (Table 3). Therefore, in one final attempt to produce a clustering that was similar across both datasets and produced a more reasonable number of clusters, which could be subsequently investigated for main effects and interactions, we performed the cluster analysis using only these top 5 markers. This third and final round of clustering produced 5 clusters in the family-based dataset and 3 clusters in the case-control dataset (Table 4). Upon closer inspection, two of the five clusters in the family-based dataset contained only seven and five affected subjects, respectively, making subsequent analysis of those clusters inadvisable due to reduced sample size. Thus, only three resulting clusters were analyzed in each of the datasets.
Table 3.
Top Five Highest-Influence Markers from Second-Round of Cluster Analysis
| Chrom | Gene | Marker | FamInfluValue | CCInfluValue |
|---|---|---|---|---|
| 10 | LRRTM3 | rs1925632 | 0.938 | 0.792 |
| 10 | LRRTM3 | rs1952060 | 0.623 | 0.944 |
| 10 | LRRTM3 | rs2147886 | 1.000 | 1.000 |
| 10 | LRRTM3 | rs2251000 | 0.940 | 0.834 |
| 10 | LRRTM3 | rs2764807 | 0.673 | 0.890 |
Table 4.
Distribution of Affected Individuals in Final Clustering Results
| Number of Affecteds | ||
|---|---|---|
| Cluster | Family-Based Data | Case-Control Data |
| 0 | 673 | 215 |
| 1 | 480 | 157 |
| 2 | 257 | 79 |
| 3 | 7 | - |
| 4 | 5 | - |
Permutation testing was performed to determine whether this final clustering was statistically significant. In the family-based data, the clustering results produced an average class strength value of −4.34 (p<0.002) and an average cross-class entropy value of 4.00 (p<0.002). In the case-control data, the clustering results produced an average class strength value of −2.71 (p<0.002) and an average cross-class entropy value of 4.43 (p<0.012). Thus, for each of the datasets, the clustering results were significant at our predetermined alpha of ten percent, as suggested by our simulation studies reported elsewhere (Thornton-Wells TA et al., 2006).
Since the top 5 markers were all in the same gene (LRRTM3), we investigated whether they were in linkage disequilibrium (LD) with each other and thus were encoding a single haplotype block. LD analysis using Haploview indeed showed that the five markers and four additional flanking markers were all in high LD (r2≥ 0.63) with each other, and it showed the first four markers to be in a haplotype block (Figure 2). Furthermore, inspection of the multi-locus genotypes at the top 5 markers across the three clusters in each dataset showed that a separate multi-locus genotype was predominant in each of the three clusters and that these three multi-locus genotypes were the same across the case-control and family-based datasets (Table 5). Investigation of population stratification using STRUCTURE provided no evidence of structure in the data; thus, it is unlikely that these clustering results are related to this phenomenon.
Figure 2.
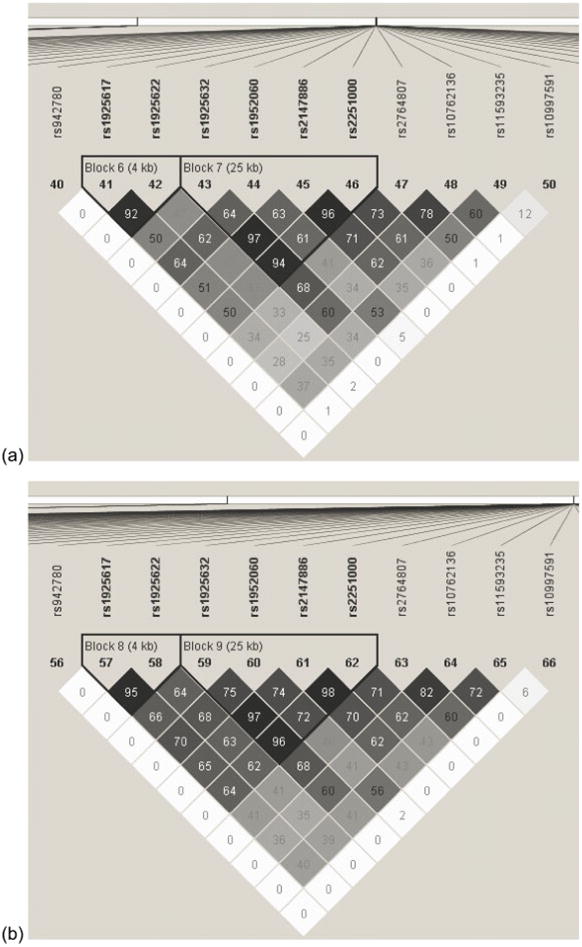
Linkage Disequilibrium Plot of Top 5 High-Influence Markers in (a) Family-Based Dataset and (b) Case-Control Datasets. The top five markers are: rs1925632, rs1952060, rs2147886, 2251000, and rs2764807. Numbers in each square represent pair-wise R2 values. The markers in bold are those in a haplotype block (all pair-wise R2 > 0.80).
Table 5.
Predominant Genotypes for the Top Five High-Influence Markers by Cluster
| Cluster | |||
|---|---|---|---|
| Marker | 0 | 1 | 2 |
| rs1925632 | A/C | C/C | A/A |
| rs1952060 | C/T | C/C | T/T |
| rs2147886 | C/T | C/C | T/T |
| rs2251000 | A/G | A/G | A/G |
| rs2764807 | C/T | C/C | T/T |
Detection of Main Effects in Subsets of Data
For each of the three clusters (0, 1, 2) in the family-based dataset, linkage analysis and association analysis by the PDT were conducted. For each of the three clusters in the case-control dataset, the chi-square test of independence was performed. Since the three clusters in the family-based and case-control datasets correspond exactly, analysis results are presented in the following subsections by cluster number. In each of the clusters, the top five high-influence markers and some flanking markers from the LRRTM3 and VR22 genes were found significant by one or more statistical tests. These results are expected and uninteresting and, therefore, they are excluded from the following text and tables of results.
Cluster 0 Results
Table 6 presents results for cluster 0 for all markers with significant scores on at least one of the three statistical tests performed (two-point linkage, PDT and Pearson chi-square). APOE produced significant results for the linkage HetLOD and the PDT and Pearson chi-square statistics. The PDT also found very marginal association with 13 other markers in LRP1, ACE and the ROI on chromosome 10 (χ2>3.9, p<0.05). Five markers in the PLAU, IDE, A2MP and ACE genes showed at least marginal association (χ2>8, p<0.05) according to the Pearson chi-square test of independence. When comparing results across the family-based and case-control datasets for cluster 0, two markers were found significant (p < 0.05)—rs4291 in the ACE and rs440446 in APOE.
Table 6.
Main Effect Analysis Results for Cluster 0.
| PDT | Pearson | |||||||
|---|---|---|---|---|---|---|---|---|
| Chrom | Gene | Marker | Minor Allele Freq | 2-Pt Linkage Max HetLOD | Chi-Square | p-value | Chi-Square | p-value |
| 10 | rs6482044 | 0.33 | 0.609 | 4.898 | 0.027 | |||
| 10 | rs7089698 | 0.45 | 0.156 | 4.902 | 0.027 | |||
| 10 | PLAU | rs2227568 | 0.16 | 1.506 | 0.6 | 0.439 | 9.118 | 0.028 |
| 10 | IDE | rs7099761 | 0.47 | 1.197 | 0.509 | 0.475 | 10.815 | 0.013 |
| 10 | IDE | rs1544210 | 0.47 | 0.034 | 0.006 | 0.939 | 19.355 | < 0.001 |
| 10 | rs2255901 | 0.49 | 0.000 | 4.447 | 0.035 | |||
| 12 | A2MP | rs34362 | 0.27 | 0.012 | 0 | 1.000 | 8.182 | 0.042 |
| 12 | LRP1 | rs1800181 | 0.34 | 0.000 | 5.433 | 0.020 | ||
| 12 | LRP1 | rs1800154 | 0.34 | 0.015 | 4.306 | 0.038 | ||
| 12 | LRP1 | rs1800165 | 0.34 | 0.014 | 4.976 | 0.026 | ||
| 12 | LRP1 | rs9669595 | 0.35 | 0.091 | 5.371 | 0.021 | ||
| 12 | LRP1 | rs7956957 | 0.37 | 0.000 | 3.918 | 0.048 | ||
| 17 | ACE | rs4291 | 0.37 | 0.000 | 6.339 | 0.012 | 8.414 | 0.038 |
| 17 | ACE | rs4295 | 0.36 | 0.000 | 4.831 | 0.028 | ||
| 17 | ACE | rs4646994 | 0.47 | 0.000 | 5.236 | 0.022 | 1.126 | 0.771 |
| 17 | ACE | rs4343 | 0.48 | 0.000 | 4.67 | 0.031 | 2.242 | 0.524 |
| 17 | ACE | rs4978 | 0.48 | 0.000 | 5.657 | 0.017 | ||
| 19 | APOE | rs440446 | (E4) 0.35 | 3.752 | 66.373 | < 0.001 | 118.292 | < 0.001 |
Cluster 1 Results
Table 7 presents significant results for cluster 1. Linkage analysis did not produce any HetLOD scores above 3 except for the expected LRRTM3 and VR22 markers. APOE produced significant results for the PDT and Pearson chi-square statistics. The PDT also showed strong association with rs2251101 in IDE (χ2=7.39, p<0.007) and rs3832852 in A2M (χ2=6.674, p<0.010) and marginal association with 8 additional markers in CDC2, PLAU, IDE, ACE, GAPDHS and the ROI on chromosome 10 (χ2>3.8, p<0.05). The chi-square test of independence found very strong association (χ2>9, p<0.01) with five markers in AGT, IDE and GAPDH. In addition, 18 other markers in AGT, UBQLN1, CDC2, PLAU, IDE, GAPDH, A2MP, LIPC and ACE showed marginal association (χ2>6, p<0.05).
Table 7.
Main Effect Analysis Results for Cluster 1.
| PDT | Pearson | |||||||
|---|---|---|---|---|---|---|---|---|
| Chrom | Gene | Marker | Minor Allele Freq | 2-Pt Linkage Max HetLOD | Chi-Square | p-value | Chi-Square | p-value |
| 1 | AGT | rs2148582 | 0.43 | 0.091 | 0.135 | 0.713 | 11.144 | 0.004 |
| 1 | AGT | rs5051 | 0.43 | 0.025 | 0.064 | 0.800 | 12.809 | 0.002 |
| 1 | AGT | rs1326886 | 0.10 | 0.073 | 0.040 | 0.742 | 8.652 | 0.013 |
| 9 | UBQLN1 | rs2781003 | 0.37 | 0.036 | 1.607 | 5.000 | 6.305 | 0.043 |
| 9 | UBQLN1 | rs2780995 | 0.37 | 6.794 | 0.033 | |||
| 9 | UBQLN1 | rs12344615 | 0.20 | 7.624 | 0.022 | |||
| 9 | UBQLN1 | rs11140213 | 0.20 | 0.528 | 1.986 | 0.159 | 8.023 | 0.018 |
| 10 | rs1319013 | 0.45 | 0.370 | 4.306 | 0.038 | |||
| 10 | CDC2 | 1920 | 0.23 | 2.092 | 0.405 | 0.524 | 11.509 | 0.021 |
| 10 | CDC2 | rs2448341 | 0.34 | 0.446 | 4.469 | 0.035 | 6.269 | 0.044 |
| 10 | CDC2 | rs2448347 | 0.45 | 1.270 | 0.540 | 0.463 | 7.161 | 0.028 |
| 10 | PLAU | rs1916341 | 0.44 | 1.099 | 1.047 | 0.306 | 6.591 | 0.037 |
| 10 | PLAU | rs2227566 | 0.47 | 1.306 | 1.848 | 0.174 | 6.866 | 0.032 |
| 10 | PLAU | rs2227568 | 0.16 | 0.291 | 6.470 | 0.011 | 4.622 | 0.099 |
| 10 | PLAU | rs4065 | 0.43 | 1.202 | 1.594 | 0.207 | 7.260 | 0.027 |
| 10 | IDE | rs2251101 | 0.30 | 0.000 | 7.388 | 0.007 | 2.068 | 0.356 |
| 10 | IDE | rs1832196 | 0.14 | 0.270 | 5.028 | 0.025 | 7.803 | 0.020 |
| 10 | IDE | rs7076966 | 0.45 | 0.257 | 0.091 | 0.763 | 9.976 | 0.007 |
| 10 | rs4372378 | 0.46 | 0.407 | 5.704 | 0.017 | |||
| 12 | GAPDH | rs7307229 | 0.01 | 8.618 | 0.013 | |||
| 12 | GAPDH | rs1060620 | 0.20 | 15.79 | < 0.001 | |||
| 12 | GAPDH | rs1060619 | 0.24 | 14.489 | 0.001 | |||
| 12 | A2M | rs3832852 | 0.16 | 0.084 | 6.674 | 0.010 | ||
| 12 | A2MP | rs16918212 | 0.10 | 0.000 | 0.010 | 0.920 | 6.051 | 0.049 |
| 12 | A2MP | rs17804080 | 0.09 | 0.000 | 0.095 | 0.758 | 8.722 | 0.013 |
| 15 | LIPC | rs6083 | 0.36 | 0.000 | 0.087 | 0.768 | 8.748 | 0.013 |
| 17 | ACE | rs4646994 | 0.47 | 0.000 | 0.778 | 0.378 | 6.004 | 0.050 |
| 17 | ACE | rs4343 | 0.48 | 0.000 | 3.341 | 0.068 | 8.903 | 0.012 |
| 17 | ACE | rs4353 | 0.48 | 0.000 | 4.265 | 0.039 | ||
| 17 | ACE | rs4978 | 0.48 | 0.000 | 3.991 | 0.046 | ||
| 19 | GAPDHS | rs4806173 | 0.38 | 0.250 | 4.464 | 0.035 | 2.907 | 0.234 |
| 19 | APOE | rs440446 | (E4) 0.35 | 2.158 | 40.994 | < 0.001 | 91.857 | < 0.001 |
When comparing across the family-based and case-control datasets for cluster 1, three markers—rs2448341 in CDC2, rs1832196 in IDE, and rs440446 in APOE—were found significant (p<0.05). Worth noting, one marker in PLAU (rs2227568) was significant according to the PDT in the family-based dataset, and in the case-control dataset that marker is in a haplotype block with rs1916341, which was significant by the Pearson chi-square test. Additionally, there are two markers in ACE (rs4353 and rs4978) that were significant by the PDT in the family-based dataset but are not present in the case-control dataset. In the family-based dataset, these markers are in high LD (r2≥0.92) with two other markers (rs4646994 and rs4343) that were found significant by the Pearson chi-square test in the case-control dataset.
Cluster 2 Results
Table 8 presents significant results for cluster 2. Linkage analysis produced no HetLOD scores greater than 3 except for markers in LRRTM3 and VR22. APOE produced significant results for the PDT and Pearson chi-square statistics. The PDT found strong association with rs2227568 in PLAU (χ2>7, p<0.009) and marginal association (χ2>4.9, p<0.05) with one marker in CDC2 and one marker in LRP1. The Pearson chi-square test found association with two markers in A2MP—rs17804080 (χ2=10.42, p=0.005) and rs16918212 (χ2=7.03, p=0.03). When comparing across the family-based and case-control datasets for cluster 2, only APOE was found significant.
Table 8.
Main Effect Analysis Results for Cluster 2 Family-Based Dataset.
| PDT | Pearson | |||||||
|---|---|---|---|---|---|---|---|---|
| Chrom | Gene | Marker | Minor Allele Freq | 2-Pt Linkage Max HetLOD | Chi-Square | p-value | Chi-Square | p-value |
| 10 | CDC2 | rs7919724 | 0.32 | 0.650 | 4.955 | 0.026 | 4.437 | 0.109 |
| 10 | PLAU | rs2227568 | 0.16 | 1.000 | 7.042 | 0.008 | 0.642 | 0.725 |
| 12 | A2MP | rs16918212 | 0.10 | 0.000 | 0.690 | 0.406 | 7.025 | 0.030 |
| 12 | A2MP | rs17804080 | 0.09 | 0.000 | 0.352 | 0.553 | 10.425 | 0.005 |
| 12 | LRP1 | rs1800154 | 0.34 | 0.000 | 5.141 | 0.023 | ||
| 19 | APOE | rs440446 | 0.35 | 0.567 | 36.984 | < 0.001 | 67.132 | < 0.001 |
Detection of Gene-Gene Interactions in Subsets of Data
For each of the three clusters in both the family-based and case-control datasets, an MDR gene-gene interaction analysis was conducted. APOE and the top 5 high-influence markers, plus the four flanking markers in linkage disequilibrium with those top markers, dominated the best MDR models. To allow other effects to be detected over these known effects, these ten markers were excluded and the MDR analyses were repeated. Cross-validation (CV) consistency was computed as the number of times (out of 5) that the reported best model was the best in the fold, or split, of the data. The average (across all five cross-validation intervals) of the balanced prediction accuracy and its corresponding significance level (p-value) was also determined.
Cluster 0 Results
For cluster 0, in the family-based 1DSP dataset, the best one-locus MDR model (CVC=4, p=0.10) was rs4291 in ACE and the best two-locus model (CVC=3, p=0.17) was rs4291 in ACE and rs7909676 in VR22, which is not in LD (r2 ≤ 0.01) with any LRRTM3 marker in the dataset. A statistically significant full factorial model was fit to the cluster 0 family-based dataset using rs4291 and rs7909676 (χ2 = 19.264, df=3, p = 0.0002), but the individual parameter estimates indicate that the significant effect in the model is primarily coming from marker rs4291 (Table 9). The heterozygote and the A/A homozygote for rs4291 increased risk for disease by 2.066 (p = 0.0106).
Table 9.
Logistic Regression Results for Cluster 0 Family-Based Data Using Markers from Significant Two-Locus MDR Model
| 95% Odds Confidence | Ratio Limits | ||||||
|---|---|---|---|---|---|---|---|
| Factor | Minor Allele Freq | χ2 | df | p Value | Odds Ratio | Lower | Upper |
| VR22(rs7909676) | 0.48 | 3.68 | 1 | 0.0550 | 1.916 | 0.986 | 3.723 |
| ACE(rs4291) | 0.37 | 6.52 | 1 | 0.0106 | 2.066 | 1.184 | 3.606 |
| rs7909676 * rs4291 | 0.35 | 1 | 0.5500 | 0.881 | 0.582 | 1.335 |
Cluster 1 Results
For cluster 1, in the case-control dataset, the best one-locus model (CVC=3, p=0.11) was rs3096244 in VR22, which is not in LD (r2≤ 0.04) with any LRRTM3 marker in the dataset, and the best two-locus MDR model (CVC=2, p=0.08) involved rs3096244 in VR22 and rs4343 in ACE. In the 1DSP family-based dataset, the best two locus model (CVC=3, p=0.13) was rs2255901 in the chromosome 10 ROI and rs922347 in VR22, which is not in LD with any LRRTM3 marker in the dataset.
A statistically significant full factorial model was fit to the cluster 1 case-control dataset using rs3096244 in VR22 and rs4343 in ACE from the best two-locus MDR model (χ2 = 20.646, df=3, p<0.001) (Table 10). Both markers displayed significant main effects, and the interaction effect, which had the opposite effect on risk, was also significant. At marker rs3096244 in VR22, the heterozygote and T/T homozygote decreased risk by an odds ratio of 0.464, and at marker rs4343 in ACE, the heterozygote and G/G homozygote decreased risk by an odds ratio of 0.425. However, in reference to any genotype combination that included the A/A homozygote for rs3096244 or the A/A homozygote for rs4343, those same genotypes when considered together actually increased risk by 1.696. Using the two markers included in the best two-locus MDR model for the 1DSP family-based dataset, logistic regression was used to fit a full factorial model to the data. However, the full model was not statistically significant (χ2 = 1.4917, df=3, p>0.68), nor were any of its factors.
Table 10.
Logistic Regression Results for Cluster 1 Case-Control Data Using Markers from Significant Two-Locus MDR Model
| 95% Odds Confidence | Ratio Limits | ||||||
|---|---|---|---|---|---|---|---|
| Factor | Minor Allele Freq | χ2 | df | p Value | Odds Ratio | Lower | Upper |
| VR22(rs3096244) | 0.38 | 14.4 | 1 | < 0.001 | 0.464 | 0.309 | 0.694 |
| ACE(rs4343) | 0.48 | 14.3 | 1 | < 0.001 | 0.425 | 0.270 | 0.671 |
| rs3096244 * rs4343 | 9.07 | 1 | 0.003 | 1.696 | 1.199 | 2.400 |
Cluster 2 Results
For cluster 2, the best one-locus MDR model (CVC = 5, p < 0.04) in the case-control dataset was rs10997591 in VR22, which is not in LD (r2≤ 0.12) with any LRRTM3 marker in the dataset, and the best one-locus MDR model (CVC = 5, p = 0.08) in the 1DSP family-based dataset was rs11816558 in the ROI on chromosome 10.
Discussion
The innovative two-stage approach we have applied is based on evidence that heterogeneity is a confounding factor in statistical genetic analysis and that the Bayesian Classification clustering method is capable of uncovering such heterogeneity in genotypic data. We primarily included markers in functional candidate genes (as opposed to markers from a genome wide scan, for instance), which increase the likelihood that any resulting cluster subsets will have a biological basis. An LD block in LRRTM3 was utilized to cluster cases into subsets, in which significant main effects were subsequently demonstrated. Just as with any other statistical result, one must ask whether it is also biologically meaningful. Does LRRTM3 serve as an effective proxy for genetic background? Does LRRTM3 directly or indirectly interact with the other genes that are associated with disease in cluster subsets? Perhaps the pertinent interactions involve VR22, which is the larger gene in whose intron LRRTM3 resides. Ultimately, whether the statistical results reported here are biologically relevant will be determined by whether they can be replicated, and, more importantly, whether functional molecular studies can demonstrate the biological plausibility of such interactions.
VR22 or CTNNA3 (catenin, alpha 3; MIM#607667) is a binding partner of beta-catenin (Janssens B et al., 2001), which interacts with presenilin 1. Presenilin 1 interacts with the gamma-secretase involved in processing the amyloid precursor protein (APP), and its mutations have been associated with increased levels of amyloid beta 42 (Citron M et al., 1997; Duff K et al., 1996; Qian S et al., 1998), the primary component of senile plaques found in Alzheimer disease. VR22 has been associated with the LOAD endophenotype of plasma Aβ42 levels (Ertekin-Taner N et al., 2003), and we have previously reported an interaction between VR22 and APOE with regard to risk of LOAD (Martin ER et al., 2005). Bertram et al. also reported an association between VR22 and LOAD, but it was not contingent on APOE status (Bertram L et al., 2007b).
Leucine-rich containing proteins, like LRRTM3, are involved in protein-protein interactions, and the family of leucine-rich repeat transmembrane proteins (LRRTMs) are involved in many cellular events during nervous system development and disease (Lauren J et al., 2003). Of particular relevance to Alzheimer disease pathology, LRRTM3 is highly expressed in the adult mouse hippocampus, in the granular layer of the dentate gyrus (Lauren J et al., 2003). Tau-mediated neurodegeneration in this area is thought to play a role in Alzheimer disease progression (Shahani N et al., 2006).
Recent evidence is mounting in support of an alternative hypothesis for Alzheimer disease pathology, which implicates cell cycle reactivation as a key early event that precedes and possibly is causally related to tau, APP phosphorylation and apoptotic cell death (Andorfer C et al., 2005; McPhie DL et al., 2003; Yang Y et al., 2006). Amyloid precursor protein has been purported to regulate activation of neuronal cell cycle proteins (McPhie DL et al., 2003); therefore, hypothetically, mutations in VR22 could indirectly affect cell cycle activation, through interactions with APP (by way of beta-catenin and presenilin 1). Additionally, since LRRTM3 is thought to be involved in neuronal development in some of the key areas that are later targets of neuronal cell death in Alzheimer disease, perhaps LRRTM3 is being re-activated in some way that facilitates the cell cycle re-entry of neurons. Thus, it would be interesting to learn whether VR22 and/or LRRTM3 are differentially expressed in the brains of AD patients versus controls.
For every cluster, the main effect and interaction subset analyses showed LRRTM3 markers exhibiting strong effects. This is an expected result. Essentially, the cluster analysis is introducing a bias toward association in the cluster subsets with regard to the five LRRTM3 markers it used to create the clusters. Likewise, flanking or nearby markers in LRRTM3 and the larger gene, VR22, within which LRRTM3 resides, might demonstrate effects that could be attributed to linkage disequilibrium with the LRRTM3 haplotype block. In contrast, however, any association found with a gene not linked to the five LRRTM3 markers would be evidence of heterogeneity or a gene-gene interaction. Looking across all the main effect and interaction analyses, there are a few genes for each cluster that deserve further investigation in relation to their LRRTM3 multilocus genotype (Table 5).
Complete Dataset
The analysis of the complete family-based and case-control datasets found only the APOE marker rs440446 was significant in both the case-control and family-based datasets. Many of the markers that were found significant by at least one main effect statistical test in either the complete case-control or complete family-based datasets were also significant in the analysis of specific subsets produced by the Bayesian Classification analysis. Table 11 indicates which of the markers initially found significant in the complete datasets were also found significant in one or more of the cluster subsets. Excluding markers from LRRTM3 and VR22, two markers were found significant across all three clusters as well as in their respective complete dataset—APOE marker rs440446 and PLAU marker rs2227568. Interestingly, the effect of APOE was less in each of the cluster subsets than it was in the complete datasets, perhaps simply due to smaller sample sizes and more unbalanced data.
Table 11.
Cluster Subset Results for Markers Found Significant in Complete Dataset. Marks in a cluster column indicate that the marker was found significant by at least one main effect test (linkage, PDT or Pearson chi-square) in that cluster subset.
| Cluster | |||||
|---|---|---|---|---|---|
| Chrom | Gene | Marker | 0 | 1 | 2 |
| 10 | CDC2 | rs2448347 | x | ||
| 10 | PLAU | rs2227568 | x | x | x |
| 10 | PLAU | rs4065 | x | ||
| 10 | rs4933194 | ||||
| 12 | GAPDH | rs1060621 | |||
| 12 | A2M | rs3832852 | x | ||
| 12 | LRP1 | rs1800154 | x | x | |
| 12 | LRP1 | rs9669595 | x | ||
| 12 | LRP1 | rs7956957 | x | ||
| 17 | ACE | rs4291 | x | ||
| 17 | ACE | rs4646994 | x | ||
| 17 | ACE | rs4343 | x | x | |
| 17 | ACE | rs4353 | x | ||
| 17 | ACE | rs4978 | x | x | |
| 19 | APOE | rs440446 | x | x | x |
In contrast, the PLAU marker effects were enhanced in the cluster subsets. The PLAU marker rs2227568 is approximately 6.26 Mb away from the nearest genotyped VR22 marker and it exhibits no LD (r2=0) with any of the VR22 or LRRTM3 markers. Therefore, it is unlikely that the consistency of the PLAU marker’s results can be attributed to the LRRTM3 effect. PLAU (urokinase-type plasminogen activator; MIM#5328) converts plasminogen to plasmin, and plasmin is involved in the processing of the amyloid precursor protein and in the degradation of amyloid-beta (Finckh U et al., 2003). The PLAU marker rs2227564 is a C/T missense polymorphism that has been associated with plasma amyloid-beta-42 levels and with LOAD in a German sample (Finckh U et al., 2003) and in a United States Caucasian sample (Ertekin-Taner N et al., 2005). However, at least two subsequent studies have failed to replicate these results—in an Italian sample (Bagnoli S et al., 2005) and in a Scottish and Swedish sample (Blomqvist ME et al., 2004). Most recently, PLAU was found to be associated with LOAD only in APOE-ε4 non-carriers in an Italian sample (Pesaresi M et al., 2007).
Cluster Subsets
For cluster 0, one gene (ACE) showed interesting results in main effect and interaction analyses. ACE (angiotensin 1 converting enzyme; MIM#106180) has been shown to inhibit the aggregation of amyloid beta by degrading amyloid beta 40 into less toxic products (Hu J et al., 1999; Hu J et al., 2001). Studies have reported conflicting results regarding the association between the ACE insertion/deletion polymorphism and LOAD, with the risk allele reported sometimes as the insertion and sometimes as the deletion. Such ‘flip-flop’ associations might be due to multilocus effects, in which the risk allele is inversely correlated with another risk allele at another locus (Lin PI et al., 2006a). A recent analysis of our family dataset using the MDR-PDT suggested an interaction between LRRTM3, ACE and possibly A2M (Hahn LW et al., 2006). The marker rs4291 was significant by its PDT and Pearson chi-square statistics and appeared in the best one- and two-locus MDR models for the 1DSP family-based dataset. This two-locus MDR model was confirmed by logistic regression to be largely a main effect of rs4291. Five other ACE markers—rs4295, rs4311, rs4646994, rs4343 and rs4978—which were all in LD with the former marker and/or each other, were also significant by their PDT statistics.
For cluster 1, three genes (PLAU, ACE and CDC2) showed interesting results for main effect and/or interaction analyses. In PLAU, marker rs2227568 was significant by its HetLOD score and is in LD with PLAU marker rs1916341, which was significant by its PDT chi-square statistics. In ACE, markers rs4646994 and rs4343, which are in LD with each other, were significant by their Pearson chi-square statistics, and rs4343 appeared in the best two-locus MDR model in the case-control dataset, which was confirmed by logistic regression to have both a main and interactive effect involving rs4343. In addition, ACE markers rs4353 and rs4978, which are in LD with rs4646994, were found significant by their PDT chi-square statistics.
CDC2 (cell division cycle 2; MIM#116940) is a kinase involved in the abnormal phosphorylation of tau and the aggregation of tau into paired helical filaments (Pei JJ et al., 2006), which are present in the neurofibrillary tangles of Alzheimer disease. CDC2 has been associated with AD and with increased levels of tau in cerebrospinal fluid (Johansson A et al., 2003; Johansson A et al., 2005). However, we were not able to replicate these findings in a previous analysis of our complete dataset (Liang X et al., 2007b). In cluster 1, the CDC2 marker rs2448341 was significant by its PDT and Pearson chi-square statistics. Another CDC2 marker, rs2448347, which is in LD with rs2448341, was also significant by its Pearson chi-square statistic.
In cluster 2, there were no additional genes that showed evidence for association in both the case-control and family-based datasets. This subset was the smallest and most unbalanced from each of the case-control and family-based clusters, and it is possible that its overall size and/or the extent of the imbalance between affecteds and unaffecteds made these analyses too underpowered to detect an effect, if it were there. It is also possible that no interactions exist with the cluster 2 LRRTM3 genotypes and the other markers included in the datasets.
Methodology
Previously conducted simulation studies of the Bayesian Classification method reported elsewhere (Thornton-Wells TA et al., 2006) used markers that had no linkage disequilibrium (LD) with each other, while the current application involved markers with considerable LD, comprising multiple haplotype blocks. The clustering method chose to focus on a set of markers in LRRTM3 that were in high LD with each other to cluster affected subjects into more homogeneous subsets. This is very similar to simple stratification according to a single genetic locus or haplotype block in a candidate gene—the type of analysis that is often performed for known genetic risk factors like APOE. However, the clustering did not merely stratify by haplotype but instead clustered individuals based on their similarity across the five genotypes in the haplotype block. For instance, in cluster 1, the predominant multilocus genotype combination (see Table 5) was found in only 35 percent of the individuals in that cluster. Most remaining individuals in cluster 1 had genotype combinations, which differed from the predominant genotype at either rs1952060 and/or rs2251000, and yet the clustering method was able to determine that they were more similar to each other than they were to the groups of individuals in clusters 0 and 2. Such pattern recognition is not trivial, hence the plethora of clustering algorithms designed for the task.
No discussion about a large data analysis project such as this would be complete without mention of the multiple-testing problem. As one increases the number of tests performed, the likelihood of generating false positive results also increases, beyond the per-comparison significance level (alpha) established at the beginning of the study. Correction using either Bonferoni or False Discovery Rate (Benjamini Y and Hochberg Y, 1995; Storey JD, 2002) results in statistical significance only for APOE marker rs440446 in the overall dataset and also for some LRRTM3 markers in the cluster subsets. Since our predominant goal was not to miss any real effects, which we could subsequently investigate further, such caution at the expense of power would be imprudent. In addition, since we know there is considerable LD among our markers, the assumption that all the tests are independent is not valid. We would, in fact, expect that two markers in LD with each other would frequently produce similar results, in excess of how often two independent markers should do so. Furthermore, since all of the markers tested were chosen because they are functional and/or positional candidates for late-onset Alzheimer disease, the likelihood that a positive result is true is higher than it would be if the markers were chosen at random, for example in the case of a genomic screen. Finally and perhaps most importantly, it should be noted that we have tested two independent datasets, which serve as one test and one replication dataset, and are focusing only on those effects that were found significant (at the per-comparison level of 0.05) in both datasets. Thus, we have further reduced the chance that such a statistically significant result is a false positive.
Conclusions
Common diseases with a genetic basis are likely to have a very complex etiology, in which the mapping between genotype and phenotype is far from straightforward. A new comprehensive statistical and computational strategy for identifying the missing link between genotype and phenotype has been proposed. Numerous examples of heterogeneity and gene-gene or gene-environment interactions support the theoretical basis for such an approach, which emphasizes the need to address heterogeneity in the first stage of any analysis (Thornton-Wells TA et al., 2004). Uncovering any heterogeneity that might exist in a dataset removes a formidable source of noise, affording main effect and interaction analysis methods the best opportunity to detect effects that might be present only on particular genetic backgrounds or in individuals with particular environmental exposure(s). It is important to keep in mind that while whole genome studies are producing vastly greater amounts of genotypic data, such a brute force method is still subject to effect masking by heterogeneity and interactions. Thus, it will be important to determine how well methods for dissecting heterogeneity can scale up to such studies.
It is a reality that currently a majority of genetic studies, particularly those involving neurological diseases, do not have substantial phenotypic data available, even though the quality and volume of genotypic data might be excellent. Many factors, including cost, feasibility (invasiveness), and technical limitations (reliability and interpretation) of phenotyping technologies, make the collection of rich phenotypic data more challenging. Given the lack of methods for dissecting heterogeneity that do not rely on substantial phenotypic data, an ‘unsupervised’ clustering method—Bayesian Classification—was used to detect multilocus genotype patterns that might underlie or be a proxy for genetic heterogeneity, and possibly by extension, trait heterogeneity.
This method found statistically significant clusterings for both the family-based and case-control datasets, which used the same five markers as their most influential in determining cluster assignment. These markers were all in LRRTM3 and were in high linkage disequilibrium with each other. Each of the three resulting clusters could be characterized by their multilocus genotypes at these five markers, and the same genotypes defined the clusters in both the family-based and case-control data. In subsequent analyses to detect main effects and gene-gene interactions, markers in three genes—PLAU, ACE and CDC2—were found to be associated with late-onset Alzheimer disease in particular subsets of the data based on their LRRTM3 multilocus genotype. All of these genes are viable candidates for LOAD based on their known biological function, even though PLAU, CDC2 and LRRTM3 were initially identified as positional candidates. Further studies are needed to replicate these statistical findings and to elucidate possible biological interaction mechanisms between LRRTM3 and these genes.
Over the past twenty years, advances in genotyping technology have far outpaced those in statistical and computational methods for analyzing genetic data. Likewise, geneticists have given much less attention to phenotyping technologies. To most effectively leverage the massive amounts of genotypic data being produced, we must have comparably rich datasets of phenotypic information available for mapping genotypes to phenotypes. Thus, going forward, genetic studies will need to increasingly focus time and resources on collecting phenotypic data that can refine definitions or subcategories of traits or diseases and can serve as endophenotypes, which are more likely to have simple etiologies and to directly map to specific genetic markers.
Acknowledgments
The authors would like to acknowledge financial support from the Vanderbilt University Neuroscience Graduate Program (T32 MH64913), the National Library of Medicine Training Grant Fellowship (LMO7450-01), and the following grants from the National Institutes of Health: R01AG019085, R01AG019757, R01AG021547, and R01AG0210135.
References
- Andorfer C, Acker CM, Kress Y, Hof PR, Duff K, Davies P. Cell-cycle reentry and cell death in transgenic mice expressing nonmutant human tau isoforms. J Neurosci. 2005;25:5446–5454. doi: 10.1523/JNEUROSCI.4637-04.2005. [DOI] [PMC free article] [PubMed] [Google Scholar]
- Bagli M, Papassotiropoulos A, Jessen F, Rao ML, Maier W, Heun R. Gene-gene interaction between interleukin-6 and alpha2-macroglobulin influences the risk for Alzheimer’s disease. Ann Neurol. 2000;47:138–139. [PubMed] [Google Scholar]
- Bagnoli S, Tedde A, Cellini E, Rotondi M, Nacmias B, Sorbi S. The urokinase-plasminogen activator (PLAU) gene is not associated with late onset Alzheimer’s disease. Neurogenetics. 2005;6:53–54. doi: 10.1007/s10048-004-0203-2. [DOI] [PubMed] [Google Scholar]
- Barrett JC, Fry B, Maller J, Daly MJ. Haploview: analysis and visualization of LD and haplotype maps. Bioinformatics. 2005;21:263–265. doi: 10.1093/bioinformatics/bth457. [DOI] [PubMed] [Google Scholar]
- Benjamini Y, Hochberg Y. Controlling the False Discovery Rate: a Practical and Powerful Approach to Multiple Testing. J R Statist Soc B. 1995;57:289–300. [Google Scholar]
- Bertram L, Hsiao M, McQueen MB, Parkinson M, Mullin K, Blacker D, Tanzi RE. The LDLR locus in Alzheimer’s disease: a family-based study and meta-analysis of case-control data. Neurobiol Aging. 2007a;28:18.e18–18.e21. doi: 10.1016/j.neurobiolaging.2005.11.005. [DOI] [PubMed] [Google Scholar]
- Bertram L, Mullin K, Parkinson M, Hsiao M, Moscarillo TJ, Wagner SL, Becker KD, Velicelebi G, Blacker D, Tanzi RE. Is alpha-T catenin (VR22) an Alzheimer’s disease risk gene? J Med Genet. 2007b;44:e63. doi: 10.1136/jmg.2005.039263. [DOI] [PMC free article] [PubMed] [Google Scholar]
- Blomqvist ME, Andreasen N, Bogdanovic N, Blennow K, Brookes AJ, Prince JA. Genetic variation in CTNNA3 encoding alpha-3 catenin and Alzheimer’s disease. Neurosci Lett. 2004;358:220–222. doi: 10.1016/j.neulet.2004.01.032. [DOI] [PubMed] [Google Scholar]
- Cheeseman P, Stutz J. Bayesian classification (AutoClass): theory and results. Menlo Park: The American Association of Artificial Intelligence/MIT Press; 1996. [Google Scholar]
- Citron M, Westaway D, Xia W, Carlson G, Diehl T, Levesque G, Johnson-Wood K, Lee M, Seubert P, Davis A, Kholodenko D, Motter R, Sherrington R, Perry B, Yao H, Strome R, Lieberburg I, Rommens J, Kim S, Schenk D, Fraser P, St George HP, Selkoe DJ. Mutant presenilins of Alzheimer’s disease increase production of 42-residue amyloid beta-protein in both transfected cells and transgenic mice. Nat Med. 1997;3:67–72. doi: 10.1038/nm0197-67. [DOI] [PubMed] [Google Scholar]
- Corder EH, Beaumont H. Susceptibility groups for Alzheimer’s disease (OPTIMA cohort): integration of gene variants and biochemical factors. Mech Ageing Dev. 2007;128:76–82. doi: 10.1016/j.mad.2006.11.014. [DOI] [PubMed] [Google Scholar]
- Corder EH, Saunders AM, Strittmatter WJ, Schmechel DE, Gaskell PC, Small GW, Roses AD, Haines JL, Pericak-Vance MA. Gene dose of apolipoprotein E type 4 allele and the risk of Alzheimer’s disease in late onset families. Science. 1993;261:921–923. doi: 10.1126/science.8346443. [DOI] [PubMed] [Google Scholar]
- Corder EH, Woodbury MA. Genetic heterogeneity in Alzheimer’s disease: a grade of membership analysis. Genet Epidemiol. 1993;10:495–499. doi: 10.1002/gepi.1370100628. [DOI] [PubMed] [Google Scholar]
- Cruts M, Backhovens H, Wang SY, Van Gassen G, Theuns J, De Jonghe CD, Wehnert A, De Voecht J, De Winter G, Cras P. Molecular genetic analysis of familial early-onset Alzheimer’s disease linked to chromosome 14q24.3. Hum Mol Genet. 1995;4:2363–2371. doi: 10.1093/hmg/4.12.2363. [DOI] [PubMed] [Google Scholar]
- Daw EW, Payami H, Nemens EJ, Nochlin D, Bird TD, Schellenberg GD, Wijsman EM. The number of trait loci in late-onset Alzheimer disease. Am J Hum Genet. 2000;66:196–204. doi: 10.1086/302710. [DOI] [PMC free article] [PubMed] [Google Scholar]
- Ditter SM, Mirra SS. Neuropathologic and clinical features of Parkinson’s disease in Alzheimer’s disease patients. Neurology. 1987;37:754–760. doi: 10.1212/wnl.37.5.754. [DOI] [PubMed] [Google Scholar]
- Duff K, Eckman C, Zehr C, Yu X, Prada CM, Perez-Tur J, Hutton M, Buee L, Harigaya Y, Yager D, Morgan D, Gordon MN, Holcomb L, Refolo L, Zenk B, Hardy J, Younkin S. Increased amyloid-beta42(43) in brains of mice expressing mutant presenilin 1. Nature. 1996;383:710–713. doi: 10.1038/383710a0. [DOI] [PubMed] [Google Scholar]
- Ertekin-Taner N, Ronald J, Asahara H, Younkin L, Hella M, Jain S, Gnida E, Younkin S, Fadale D, Ohyagi Y, Singleton A, Scanlin L, de AM, Petersen R, Graff-Radford N, Hutton M, Younkin S. Fine mapping of the alpha-T catenin gene to a quantitative trait locus on chromosome 10 in late-onset Alzheimer’s disease pedigrees. Hum Mol Genet. 2003;12:3133–3143. doi: 10.1093/hmg/ddg343. [DOI] [PMC free article] [PubMed] [Google Scholar]
- Ertekin-Taner N, Ronald J, Feuk L, Prince J, Tucker M, Younkin L, Hella M, Jain S, Hackett A, Scanlin L, Kelly J, Kihiko-Ehman M, Neltner M, Hersh L, Kindy M, Markesbery W, Hutton M, de Andrade M, Petersen RC, Graff-Radford N, Estus S, Brookes AJ, Younkin SG. Elevated amyloid beta protein (Abeta42) and late onset Alzheimer’s disease are associated with single nucleotide polymorphisms in the urokinase-type plasminogen activator gene. Hum Mol Genet. 2005;14:447–460. doi: 10.1093/hmg/ddi041. [DOI] [PubMed] [Google Scholar]
- Finckh U, van Hadeln K, Muller-Thomsen T, Alberici A, Binetti G, Hock C, Nitsch RM, Stoppe G, Reiss J, Gal A. Association of late-onset Alzheimer disease with a genotype of PLAU, the gene encoding urokinase-type plasminogen activator on chromosome 10q22.2. Neurogenetics. 2003;4:213–217. doi: 10.1007/s10048-003-0157-9. [DOI] [PubMed] [Google Scholar]
- Gibbs RA, Belmont JW, Hardenbol P, Willis TD, Yu F, Yang H, Ch’ang LY, Huang W, Liu B, Shen Y, Tam PK, Tsui LC, Waye MM, Wong JT, Zeng C, Zhang Q, Chee MS, Galver LM, Kruglyak S, Murray SS, Oliphant AR, Montpetit A, Hudson TJ, Chagnon F, Ferretti V, Leboeuf M, Phillips MS, Verner A, Kwok PY, Duan S, Lind DL, Miller RD, Rice JP, Saccone NL, Taillon-Miller P, Xiao M, Nakamura Y, Sekine A, Sorimachi K, Tanaka T, Tanaka Y, Tsunoda T, Yoshino E, Bentley DR, Deloukas P, Hunt S, Powell D, Altshuler D, Gabriel SB, Zhang H, Matsuda I, Fukushima Y, Macer DR, Suda E, Rotimi CN, Adebamowo CA, Aniagwu T, Marshall PA, Matthew O, Nkwodimmah C, Royal CD, Leppert MF, Dixon M, Stein LD, Cunningham F, Kanani A, Thorisson GA, Chakravarti A, Chen PE, Cutler DJ, Kashuk CS, Donnelly P, Marchini J, McVean GA, Myers SR, Cardon LR, Abecasis GR, Morris A, Weir BS, Mullikin JC, Sherry ST, Feolo M, Altshuler D, Daly MJ, Schaffner SF, Qiu R, Kent A, Dunston GM, Kato K, Niikawa N, Knoppers BM, Foster MW, Clayton EW, Wang VO, Watkin J, Gibbs RA, Belmont JW, Sodergren E, Weinstock GM, Wilson RK, Fulton LL, Rogers J, Birren BW, Han H, Wang H, Godbout M, Wallenburg JC, L’Archeveque P, Bellemare G, Todani K, Fujita T, Tanaka S, Holden AL, Lai EH, Collins FS, Brooks LD, McEwen JE, Guyer MS, Jordan E, Peterson JL, Spiegel J, Sung LM, Zacharia LF, Kennedy K, Dunn MG, Seabrook R, Shillito M, Skene B, Stewart JG, Valle DL, Jorde LB, Belmont JW, Chakravarti A, Cho MK, Duster T, Foster MW, Jasperse M, Knoppers BM, Kwok PY, Licinio J, Long JC, Marshall PA, Ossorio PN, Wang VO, Rotimi CN, Royal CD, Spallone P, Terry SF, Lander ES, Lai EH, Nickerson DA, Altshuler D, Bentley DR, Boehnke M, Cardon LR, Daly MJ, Deloukas P, Douglas JA, Gabriel SB, Hudson RR, Hudson TJ, Kruglyak L, Kwok PY, Nakamura Y, Nussbaum RL, Royal CD, Schaffner SF, Sherry ST, Stein LD, Tanaka T. The International HapMap Project. Nature. 2003;426:789–796. doi: 10.1038/nature02168. [DOI] [PubMed] [Google Scholar]
- Glabe C. Does Alzheimer disease tilt the scales of amyloid degradation versus accumulation? Nat Med. 2000;6:133–134. doi: 10.1038/72215. [DOI] [PubMed] [Google Scholar]
- Goedert M. Pinning down phosphorylated tau. Nature. 1999;399:739–740. doi: 10.1038/21550. [DOI] [PubMed] [Google Scholar]
- Growden JH. Advances in the Diagnosis of Alzheimer’s Disease. In: Iqbal K, Mortimer JA, Winblad B, Wisniewski H, editors. Research Advances in Alzheimer’s Disease and Related Disorders. New York: John Wiley and Sons, Ltd; 1995. pp. 139–153. [Google Scholar]
- Guillozet AL, Weintraub S, Mash DC, Mesulam MM. Neurofibrillary tangles, amyloid, and memory in aging and mild cognitive impairment. Arch Neurol. 2003;60:729–736. doi: 10.1001/archneur.60.5.729. [DOI] [PubMed] [Google Scholar]
- Hahn LW, Edwards TL, Gilbert JR, Pericak-Vance MA, Martin ER, Ritchie MD. Gene-gene interaction models identified for Alzheimer Disease using MDR-PDT [Abstract 2224]. Annual Meeting of The American Society of Human Genetics; October 12, 2006; New Orleans, LA. 2006. Available from http://www.ashg.org/genetics/ashg06s/index.shtml. [Google Scholar]
- Hahn LW, Ritchie MD, Moore JH. Multifactor dimensionality reduction software for detecting gene-gene and gene-environment interactions. Bioinformatics. 2003;19:376–382. doi: 10.1093/bioinformatics/btf869. [DOI] [PubMed] [Google Scholar]
- Hanson R, Stutz J, Cheeseman P. In Technical Report FIA-90-12-7-01. Artificial Intelligence Branch, NASA Ames Research Center; 1991. Bayesian classification theory. [Google Scholar]
- Hirschhorn JN, Lohmueller K, Byrne E, Hirschhorn K. A comprehensive review of genetic association studies. Genet Med. 2002;4:45–61. doi: 10.1097/00125817-200203000-00002. [DOI] [PubMed] [Google Scholar]
- Hu J, Igarashi A, Kamata M, Nakagawa H. Angiotensin-converting enzyme degrades Alzheimer amyloid beta-peptide (A beta); retards A beta aggregation, deposition, fibril formation; and inhibits cytotoxicity. J Biol Chem. 2001;276:47863–47868. doi: 10.1074/jbc.M104068200. [DOI] [PubMed] [Google Scholar]
- Hu J, Miyatake F, Aizu Y, Nakagawa H, Nakamura S, Tamaoka A, Takahash R, Urakami K, Shoji M. Angiotensin-converting enzyme genotype is associated with Alzheimer disease in the Japanese population. Neurosci Lett. 1999;277:65–67. doi: 10.1016/s0304-3940(99)00827-7. [DOI] [PubMed] [Google Scholar]
- Janssens B, Goossens S, Staes K, Gilbert B, van Hengel J, Colpaert C, Bruyneel E, Mareel M, van Roy F. alphaT-catenin: a novel tissue-specific beta-catenin-binding protein mediating strong cell-cell adhesion. J Cell Sci. 2001;114:3177–3188. doi: 10.1242/jcs.114.17.3177. [DOI] [PubMed] [Google Scholar]
- Johansson A, Hampel H, Faltraco F, Buerger K, Minthon L, Bogdanovic N, Sjogren M, Zetterberg H, Forsell L, Lilius L, Wahlund LO, Rymo L, Prince JA, Blennow K. Increased frequency of a new polymorphism in the cell division cycle 2 (CDC2) gene in patients with Alzheimer’s disease and frontotemporal dementia. Neurosci Lett. 2003;340:69–73. doi: 10.1016/s0304-3940(03)00051-x. [DOI] [PubMed] [Google Scholar]
- Johansson A, Zetterberg H, Hampel H, Buerger K, Prince JA, Minthon L, Wahlund LO, Blennow K. Genetic association of CDC2 with cerebrospinal fluid tau in Alzheimer’s disease. Dement Geriatr Cogn Disord. 2005;20:367–374. doi: 10.1159/000088634. [DOI] [PubMed] [Google Scholar]
- Lauren J, Airaksinen MS, Saarma M, Timmusk T. A novel gene family encoding leucine-rich repeat transmembrane proteins differentially expressed in the nervous system. Genomics. 2003;81:411–421. doi: 10.1016/s0888-7543(03)00030-2. [DOI] [PubMed] [Google Scholar]
- Liang X, Martin ER, Schnetz-Boutaud N, Bartlett J, Anderson B, Zuchner S, Gwirtsman H, Schmechel D, Carney R, Gilbert JR, Pericak-Vance MA, Haines JL. Effect of heterogeneity on the chromosome 10 risk in late-onset Alzheimer disease. Hum Mutat. 2007a doi: 10.1002/humu.20567. (In Press, ePub June 15, 2007) [DOI] [PubMed] [Google Scholar]
- Liang X, Schnetz-Boutaud N, Bartlett J, Anderson BM, Gwirtsman H, Schmechel D, Carney R, Gilbert JR, Pericak-Vance MA, Haines JL. Association analysis of genetic polymorphisms in the CDC2 gene with late-onset Alzheimer disease. Dement Geriatr Cogn Disord. 2007b;23:126–132. doi: 10.1159/000097857. [DOI] [PubMed] [Google Scholar]
- Lin PI, Vance JM, Pericak-Vance MA, Martin ER. “Flip-flop” associations: confirmation or spurious findings? [Abstract 1528]. Annual Meeting of The American Society of Human Genetics; October 12, 2006; New Orleans, LA. 2006a. Available from http://www.ashg.org/genetics/ashg06s/index.shtml. [Google Scholar]
- Lin PI, Martin ER, Browning-Large CA, Schmechel DE, Welsh-Bohmer KA, Doraiswamy PM, Gilbert JR, Haines JL, Pericak-Vance MA. Parsing the genetic heterogeneity of chromosome 12q susceptibility genes for Alzheimer disease by family-based association analysis. Neurogenetics. 2006b;7:157–165. doi: 10.1007/s10048-006-0047-z. [DOI] [PubMed] [Google Scholar]
- Martin ER, Bass MP, Kaplan NL. Correcting for a potential bias in the pedigree disequilibrium test. Am J Hum Genet. 2001;68:1065–1067. doi: 10.1086/319525. [DOI] [PMC free article] [PubMed] [Google Scholar]
- Martin ER, Bronson PG, Li YJ, Wall N, Chung RH, Schmechel DE, Small G, Xu PT, Bartlett J, Schnetz-Boutaud N, Haines JL, Gilbert JR, Pericak-Vance MA. Interaction between the alpha-T catenin gene (VR22) and APOE in Alzheimer’s disease. J Med Genet. 2005;42:787–792. doi: 10.1136/jmg.2004.029553. [DOI] [PMC free article] [PubMed] [Google Scholar]
- Martin ER, Monks SA, Warren LL, Kaplan NL. A test for linkage and association in general pedigrees: the pedigree disequilibrium test. Am J Hum Genet. 2000;67:146–154. doi: 10.1086/302957. [DOI] [PMC free article] [PubMed] [Google Scholar]
- Martin ER, Ritchie MD, Hahn L, Kang S, Moore JH. A novel method to identify gene-gene effects in nuclear families: the MDR-PDT. Genet Epidemiol. 2006;30:111–123. doi: 10.1002/gepi.20128. [DOI] [PubMed] [Google Scholar]
- Mateo I, Infante J, Rodriguez E, Berciano J, Combarros O, Llorca J. Interaction between dopamine beta-hydroxylase and interleukin genes increases Alzheimer’s disease risk. J Neurol Neurosurg Psychiatry. 2006;77:278–279. doi: 10.1136/jnnp.2005.075358. [DOI] [PMC free article] [PubMed] [Google Scholar]
- McKeith I, Mintzer J, Aarsland D, Burn D, Chiu H, Cohen-Mansfield J, Dickson D, Dubois B, Duda JE, Feldman H, Gauthier S, Halliday G, Lawlor B, Lippa C, Lopez OL, Carlos MJ, O’Brien J, Playfer J, Reid W. Dementia with Lewy bodies. Lancet Neurol. 2004;3:19–28. doi: 10.1016/s1474-4422(03)00619-7. [DOI] [PubMed] [Google Scholar]
- McKeith IG, Galasko D, Kosaka K, Perry EK, Dickson DW, Hansen LA, Salmon DP, Lowe J, Mirra SS, Byrne EJ, Lennox G, Quinn NP, Edwardson JA, Ince PG, Bergeron C, Burns A, Miller BL, Lovestone S, Collerton D, Jansen EN, Ballard C, de Vos RA, Wilcock GK, Jellinger KA, Perry RH. Consensus guidelines for the clinical and pathologic diagnosis of dementia with Lewy bodies (DLB): report of the consortium on DLB international workshop. Neurology. 1996;47:1113–1124. doi: 10.1212/wnl.47.5.1113. [DOI] [PubMed] [Google Scholar]
- McKhann G, Drachman D, Folstein M, Katzman R, Price D, Stadlan EM. Clinical diagnosis of Alzheimer’s disease: report of the NINCDS-ADRDA Work Group under the auspices of Department of Health and Human Services Task Force on Alzheimer’s Disease. Neurology. 1984;34:939–944. doi: 10.1212/wnl.34.7.939. [DOI] [PubMed] [Google Scholar]
- McPhie DL, Coopersmith R, Hines-Peralta A, Chen Y, Ivins KJ, Manly SP, Kozlowski MR, Neve KA, Neve RL. DNA synthesis and neuronal apoptosis caused by familial Alzheimer disease mutants of the amyloid precursor protein are mediated by the p21 activated kinase PAK3. J Neurosci. 2003;23:6914–6927. doi: 10.1523/JNEUROSCI.23-17-06914.2003. [DOI] [PMC free article] [PubMed] [Google Scholar]
- Metzler-Baddeley C. A review of cognitive impairments in dementia with Lewy bodies relative to Alzheimer’s disease and Parkinson’s disease with dementia. Cortex. 2007;43:583–600. doi: 10.1016/s0010-9452(08)70489-1. [DOI] [PubMed] [Google Scholar]
- Meyer JS, Huang J, Chowdhury MH. MRI confirms mild cognitive impairments prodromal for Alzheimer’s, vascular and Parkinson-Lewy body dementias. J Neurol Sci. 2007;257:97–104. doi: 10.1016/j.jns.2007.01.016. [DOI] [PubMed] [Google Scholar]
- Moore JH. Genome-wide analysis of epistasis using multifactor dimensionality reduction: feature selection and construction in the domain of human genetics. In: Zhu X, Davidson I, editors. Knowledge Discovery and Data Mining: Challenges and Realities. Hersey, PA: IGI Global; 2007. [Google Scholar]
- Moore JH, Gilbert JC, Tsai CT, Chiang FT, Holden T, Barney N, White BC. A flexible computational framework for detecting, characterizing, and interpreting statistical patterns of epistasis in genetic studies of human disease susceptibility. J Theor Biol. 2006;241:252–261. doi: 10.1016/j.jtbi.2005.11.036. [DOI] [PubMed] [Google Scholar]
- Mufson EJ, Chen EY, Cochran EJ, Beckett LA, Bennett DA, Kordower JH. Entorhinal cortex beta-amyloid load in individuals with mild cognitive impairment. Exp Neurol. 1999;158:469–490. doi: 10.1006/exnr.1999.7086. [DOI] [PubMed] [Google Scholar]
- Olson JM, Goddard KA, Dudek DM. A second locus for very-late-onset Alzheimer disease: a genome scan reveals linkage to 20p and epistasis between 20p and the amyloid precursor protein region. Am J Hum Genet. 2002;71:154–161. doi: 10.1086/341034. [DOI] [PMC free article] [PubMed] [Google Scholar]
- Ott J, Hoh J. Set association analysis of SNP case-control and microarray data. J Comput Biol. 2003;10:569–574. doi: 10.1089/10665270360688192. [DOI] [PubMed] [Google Scholar]
- Ott J. Analysis of Human Genetic Linkage. Baltimore: Johns Hopkins University Press; 1999. [Google Scholar]
- Pei JJ, An WL, Zhou XW, Nishimura T, Norberg J, Benedikz E, Gotz J, Winblad B. P70 S6 kinase mediates tau phosphorylation and synthesis. FEBS Lett. 2006;580:107–114. doi: 10.1016/j.febslet.2005.11.059. [DOI] [PubMed] [Google Scholar]
- Pericak-Vance MA, Haines JL. The genetics of Alzheimer Disease. In: King RA, Rotter JI, Motulsky AG, editors. The Genetic Basis of Common Diseases. Oxford: Oxford University Press; 2002. [Google Scholar]
- Pesaresi M, Batelli S, Prato F, Polito L, Lovati C, Scarpini E, Quadri P, Mariani C, Albani D, Forloni G. The urokinase-type plasminogen activator polymorphism PLAU_1 is a risk factor for APOE-epsilon4 non-carriers in the Italian Alzheimer’s disease population and does not affect the plasma Abeta(1–42) level. Neurobiol Dis. 2007;25:609–613. doi: 10.1016/j.nbd.2006.10.017. [DOI] [PubMed] [Google Scholar]
- Pritchard JK, Stephens M, Donnelly P. Inference of population structure using multilocus genotype data. Genetics. 2000;155:945–959. doi: 10.1093/genetics/155.2.945. [DOI] [PMC free article] [PubMed] [Google Scholar]
- Qian S, Jiang P, Guan XM, Singh G, Trumbauer ME, Yu H, Chen HY, Van de Ploeg LH, Zheng H. Mutant human presenilin 1 protects presenilin 1 null mouse against embryonic lethality and elevates Abeta1–42/43 expression. Neuron. 1998;20:611–617. doi: 10.1016/s0896-6273(00)80999-x. [DOI] [PubMed] [Google Scholar]
- Ritchie MD, Hahn LW, Moore JH. Power of multifactor dimensionality reduction for detecting gene-gene interactions in the presence of genotyping error, missing data, phenocopy, and genetic heterogeneity. Genet Epidemiol. 2003;24:150–157. doi: 10.1002/gepi.10218. [DOI] [PubMed] [Google Scholar]
- Ritchie MD, Hahn LW, Roodi N, Bailey LR, Dupont WD, Parl FF, Moore JH. Multifactor-dimensionality reduction reveals high-order interactions among estrogen-metabolism genes in sporadic breast cancer. Am J Hum Genet. 2001;69:138–147. doi: 10.1086/321276. [DOI] [PMC free article] [PubMed] [Google Scholar]
- Roses AD, Devlin B, Conneally PM, Small GW, Saunders AM, Pritchard PA, Lock JL, Haines JL, Pericak-Vance MA, Risch N. Measuring the genetic contribution of APOE in late-onset Alzheimer Disease. Am J Hum Genet. 1995;57:A202. [Google Scholar]
- Saunders AM, Strittmatter WJ, Breitner JC, Schmechel D, St George-Hyslop PH, Pericak-Vance MA, Joo SH, Rosi BL, Gusella JF, Crapper-MacLachlan DR, Growden J, Alberts MJ, Hulette C, Crain B, Goldgaber D, Roses AD. Association of apolipoprotein E allele 4 with late-onset familial and sporadic Alzheimer’s disease. Neurology. 1993;43:1467–1472. doi: 10.1212/wnl.43.8.1467. [DOI] [PubMed] [Google Scholar]
- Shahani N, Subramaniam S, Wolf T, Tackenberg C, Brandt R. Tau aggregation and progressive neuronal degeneration in the absence of changes in spine density and morphology after targeted expression of Alzheimer’s disease-relevant tau constructs in organotypic hippocampal slices. J Neurosci. 2006;26:6103–6114. doi: 10.1523/JNEUROSCI.4245-05.2006. [DOI] [PMC free article] [PubMed] [Google Scholar]
- Siegmund KD, Langholz B, Kraft P, Thomas DC. Testing linkage disequilibrium in sibships. Am J Hum Genet. 2000;67:244–248. doi: 10.1086/302973. [DOI] [PMC free article] [PubMed] [Google Scholar]
- Slooter AJC, Cruts M, Kalmijn S, Hofman A, Breteler MM, Van Broeckhoven C, van Duijn CM. Risk estimates of dementia by apolipoprotein E genotypes from a population-based incidence study: the Rotterdam Study. Arch Neurol. 1998;55:964–968. doi: 10.1001/archneur.55.7.964. [DOI] [PubMed] [Google Scholar]
- Smith CAB. Testing for heterogeneity of recombination fractions values in human genetics. Ann Hum Genet. 1963;27:175–182. doi: 10.1111/j.1469-1809.1963.tb00210.x. [DOI] [PubMed] [Google Scholar]
- Storey JD. A direct approach to false discovery rates. J R Statist Soc B. 2002;64:479–498. [Google Scholar]
- Strittmatter WJ, Weisgraber KH, Huang DY, Dong L-M, Salvesen GS, Pericak-Vance MA, Schmechel D, Saunders AM, Goldgaber D, Roses AD. Binding of human apolipoprotein E to synthetic amyloid β peptide: isoform-specific effects and implications for late-onset Alzheimer disease. Proc Natl Acad Sci USA. 1993;90:8098–8102. doi: 10.1073/pnas.90.17.8098. [DOI] [PMC free article] [PubMed] [Google Scholar]
- Thornton-Wells TA, Moore JH, Haines JL. Genetics, statistics and human disease: analytical retooling for complexity. Trends Genet. 2004;20:640–647. doi: 10.1016/j.tig.2004.09.007. [DOI] [PubMed] [Google Scholar]
- Thornton-Wells TA, Moore JH, Haines JL. Dissecting Trait Heterogeneity: A Comparison of Three Clustering Methods Applied to Genotypic Data. BMC Bioinformatics. 2006;7:204. doi: 10.1186/1471-2105-7-204. [DOI] [PMC free article] [PubMed] [Google Scholar]
- Velez DR, White BC, Motsinger AA, Bush WS, Ritchie MD, Williams SM, Moore JH. A balanced accuracy function for epistasis modeling in imbalanced datasets using multifactor dimensionality reduction. Genet Epidemiol. 2007;31:306–315. doi: 10.1002/gepi.20211. [DOI] [PubMed] [Google Scholar]
- Wisniewski T, Golabek A, Matsubara E, Ghiso J, Frangione B. Apolipoprotein E: binding to soluble Alzheimer beta-amyloid. Biochem Biophys Res Comm. 1993;192:359–365. doi: 10.1006/bbrc.1993.1423. [DOI] [PubMed] [Google Scholar]
- Yang Y, Varvel NH, Lamb BT, Herrup K. Ectopic cell cycle events link human Alzheimer’s disease and amyloid precursor protein transgenic mouse models. J Neurosci. 2006;26:775–784. doi: 10.1523/JNEUROSCI.3707-05.2006. [DOI] [PMC free article] [PubMed] [Google Scholar]