

Abstract
The two species of Pan, bonobos and common chimpanzees, have been reported to have different social organization, cognitive and linguistic abilities and motor skill, despite their close biological relationship. Here, we examined whether bonobos and chimpanzee differ in selected brain regions that may map to these different social and cognitive abilities. Eight chimpanzees and eight bonobos matched on age, sex and rearing experiences were magnetic resonance images scanned and volumetric measures were obtained for the whole brain, cerebellum, striatum, motor-hand area, hippocampus, inferior frontal gyrus and planum temporale. Chimpanzees had significantly larger cerebellum and borderline significantly larger hippocampus and putamen, after adjusting for brain size, compared with bonobos. Bonobos showed greater leftward asymmetries in the striatum and motor-hand area compared with chimpanzees. No significant differences in either the volume or lateralization for the so-called language homologs were found between species. The results suggest that the two species of Pan are quite similar neurologically, though some volumetric and lateralized differences may reflect inherent differences in social organization, cognition and motor skills.
Keywords: brain evolution, bonobos, chimpanzees, laterality, cognition
Introduction
The human species' closest evolutionary relatives are chimpanzees (Pan troglodytes) and bonobos (Pan paniscus). Indeed, Although humans broke off from both of these Pan species 5–7 million years ago (mya), bonobos and chimpanzees shared a common ancestor as recently as 1–2 mya [Fischer et al., 2004; Won & Hey, 2005]. Chimpanzees and bonobos are so similar, that as recently as 1933 they were considered the same species, and bonobos were frequently designated as the “pygmy chimpanzee” [e.g. Kortland, 1997].
Of the two species, chimpanzees have generally been the focus of scientists, likely owing to the relative availability of this species compared with bonobos. The vast majority of cognitive, behavioral and neuroanatomical studies have been done with chimpanzees, with relatively little information on the bonobo. However, even with the relative scarcity of bonobo data, both species have shown similar cognitive abilities, including: symbolic acquisition [Brakke & Savage-Rumbaugh, 1995a,b; Lyn, 2007], symbol ordering [Greenfield & Savage-Rumbaugh, 1990; Lyn et al., 2009], representational (pretend) play [Lyn et al., 2006] and mirror self-recognition [Gallup, 1970; Hyatt and Hopkins, 1994]. Although the physical resemblance and the recently recorded cognitive similarities are manifest, the two species have markedly different social structure and behavioral patterns [de Waal, 1989; Stanford, 1998].
Studies in captivity and in the wild show that bonobo society is decidedly matriarchal, as opposed to the alpha-male dominated chimpanzee society. Bonobos are also reported to be more tolerant and possibly more cooperative than chimpanzees [Hare, 2007; Hare et al., 2007]. There are also a greater number of detailed reports of tool manufacture and use in chimpanzees, leading some experts to declare bonobo culture less “material” [McGrew, 1992], suggesting a strong difference in social organization between the species. However, differences in tool use might also be explained by differences in motor functions. In a task designed to assess grip morphology and motor skill of the left and right hands [Hopkins et al., 2002b; Hopkins & Russell, 2004] chimpanzees have been observed to use either thumb–index, middle–index or single digit grips. However, it has been reported that bonobos only use the thumb–index grip [Christel, 1994], suggesting a possible motoric difference between the species.
In contrast, the reports of communication abilities suggest that though both species are highly communicative, bonobos may have a somewhat more flexible communicative system [Pika et al., 2005; Pollick & de Waal, 2007]. Studies of gesture in zoo environments and in the wild have found more gestures used in more contexts than have been found in similar chimpanzee populations [Pika et al., 2005; Pollick & de Waal, 2007]. Studies of artificial communicative systems in both species support the possibility of more flexible communication in the bonobo, with a bonobo learning symbols faster and using more symbols than a paired chimpanzee [Brakke & Savage-Rumbaugh, 1995a,b].
Despite the marked behavioral differences in communication and social organization between chimpanzees and bonobos, decidedly little has been done to assess potential neuroanatomical differences between these two species that may underlie them. Several recent studies have examined different aspects of neural organization between great apes (including bonobos and chimpanzees) and humans including the relative size of the cerebellum [MacLeod et al., 2003; Rilling & Insel, 1998], white matter connectivity in the prefrontal cortex [Rilling & Insel, 1999a,b; Schoenemann et al., 2005], relative size of the frontal and temporal lobes [Rilling & Seligman, 2002; Semendeferi & Damasio, 2000; Semendeferi et al., 2002], the cortical organization of areas 10 and 13 within the frontal lobe [Semendeferi et al., 1998, 2001], cellular organization of the frontal operculum [Schenker et al., 2007, 2008, 2009], but none of these studies explicitly focused on comparing the two species of Pan.
Given the very close evolutionary relationship between the two species of Pan, one would not necessarily hypothesize that significant differences in their brain structures would be evident. However, given their very different social and behavioral makeup, particularly in the domain of communication, it could be argued that differences might be evident in brain areas associated with the communication, such as the homologs to the human language centers including the planum temporale (PT) and inferior frontal gyrus (IFG). Recently studies in chimpanzees have reported population-level leftward asymmetries in these regions [Cantalupo & Hopkins, 2001; Cantalupo et al., 2003; Gannon et al., 1998; Hopkins et al., 2008; Taglialatela et al., 2006] and one goal of this study was to examine whether the two species of Pan differ in the volume and organization of these two brain regions.
In addition, in this study we compared chimpanzees and bonobos on several other brain regions involved in motor functions including the cerebellum, motor-hand area of the precentral gyrus and structures within the striatum (caudate and putamen). Behavioral studies in captive and wild chimpanzees and bonobos suggest that differences in motor functions are apparent with, for instance, tool use that is widespread in chimpanzees and less apparent in bonobos. In contrast, when considering grasping morphology and skill, it has been suggested that prehensile grasping, particularly involving the thumb and index finger, are more pronounced in bonobos compared with chimpanzees [Christel et al., 1998]. Thus, we sought to test whether differences in primary motor regions of the brain might differ between chimpanzees and bonobos based on the extant behavioral data.
Hippocampus differences have been reported between chimpanzees and gorillas [Sherwood et al., 2004] and it has been hypothesized that the relative increase in chimpanzee hippocampus size is related to ecological demands placed on the chimpanzees in the wild. As the hippocampus has been related to spatial memory and the consolidation of memory [e.g. Hassabis et al., 2009; Maguire et al., 2000], it might be hypothesized that home range size might be associated with increased hippocampal size. Indeed, home ranges of chimpanzees can be extremely large—possibly as large as 760 km2 at least in savanna living individuals [Ogawa et al., 2007]. In contrast, home ranges of bonobos have not been estimated to be larger than 32 km2 [Hashimoto et al., 1998], so it might predict that chimpanzees will also have larger hippocampi than bonobos.
Methods
Subjects
Matched sample
Magnetic resonance images (MRI) scans were collected in eight captive bonobos including four males and four females. The bonobos aged in range from 7 to 40 years of age. MRI scans from eight chimpanzees matched on age, sex, rearing history and scanning protocol were collected for comparison between the two species. Within the postmortem specimens, we also attempted to match the cadaver brains on the duration of time that they had been in fixative before scanning. All the chimpanzees and four of the bonobos were members of a captive colony housed at Yerkes National Primate Research Center (YNPRC) in Atlanta, Georgia. Two of the remaining bonobos were members of the colony housed at the Language Research Center of Georgia State University, one bonobo was housed at the Columbus Zoo and one housed at the Milwaukee Zoo. All scanning procedures were approved by the Institutional Animal Care and Use Committee of Emory University. American Psychological Association guidelines for the ethical treatment of animals were adhered to during all aspects of this research.
Normative chimpanzee subjects
In addition to the matched-design analyses, we also compared the bonobo data to a larger cohort of chimpanzee subjects for which MRI scans are available and for which we have previously published volumetric and laterality data for a number of the brain regions assessed in this study. The “normative” chimpanzee sample consisted of 112 chimpanzees including 67 females and 45 males, respectively. Within the normative sample, there were 27 brains scanned postmortem and 85 were scanned in vivo. All subjects were scanned in vivo or postmortem utilizing the same procedures to be described for the matched-design. It should be noted that the exact number of chimpanzees used to derive the normative data varied somewhat between measures depending on whether the requisite landmarks could be identified for each individual brain.
Image Collection and Procedure
Within each species of Pan, MRI scans were obtained from cadaver specimens and in vivo. The cadaver specimens (n = 4) were stored in a solution of water and 10% buffered formalin for intervals ranging from 1 week to 5 years and were scanned with a 4.7 or 7.0 Tesla magnet (Bruker, BioSpec, Billerica, MA). All of the postmortem brain scans were of apes that died from natural causes and in absolutely no case was euthanasia used in this study. For the in vivo scans (n = 4), subjects were first immobilized by ketamine injection (10 mg/kg) and subsequently anaesthetized with propofol (40–60 mg/(kg/hr)) following standard procedures at the YNPRC. Subjects were then transported to the MRI facility. The subjects remained anaesthetized for the duration of the scans as well as the time needed to transport them between their home cage and the imaging facility (total time ∼2 hr). Subjects scanned in vivo were placed in the scanner chamber in a supine position with their head fitted inside the human-head coil. Scan duration ranged between 40 and 60 min as a function of brain size. Subjects were scanned using a 1.5 Tesla scanner (Phillips, Model 51, Bothell, WA) and T1-weighted images were collected in the transverse plane using a gradient echo protocol (pulse repetition = 19.0 msec, echo time = 8.5 msec, number of signals averaged = 8, and a 256 × 256 matrix). For the four postmortem scans, T2-weighted images were collected in the transverse plane using a gradient echo protocol (pulse repetition = 22.0 sec, echo time = 78.0 msec, number of signals averaged = 8–12, and a 256 × 192 matrix reconstructed to 256 × 256).
After completing MRI procedures, the subjects scanned in vivo were returned to the YNPRC and temporarily housed in a single cage for 6–12 hr to allow the effects of the anesthesia to wear off, after which they were returned to their home cage. The archived MRI data were transferred to a PC running Analyze 7.0 (Mayo Clinic, Mayo Foundation, Rochester, MN) software for postimage processing.
Brain Regions
Each of the brain scans were aligned in the axial, coronal and sagittal views along the AC-PC line and virtually sliced into 1 mm sections. Volumes and lateralization were measured for six regions including the caudate, putamen, cerebellum, hippocampus, motor-hand area of the precentral gyrus, IFG and PT. Tracing of each brain region was done using the free hand tool within Analyze 7.0 software. Individuals tracing the brains were blind to the sex and age of the apes. Although the tracers were not blind to the species of the apes, they were blind to the hypotheses of the study. Before collection of the data, inter-rater reliability in the measurement of each brain region was established between two raters [Cantalupo et al., 2003, 2008; Freeman et al., 2004; Hopkins & Cantalupo, 2004]. To assess inter-rater reliability, two individuals measured all both brain regions for ten individual chimpanzees. In all cases, the volume measures of the left and right hemispheres were correlated within each individual chimpanzee between the two raters and the corresponding coefficients were all significant at P<0.05 (all r values >0.90).
Brain Volume
Total brain volumes were determined for each subject. This was accomplished using an automated thresholding function within ANALYZE that initially strips the skulls, then created a 3-D reconstruction of the entre brain. Brain volumes included white and gray matter, ventricles as well as the cerebellum but not brain stem structures.
Cerebellum
The left and right cerebellar hemispheres were delineated following a procedure similar to that employed by Snyder et al. [1995] with human subjects and by Cantalupo and Hopkins [2009] in chimpanzees. A line was traced from the dorsal to the ventral aspect of the vermis and fourth ventricle (when visible) bisecting them. The cerebellar peduncles and fourth ventricle were excluded, whereas the vermis, the hemispheric gray matter, cerebellar tonsils, vellum and corpus medullare were included in the tracing of each cerebellar hemisphere (see Fig. 1).
Fig. 1.
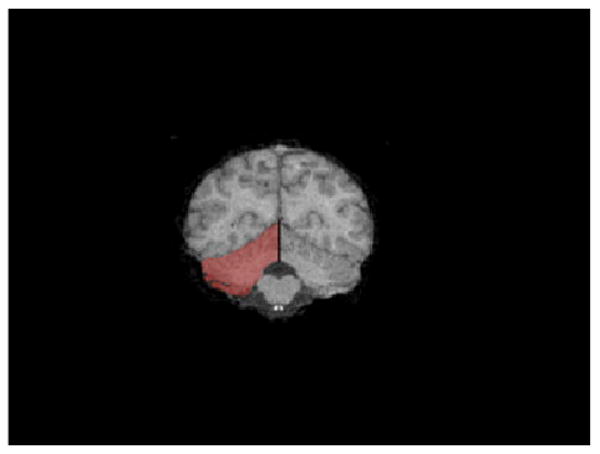
Coronal view of the tracing of the right cerebellum (red).
The anterior border of the cerebellum was defined by the slice in which tissue belonging to the anterior pole of the cerebellum may be first seen, whereas the posterior border was the most posterior slice showing tissue belonging to the posterior pole of the cerebellum. The anterior and posterior borders were often found on different slices for left and right cerebellar hemispheres.
Hippocampus
We followed the procedure used by Sherwood et al. [2004] and Freeman et al. [2004] in tracing the hippocampus. The hippocampal formation, including the dentate gyrus, hippocampus proper and subiculum was measured as a single structure (see Fig. 2). The mesial boundary of the hippocampus was defined where the subiculum transitions into the parahippocampal gyrus. We traced the hippocampus starting at the posterior end where the fornix first came in/was visible and ending anteriorly on the first slice where the ventricles (temporal horns of the lateral ventricles) where no longer bilaterally visible.
Fig. 2.
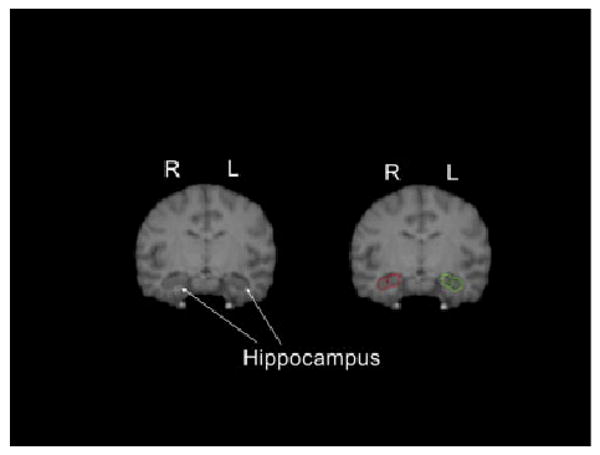
Coronal view of tracing of the hippocampus of the left and right hemisphere. Left panel show the regions untraced and the right panel shows the region traced on the same slice.
Striatum and Motor-Hand Area
Caudate
Following the procedure used by Matochik et al. [2000] with rhesus monkeys, tracings were conducted in the coronal plane, and began at the posterior border, when the anterior commissure became visible and continued anteriorly until the caudate was no longer visible. The third ventricle served as the medial border, whereas the internal capsule served as the lateral border. The superior border was the corpus callosum. The raters traced the caudate on the left and right separately in the coronal view on the MRI images (see Fig. 3).
Fig. 3.
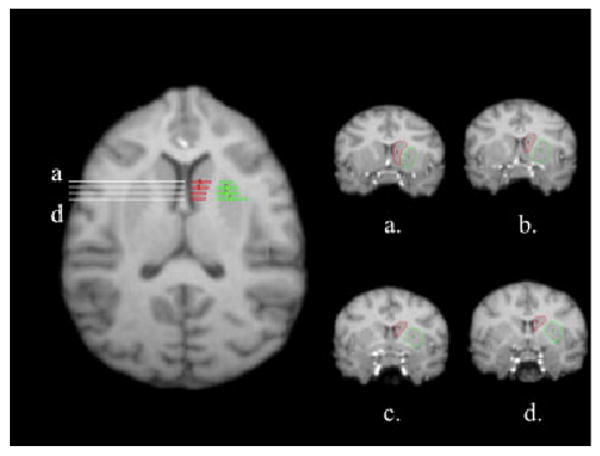
Transaxial view of the chimpanzees with corresponding lines to indicate regions along the anterior–posterior axis representing the caudate (red) and putamen (green). From a to d, coronal views of the tracing of the caudate (refs) and putamen (green) on different slices along the anterior–posterior gradient (a–d). The caudate is outlined in the left hemisphere.
Putamen
Tracing for the putamen began when the anterior commissure was first visible in the coronal plane and continued slice by slice anteriorly until the putamen was no longer visible. The white matter tract representing the internal capsule served as the medial border, whereas the external capsule and insula served as the medial border. Raters traced the left putamen separately from the right putamen (see Fig. 3). The globus pallidus was excluded in the measurements because it could not be seen reliably in a majority of specimens. When it was visible, we were careful not to include the globus pallidus in the tracing of the putamen.
Motor-hand area of the precentral gyrus (knob)
The knob was localized in serial 1 mm slices in the axial plane following procedures similarly used in human and great ape brain specimens [Hopkins & Pilcher, 2001; Yousry et al., 1997] The knob was defined as a horizontal epsilon or inverted omega that projects into the postcentral gyrus (see Fig. 4a). The dorsal and ventral edges of the knob served as markers for defining the boundaries of the area. To derive a volume of the knob for each hemisphere, the area traced on all scans was summed and multiplied by the number of axial slices in which the knob could be identified (ranging from 5 to 13 slices in each hemisphere).
Fig. 4.
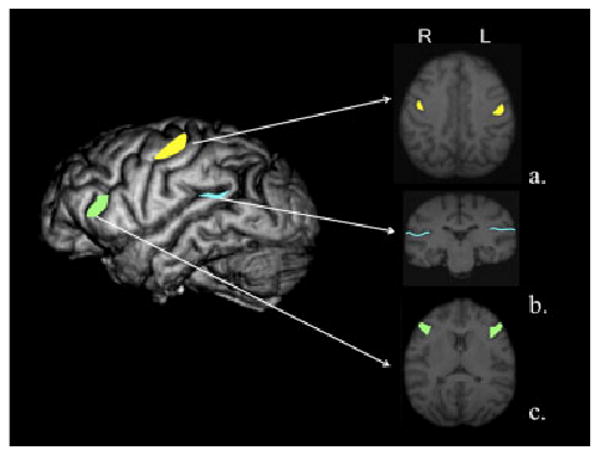
Left panel shows a 3D reconstruction of a chimpanzee indicating the motor-hand region (knob) in yellow, the inferior frontal gyrus (IFG) in green, and the planum temporale (PT) in cyan in the dorsal–ventral plane. Right panels show (a) 1 mm slice in the axial plane with the motor-hand area traced on the slice (yellow). (b) 1 mm slice in the axial plane with the inferior frontal gyrus traced on the slice (green). (c) 1 mm slice in the coronal plane with the sylvian fissure traced on the slice (cyan).
Language Homologs
Inferior frontal gyrus
The ROI method used to estimate the IFG was performed in the axial plane following the procedures outlined by Hopkins et al. [2008]. The posterior border of the IFG was the precentral inferior sulcus (PCI) and the anterior border was the fronto-orbital sulcus (FO) (see Fig. 4b). The entire gyrus between these two sulci was traced with the edge of the brain serving as the lateral border, whereas the medial ends of the PCI and FO served as the medial borders. The areas were traced on successive 1 mm slices and the area measures were summed across slices to derive a volume of the IFG for the left and right hemispheres. Both PCI and FO had to be present to trace the gyrus lying between these two sulci.
Planum temporale
Following the procedure of Cantalupo et al. [2003], to measure the surface area of PT, the MRI scans were aligned in the coronal plane and cut into 1 mm slices (see Fig. 4c). The anterior border of PT was defined by the most frontal slice showing Heschl's gyrus (HG). The posterior border was defined by the most caudal slice showing the Sylvian fissure (horizontal ramus). Once the anterior and posterior borders were delineated, the depth of SF (i.e. width of PT) on each slice was measured from the superolateral margin of the superior temporal gyrus. Depth measures were taken up to the lateral ridge of HG in all the slices where HG was present (normally, HG was no longer present in slices proximal to the posterior border of PT). Following a well-established procedure in the human literature, an estimate of the PT surface areas (in mm2) was computed as the sum of the cumulative PT depth measures for each slice within a hemisphere multiplied by the slice thickness.
Data Analysis
For all brain regions, we summed the area measures across all slices to derive a volume (mm3) for the left and right hemisphere. The left and right hemispheres volumes were summed to derive a total volume. To adjust for differences in the brain size, the volumes of each region were divided by the total brain volume to obtain a ratio in size. The ratio calculation was applied to all brain regions with the exception of the PT, which can only be measured as the area of the flat surface of the posterior temporal lobe, thus is scaled differently than the other regions. In addition, for each brain region, asymmetry quotients (AQ) were derived following the formula AQ = [(R−L)/(R+L)*0.5] with R and L represented the summed area volumes for the right and left hemispheres, respectively. Positive values indicated right hemisphere asymmetry and negative values indicated left hemisphere asymmetries.
Results
Volumes
Shown in Table I are the mean volumes and standard deviations for each brain region. We initially performed a multivariate analysis of variance (MANOVA) with each brain region ratio serving the dependent variables and species serving as the between-group factor (brain region/whole brain volume). This analysis revealed a significant effect of species F(6, 9) = 5.636, P<0.02. Subsequent univariate F-tests indicated significant species differences for the cerebellum F(1, 14) = 10.385, P<0.01 and borderline significant differences for the hippocampus F(1, 14) = 3.99, P<0.07 and putamen F(1, 14) = 3.65, P<0.08. For all three regions, the chimpanzees had larger ratios compared with the bonobos.
TABLE I. Mean and Standard Deviation (in parentheses) for the Different Brain Structures Quantified in Bonobos (n = 8) and Chimpanzees (n = 8).
| Region | Bonobo | Chimpanzee |
|---|---|---|
| Inferior frontal gyrus | 1513.92 (178.78) | 1557.53 (205.19) |
| Planum temporale | 311.25 (11.25) | 315.02 (6.88) |
| Motor-hand area | 450.76 (81.86) | 476.94 (64.79) |
| Hippocampus | 2385.87 (115.14) | 2582.59 (164.66) |
| Caudate | 2982.20 (280.46) | 2996.64 (168.88) |
| Putamen | 3594.71 (432.40) | 4389.62 (332.16) |
| Cerebellum | 39.19 (3.34) | 51.73 (2.96) |
| Brain volume | 400.37 (9.06) | 371.45 (21.47) |
Values are presented in mm3 accept brain volume and cerebellum which are in cm3. Values in parentheses are standard errors terms.
Asymmetries
We next compared the AQ values for each brain region and the mean values for each species are shown in Figure 5. As with the analysis of the volumes, we initially performed a MANOVA with AQ values for each brain region serving as dependent measure while species was the between-group factor. An overall significant main effect for species was found F(5, 10) = 9.56, P<0.001. Univariate F-tests indicated significant species differences for the knob F(1, 14) = 4.48, P<0.05, putamen F(1, 14) = 8.73, P<0.01, caudate F(1, 14) = 40.07, P<0.001 and hippocampus F(1, 14) = 4.93, P<0.04. Bonobos showed significantly greater leftward asymmetries for all four brain regions compared with the chimpanzees (see Fig. 5).
Fig. 5.
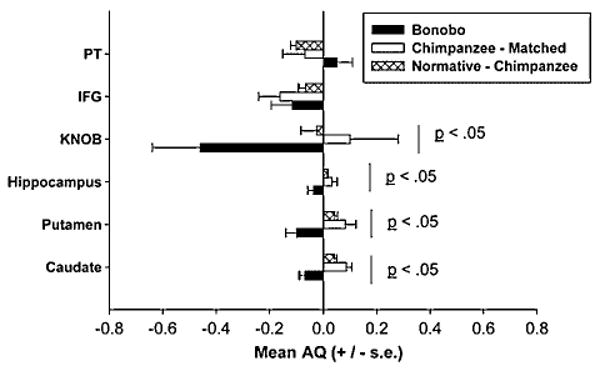
Mean AQ values (+/− s.e.) for each brain region of interest (with the exception of the cerebellum). Values are reported for bonobo, matched chimpanzees and the normative chimpanzee sample.
Normative Comparison
We also compared the mean volume and AQ values for the bonobos to the normative data for chimpanzees generated from a larger cohort of individuals. This analysis was done to assess whether, for some reason, the brain data for the matched chimpanzee subjects were in some way not representative of the species. For these analyses, one sample t-tests were performed with the mean ratio or AQ value for the “normative” chimpanzee sample serving as the population estimate of the specific trait. The values for the bonobos were then compared with these estimated parameters.
Significant volumetric differences were found for the cerebellum t(7) = 2.52, P<0.04 and hippocampus t(7) = 3.33, P<0.02. Bonobos had smaller ratios in the size of the cerebellum and hippocampus compared with the chimpanzees. In terms of lateralization, as with the matched design analysis, the bonobos showed significantly greater leftward asymmetries for the caudate t(7) = 7.936, P<0.01, putamen t(7) = 4.370, P<0.02, hippocampus t(7) = 2.07, P<0.07 and the motor-hand area t(7) = 5.339, P<0.01 compared with the AQ data from the normative chimpanzee data.
Discussion
Owing to the small number of bonobos represented, this is a preliminary study of potential neuroanatomical differences between bonobos and chimpanzees. The most consistent significant allometric differences in the various regions of interest were found for the cerebellum and hippocampus with chimpanzees having larger values relative to brain size compared with the bonobos. With respect to lateralization, the main and most consistent differences between chimpanzees and bonobos were in lateralization in three motor regions including the caudate, putamen and motor-hand area. For all three regions, the bonobos showed a greater leftward asymmetry compared with the chimpanzees. The hippocampus results were less consistent but the trend was also for the bonobos to show a greater leftward asymmetry for this region compared with the chimpanzees. Bonobos and chimpanzees did not differ in either volume or lateralization for any of the so-called homologs to the human language areas.
With respect to the volumetric differences in the cerebellum, studies in human subjects have clearly shown that the cerebellum is involved in motor learning, balance and complex motor actions [Baillieux et al., 2008]. In studies of chimpanzees, we have previously found that variation in handedness for tool use, but not other motor actions, are associated with lateralization in the cerebellum [Cantalupo et al., 2008]. More recently, we have also found that chimpanzees who have learned to reliably throw have significantly larger cerebella than chimpanzees who do not throw, suggesting that experiential factors can influence the size of the cerebellum or alternatively, that certain patterns of neural organization within the cerebellum facilitate the acquisition of certain motor skills [Cantalupo & Hopkins, 2009]. Chimpanzees are very well known for their tool using abilities in both the wild and captivity [Candland, 1987; McGrew, 1992; Nishida & Hiraiwa, 1982; Sugiyama, 1995; Van Schaik et al., 1999; Whiten et al., 1999], which stands in contrast to bonobos for which there is much less evidence of tool use, particularly in the wild. Thus, the larger cerebellum relative to brain size in chimpanzees might account for their enhanced expression of tool using abilities compared with bonobos. In fairness to the bonobos, there have been far fewer and less sustained observations of their behavior in the wild, thus any conclusions regarding their inherent tool using abilities should be interpreted with some caution.
The evidence of greater leftward asymmetries in the caudate, putamen and motor-hand area in the bonobos was not anticipated and warrants some discussion. With respect to the caudate and putamen, these brain areas are involved in voluntary motor movements and some have suggested are critical subcortical regions involved in the motor sequencing of actions underlying human language and speech [Lieberman, 2007]. Indeed, Lieberman had argued that the caudate and putamen are critical structures in the language circuit of the human brain and that the role of cortical structures, such as Broca's and Wernicke's areas, have been overstated in the human clinical and neuropsychological literature. Further evidence of the role of the caudate, in particular, in the motor control of language and speech come from recent findings on the FOXP2 gene. Individuals with mutations in the FOXP2 exhibit what has been described as oro-facial dyspraxia, or a deficit in the motor control of voluntary oro-facial movements associated with speech [Vargha-Khadem et al., 2005]. Structural and fMRI studies have shown disruption in the left caudate of individuals with mutations in the FOXP2. Given the role that the caudate plays in oro-facial movements, it is tempting to speculate that the bonobos may show greater oro-facial motor control compared with chimpanzees and that this difference in control might be associated with changes in the lateralization and function of the caudate. It has been reported that bonobos have a very different vocal repertoire than chimpanzees but whether they possess better motor control of their oro-facial movements and/or vocal cords is not clear from the existing literature.
With respect to the motor-hand area of the precentral gyrus, previous studies in humans, chimpanzees and monkeys have shown that variation in lateralization of this structure is associated with handedness [Dadda et al., 2006; Hopkins & Cantalupo, 2004; Phillips & Sherwood, 2005; Yousry et al., 1997]. Though there are many more studies on handedness in chimpanzees than bonobos, the general pattern of results between these two species are not all that different for some measures [De Vleeschouwer et al., 1995; Harrison & Nystrom, 2008; Hopkins, 2006; Hopkins & de Waal, 1995; Hopkins et al., 1993; Shafer, 1997]. If we assume that the asymmetry data reflect the inherent hand preferences of the subjects, it would suggest that most if not all of the bonobos in this study were right handed. Unfortunately, we did not have handedness data for these subjects, so this issue remains unresolved. Ideally, matching the bonobos and chimpanzees on their handedness would be a better way of parsing out any potential species differences in lateralization in the motor-hand area.
Alternatively, the differences in lateralization within the motor-hand area, caudate and putamen may reflect inherent differences in motor skill for manual actions. As noted above, there is some evidence that bonobos show very different grasping morphology compared with chimpanzees. For example, Christel et al. [1998] have reported that bonobos use almost exclusively the thumb and index finger when grasping small food items, which differs from chimpanzees, who frequently grasp small food items between the index and middle finger as well as employing the thumb–index grasp. In our studies, we have collected grasping data on seven bonobos when picking up small food items and have found similar results to those by Christel et al. [1998]. In our sample, 85% of the grasping responses of the bonobos used the thumb and index finger, which stands in contrast to chimpanzees for which the percentage was 54% for thumb–index finger grasping [Hopkins et al., 2002a].
We found no evidence of differences in either the volume or lateralization of the IFG or PT. Thus, despite reported differences in the flexibility of communication (e.g. faster symbolic learning and more flexible use of gesture in the bonobo) between bonobos and chimpanzees, these abilities were not reflected in variation among cortical regions of the brain likely involved in these functions [Pika & Mitani, 2006; Pika et al., 2005; Pollick & de Waal, 2007]. Ultimately, given the functional homogeneity of these regions in humans and likely in nonhuman primates, any differences in anatomy may not be sufficiently large to detect. Rather, differences in connectivity may lie at the heart of behavioral differences between bonobos and chimpanzees. For example, Rilling et al. [2008] have recently used diffusion tensor imaging to visualize white matter connectivity in regions of the parietal, frontal and temporal regions of humans, chimpanzees and monkeys. Rilling et al. noted significant differences in temporal lobe regions, which they argue potentially underlie differences in semantic networks between human and nonhuman primates. Similar types of connectivity differences may potentially differentiate bonobo and chimpanzee linguistic abilities and should be pursued in future studies.
Similarly, recent studies in primates suggest that cerebellar connectivity within associative areas of the cerebral cortex may be crucially involved in the control of complex aspects of behavior such as language and tool use [Baillieux et al., 2008; Ramnani, 2006]. Along this line, the finding that common chimpanzees have larger cerebella and seem to engage more in tool use compared with bonobos would lead us to expect similar species-specific differences in the degree of connectivity of the cerebellum with associative cortical areas (particularly prefrontal and premotor cortex), with common chimpanzees showing a greater degree of overall cerebellar–cerebral connectivity than bonobos.
As for the hippocampal differences, the relative increase in size in the chimpanzee may be related to its relatively larger home range, which would place a greater demand on the species' spatial memory [Hashimoto et al., 1998; Hassabis et al., 2009; Maguire et al., 2000; Ogawa et al., 2007]. As chimpanzees also have a larger hippocampus relative to brain size than gorillas [Sherwood et al., 2004], one could speculate that the evolutionary pressure to develop better spatial memory occurred after the chimpanzee split from the bonobo that is 1–2 mya. This extremely recent change might be reflected in the chimpanzees being better able to perform spatial behavioral tasks and direct comparisons of great apes on spatial memory tasks might be a direction for future cognitive research.
In sum, overall, the chimpanzee and bonobo brains are remarkably similar, as would be expected from two such closely related species. The differences we detected did not always follow our predictions, but these differences point the way to further studies that may illuminate further the neural and cognitive evolutionary paths taken by our closest relatives.
Acknowledgments
This research was supported in part by NIH grants NS-42867 and HD-56232. The Yerkes Center is fully accredited by the American Association for Accreditation of Laboratory Animal Care. American Psychological Association guidelines for the ethical treatment of animals were adhered to during all aspects of this study. We are grateful to the helpful assistance of the entire veterinary staff at the Yerkes Center for their assistance in collection of the MRI scans. We also thank Drs. Patrick Hof, Chet Sherwood and John Allman for providing a copy of one of the bonobo scans.
Contract grant sponsor: NIH grants; Contract grant numbers: NS-42867; HD-56232.
References
- Baillieux H, De Smet HJ, Paquier PF, De Deyn PP, Marien P. Cerebellar neurocognition: insights into the bottom of the brain. Clin Neurol Neurosurg. 2008;110:763–773. doi: 10.1016/j.clineuro.2008.05.013. [DOI] [PubMed] [Google Scholar]
- Brakke KE, Savage-Rumbaugh ES. The development of language skills in bonobo and chimpanzee—i. comprehension. Lang Commun. 1995a;15:121–148. [Google Scholar]
- Brakke KE, Savage-Rumbaugh ES. The development of language skills in Pan—ii. production. Lang Commun. 1995b;16:361–380. [Google Scholar]
- Candland D. Tool use. In: Mitchell G, Erwin JM, editors. Comparative primate biology; Vol 2, Part B: behavior, cognition and motivation. New York: Alan R. Liss; 1987. pp. 85–103. [Google Scholar]
- Cantalupo C, Hopkins WD. Asymmetric Broca's area in great apes. Nature. 2001;414:505. doi: 10.1038/35107134. [DOI] [PMC free article] [PubMed] [Google Scholar]
- Cantalupo C, Hopkins WD. The cerebellum and its contribution to complex tasks in higher primates: A comparative perspective. Cortex. 2009 doi: 10.1016/j.cortex.2009.10.004. [DOI] [PubMed] [Google Scholar]
- Cantalupo C, Pilcher D, Hopkins WD. Are planum temporale and sylvian fissure asymmetries directly related? A MRI study in great apes. Neuropsychologia. 2003;41:1975–1981. doi: 10.1016/s0028-3932(02)00288-9. [DOI] [PubMed] [Google Scholar]
- Cantalupo C, Freeman HD, Rodes W, Hopkins WD. Handedness for tool use correlates with cerebellar asymmetries in chimpanzees (Pan troglodytes) Behav Neurosci. 2008;122:191–198. doi: 10.1037/0735-7044.122.1.191. [DOI] [PMC free article] [PubMed] [Google Scholar]
- Christel MI. Catarrhine primates grasping small objects: techniques and hand preferences. In: Anderson JR, Roeder JJ, Thierry B, Herrenschmidt N, editors. Current primatology vol. III: behavioral neuroscience, physiology and reproduction. Strasbourg: Universite Louis Pasteur; 1994. pp. 37–49. [Google Scholar]
- Christel MI, Kitzel S, Niemitz C. How precisely do bonobos (Pan paniscus) grasp small objects? Int J Primatol. 1998;19:165–194. [Google Scholar]
- Dadda M, Cantalupo C, Hopkins WD. Further evidence of an association between handedness and neuroanatomical asymmetries in the primary cortex of chimpanzees (Pan troglodytes) Neuropsychologia. 2006;44:2482–2486. doi: 10.1016/j.neuropsychologia.2006.03.037. [DOI] [PMC free article] [PubMed] [Google Scholar]
- de Vleeschouwer K, Van Elsacker L, Verheyen RF. Effects of posture on hand preferences during experimental food reaching in bonobos (Pan paniscus) J Comp Psychol. 1995;109:203–207. doi: 10.1037/0735-7036.109.2.203. [DOI] [PubMed] [Google Scholar]
- de Waal FBM. Behavioral contrasts between bonobo and chimpanzee. In: Heltne PG, Marquardt LA, editors. Understanding chimpanzees. Cambridge, MA: Harvard University Press; 1989. pp. 154–175. [Google Scholar]
- Fischer A, Wiebe V, Pääbo S, Przeworski M. Evidence for a complex demographic history of chimpanzees. Mol Biol Evol. 2004;21:799–808. doi: 10.1093/molbev/msh083. [DOI] [PubMed] [Google Scholar]
- Freeman HD, Cantalupo C, Hopkins WD. Asymmetries in the hippocampus and amygdala of chimpanzees (Pan troglodytes) Behav Neurosci. 2004;118:1460–1465. doi: 10.1037/0735-7044.118.6.1460. [DOI] [PMC free article] [PubMed] [Google Scholar]
- Gallup GG. Chimpanzees: self-recognition. Science. 1970;167:86–87. doi: 10.1126/science.167.3914.86. [DOI] [PubMed] [Google Scholar]
- Gannon PJ, Holloway RL, Broadfield DC, Braun AR. Asymmetry of chimpanzee planum temporale: humanlike pattern of Wernicke's language area homolog. Science. 1998;279:220–222. doi: 10.1126/science.279.5348.220. [DOI] [PubMed] [Google Scholar]
- Greenfield PM, Savage-Rumbaugh ES. Grammatical combination in Pan paniscus: processes of learning and invention in the evolution and development of language. In: Parker ST, Gibson KR, editors. Language and intelligence in monkeys and apes: comparative developmental perspectives. New York, NY: Cambridge University Press; 1990. pp. 540–578. [Google Scholar]
- Hare B. From nonhuman to human mind. What changed and why? Curr Dir Psychol Sci. 2007;16:60–64. [Google Scholar]
- Hare B, Melis AP, Woods V, Hastings S, Wrangham R. Tolerance allows bonobos to outperform chimpanzees on a cooperative task. Curr Biol. 2007;17:619–623. doi: 10.1016/j.cub.2007.02.040. [DOI] [PubMed] [Google Scholar]
- Harrison RM, Nystrom P. Handedness in captive bonobos (Pan paniscus) Folia Primatol. 2008;79:253–268. doi: 10.1159/000113539. [DOI] [PubMed] [Google Scholar]
- Hashimoto C, Tashiro Y, Kimura D, Enomoto T, Ingmanson EJ, Idani Gi, Furuichi T. Habitat use and ranging of wild bonobos (Pan paniscus) at Wamba. Int J Primatol. 1998;19:1045–1060. [Google Scholar]
- Hassabis D, Chu C, Rees G, Weiskopf N, Molyneux PD, Maguire EA. Decoding neuronal ensembles in the human hippocampus. Curr Biol. 2009;19:1–9. doi: 10.1016/j.cub.2009.02.033. [DOI] [PMC free article] [PubMed] [Google Scholar]
- Hopkins WD. Comparative and familial analysis of handedness in great apes. Psychol Bull. 2006;132:538–559. doi: 10.1037/0033-2909.132.4.538. [DOI] [PMC free article] [PubMed] [Google Scholar]
- Hopkins WD, Cantalupo C. Handedness in chimpanzees is associated with asymmetries in the primary motor but not with homologous language areas. Behav Neurosci. 2004;118:1176–1183. doi: 10.1037/0735-7044.118.6.1176. [DOI] [PMC free article] [PubMed] [Google Scholar]
- Hopkins WD, de Waal FBM. Behavioral laterality in captive bonobos (Pan paniscus): replication and extension. Int J Primatol. 1995;16:261–276. [Google Scholar]
- Hopkins WD, Pilcher DL. Neuroanatomical localization of the motor hand area with magnetic resonance imaging: the left hemisphere is larger in Great Apes. Behav Neurosci. 2001;115:1159–1164. [PMC free article] [PubMed] [Google Scholar]
- Hopkins WD, Russell JL. Further evidence of a right hand advantage in motor skill by chimpanzees (Pan troglodytes) Neuropsychologia. 2004;42:990–996. doi: 10.1016/j.neuropsychologia.2003.11.017. [DOI] [PubMed] [Google Scholar]
- Hopkins WD, Bennett A, Bales S, Lee J, Ward JP. Behavioral laterality in captive bonobos (Pan paniscus) J Comp Physiol. 1993;107:403–410. doi: 10.1037/0735-7036.107.4.403. [DOI] [PubMed] [Google Scholar]
- Hopkins WD, Cantalupo C, Wesley MJ, Hostetter A, Pilcher D. Grip morphology and hand use in chimpanzees (Pan troglodytes): evidence of a left hemisphere specialization in motor skill. J Exp Psychol Gen. 2002a;131:412–423. doi: 10.1037//0096-3445.131.3.412. [DOI] [PMC free article] [PubMed] [Google Scholar]
- Hopkins WD, Cantalupo C, Wesley MJ, Hostetter AB, Pilcher D. Grip morphology and hand use in chimpanzees (Pan troglodytes): evidence of a left hemisphere specialization in motor skill. J Exp Psychol Gen. 2002b;131:412–423. doi: 10.1037//0096-3445.131.3.412. [DOI] [PMC free article] [PubMed] [Google Scholar]
- Hopkins WD, Taglialatela JP, Meguerditchian A, Nir T, Schenker NM, Sherwood CC. Gray matter asymmetries in chimpanzees as revealed by voxel-based morphometry. NeuroImage. 2008;42:491–497. doi: 10.1016/j.neuroimage.2008.05.014. [DOI] [PMC free article] [PubMed] [Google Scholar]
- Hyatt CW, Hopkins WD. Self-awareness in bonobos and chimpanzees: a comparative perspective. In: Parker ST, Mitchell RW, Boccia ML, editors. Self-awareness in animals and humans: developmental perspectives. New York, NY: Cambridge University Press; 1994. pp. 248–253. [Google Scholar]
- Kortland A. Pygmy chimpanzee, bonobo, or gracile chimpanzee: what's in a name? Afri Primates. 1997;3:28–35. [Google Scholar]
- Lieberman P. The evolution of human speech: its anatomical and neural bases. Curr Anthropol. 2007;48:39–66. [Google Scholar]
- Lyn H. Mental representation of symbols as revealed by vocabulary errors in two bonobos (Pan paniscus) Anim Cogn. 2007;10:461–475. doi: 10.1007/s10071-007-0086-3. [DOI] [PubMed] [Google Scholar]
- Lyn H, Greenfield PM, Savage-Rumbaugh ES. The development of representational play in chimpanzees and bonobos: evolutionary implications, pretense, and the role of interspecies communication. Cogn Dev. 2006;21:199–213. [Google Scholar]
- Lyn H, Greenfield PM, Savage-Rumbaugh ES. First Language. 2009. Semiotic combinations in Pan: a cross-species comparison of communication in a chimpanzee and a bonobo. [Google Scholar]
- MacLeod CE, Zilles K, Schleicher A, Rilling JK, Gibson KR. Expansion of the neocerebellum in Hominoidea. J Hum Evol. 2003;44:401–429. doi: 10.1016/s0047-2484(03)00028-9. [DOI] [PubMed] [Google Scholar]
- Maguire EA, Gadian DG, Johnsrude IS, Good CD, Ashburner J, Frackowiak RS, Frith CD. Navigation-related structural change in the hippocampi of taxi drivers. Proc Natl Acad Sci. 2000;97:4398–4403. doi: 10.1073/pnas.070039597. [DOI] [PMC free article] [PubMed] [Google Scholar]
- Matochik JA, Chefer SI, Lane MA, Woolf RI, Morris ED, Ingram DK, Roth GS, London ED. Age-related decline in striatal volume in monkeys as measured by magnetic resonance imaging. Neurobiol Aging. 2000;21:591–598. doi: 10.1016/s0197-4580(00)00134-2. [DOI] [PubMed] [Google Scholar]
- McGrew WC. Chimpanzee material culture: implications for human evolution. Cambridge: Cambridge University Press; 1992. [Google Scholar]
- Nishida T, Hiraiwa M. Natural history of toolmaking behavior by wild chimpanzees in feeding upon wood-bearing ants. J Hum Evol. 1982;14:73–99. [Google Scholar]
- Ogawa H, Idani Gi, Moore J, Pintea L, Hernandez-Aguilar A. Sleeping parties and nest distribution of chimpanzees in the Savanna Woodland, Ugalla, Tanzania. Int J Primatol. 2007;28:1397–1412. [Google Scholar]
- Phillips K, Sherwood CS. Primary motor cortex asymmetry correlates with handedness in capcuhin monkeys (Cebus apella) Behav Neurosci. 2005;119:1701–1704. doi: 10.1037/0735-7044.119.6.1701. [DOI] [PubMed] [Google Scholar]
- Pika S, Mitani JC. Referential gestural communication in wild chimpanzees (Pan troglodytes) Curr Biol. 2006;16:R191–R192. doi: 10.1016/j.cub.2006.02.037. [DOI] [PubMed] [Google Scholar]
- Pika S, Liebal K, Tomasello M. The gestural repertoire of bonobos (Pan paniscus) flexibility and use. Am J Primatol. 2005;65:39–61. doi: 10.1002/ajp.20096. [DOI] [PubMed] [Google Scholar]
- Pollick AS, de Waal FMB. Ape gestures and language evolution. Proc Natl Acad Sci. 2007;104:8184–8189. doi: 10.1073/pnas.0702624104. [DOI] [PMC free article] [PubMed] [Google Scholar]
- Ramnani N. The primate cortico-cerebellar system: structure and function. Nat Rev Neurosci. 2006;7:511–522. doi: 10.1038/nrn1953. [DOI] [PubMed] [Google Scholar]
- Rilling JK, Insel TR. Evolution of the cerebellum in primates: differences in relative volume among monkeys, apes and humans. Brain Behav Evol. 1998;52:308–314. doi: 10.1159/000006575. [DOI] [PubMed] [Google Scholar]
- Rilling JK, Insel TR. Differential expansion of neural projection systems in primate brain evolution. NeuroReport. 1999a;10:1453–1459. doi: 10.1097/00001756-199905140-00012. [DOI] [PubMed] [Google Scholar]
- Rilling JK, Insel TR. The primate neocortex in comparative perspective using magnetic resonance imaging. J Hum Evol. 1999b;37:191–223. doi: 10.1006/jhev.1999.0313. [DOI] [PubMed] [Google Scholar]
- Rilling JK, Seligman RA. A quantitative morphometric comparative analysis of the primate temporal lobe. J Hum Evol. 2002;42:505–533. doi: 10.1006/jhev.2001.0537. [DOI] [PubMed] [Google Scholar]
- Rilling JK, Glasser MF, Preuss TM, Ma X, Zhang X, Zhao T, Hu X, Behrens T. The evolution of the arcuate fasciculus revealed with comparative DTI. Nat Neurosci. 2008;11:426–428. doi: 10.1038/nn2072. [DOI] [PubMed] [Google Scholar]
- Schenker NM, Sherwood CC, Hof PR, Semendeferi K. Microstructural asymmetries of the cerebral cortex in humans and other mammals. In: Hopkins WD, editor. Evolution of hemispheric specialization in primates. London: Academic Press; 2007. [Google Scholar]
- Schenker NM, Buxhoeveden DP, Blackmon WL, Amunts K, Zilles K, Semendeferi K. A comparative quantitative analysis of cytoarchitecture and minicolumnar organization in Broca's area in humans and great apes. J Comp Neurol. 2008;510:117–128. doi: 10.1002/cne.21792. [DOI] [PubMed] [Google Scholar]
- Schenker NM, Hopkins WD, Spocter MA, Garrison A, Stimpson CD, Erwin JM, Hof PR, Sherwood CC. Broca's are homologue in chimpanzees (Pan troglodytes): probabilistic mapping, asymmetry and comparison to humans. Cerebral Cortex. 2009 doi: 10.1093/cercor/bhp138. [DOI] [PMC free article] [PubMed] [Google Scholar]
- Schoenemann PT, Sheehan MJ, Glotzer LD. Prefrontal white matter volume is disproportionately larger in humans than in other primates. Nat Neurosci. 2005;8:242–252. doi: 10.1038/nn1394. [DOI] [PubMed] [Google Scholar]
- Semendeferi K, Damasio H. The brain and its main anatomical subdivisions in living hominids using magnetic resonance imaging. J Hum Evol. 2000;38:317–332. doi: 10.1006/jhev.1999.0381. [DOI] [PubMed] [Google Scholar]
- Semendeferi K, Armstrong E, Schleicher A, Zilles K, Van Hoesen GW. Limbic frontal cortex in Hominoids: a comparative study of area 13. American. J Phys Anthropol. 1998;106:129–155. doi: 10.1002/(SICI)1096-8644(199806)106:2<129::AID-AJPA3>3.0.CO;2-L. [DOI] [PubMed] [Google Scholar]
- Semendeferi K, Armstrong E, Schleicher A, Zilles K, Van Hoesen GW. Prefrontal cortex of humans and apes: a comparative study of area 10 American. J Phys Anthropol. 2001;114:224–241. doi: 10.1002/1096-8644(200103)114:3<224::AID-AJPA1022>3.0.CO;2-I. [DOI] [PubMed] [Google Scholar]
- Semendeferi K, Lu A, Schenker NM, Damasio H. Humans and great apes share a large frontal cortex. Nat Neurosci. 2002;5:272–276. doi: 10.1038/nn814. [DOI] [PubMed] [Google Scholar]
- Shafer DD. Hand preference behaviors shared by two groups of captive bonobos. Primates. 1997;38:303–313. [Google Scholar]
- Sherwood CC, Cranfield MR, Mehlman PT, Lilliy AA, Garbe JL, Whittier CA, Nutter FB, Rein TR, Bruner HJ, Holloway RL, Tang CY, Naidich TP, Delman BN, Steklis HD, Erwin JM, Hof PR. Brain structure variation in great apes, with attention to the mountain gorilla (Gorilla beringei beringei) Am J Primatol. 2004;63:149–164. doi: 10.1002/ajp.20048. [DOI] [PubMed] [Google Scholar]
- Snyder PJ, Bilder RM, Wu H, Bogerts B, Lieberman JA. Cerebellar volume asymmetries are related to handedness: a quantitative MRI study. Neuropsychologia. 1995;33:407–419. doi: 10.1016/0028-3932(94)00125-9. [DOI] [PubMed] [Google Scholar]
- Stanford CB. The social behavior of chimpanzees and bonobos: empirical evidence and shifting assumptions. Curr Anthropol. 1998;39:399–420. [Google Scholar]
- Sugiyama Y. Tool-use for catching ants by chimpanzees at Bossou and Monts Nimba, West Africa. Primates. 1995;36:193–205. [Google Scholar]
- Taglialatela JP, Cantalupo C, Hopkins WD. Gesture handedness predicts asymmetry in the chimpanzee inferior frontal gyrus. NeuroReport. 2006;17:923–927. doi: 10.1097/01.wnr.0000221835.26093.5e. [DOI] [PMC free article] [PubMed] [Google Scholar]
- Van Schaik CP, Deaner RO, Merrill MY. The conditions for tool use in primates: implications for the evolution of material culture. J Hum Evol. 1999;36:719–741. doi: 10.1006/jhev.1999.0304. [DOI] [PubMed] [Google Scholar]
- Vargha-Khadem F, Gadian DG, Copp A, Mishkin M. FOXP2 and the neuroanatomy of speech and language. Nat Rev Neurosci. 2005;6:131–138. doi: 10.1038/nrn1605. [DOI] [PubMed] [Google Scholar]
- Whiten A, Goodall J, McGrew WC, Nishida T, Reynolds V, Sugiyama Y, Tutin CEG, Wrangham RW, Boesch C. Cultures in chimpanzees. Nature. 1999;399:682–685. doi: 10.1038/21415. [DOI] [PubMed] [Google Scholar]
- Won YJ, Hey J. Divergence population genetics of chimpanzees. Mol Biology Evol. 2005;22:297–307. doi: 10.1093/molbev/msi017. [DOI] [PubMed] [Google Scholar]
- Yousry TA, Schmid UD, Alkadhi H, Schmidt D, Peraud A, Buettner A, Winkler P. Localization of the motor hand area to a knob on the precentral gyrus. A new landmark. Brain. 1997;120:141–157. doi: 10.1093/brain/120.1.141. [DOI] [PubMed] [Google Scholar]