

Abstract
Techniques that map the distribution of compounds in biological tissues can be invaluable in addressing a number of critical questions in biology and medicine. One of the newest methods, mass spectrometric imaging, has enabled investigation of spatial localization for a variety of compounds ranging from atomics to proteins. The ability of mass spectrometry to detect and differentiate a large number of unlabeled compounds makes the approach amenable to the study of complex biological tissues. This chapter focuses on recent advances in the instrumentation and sample preparation protocols that make mass spectrometric imaging of biological samples possible, including strategies for both tissue and single cell imaging using the following mass spectrometric ionization methods: matrix-assisted laser desorption/ionization, secondary ion, electrospray and desorption electrospray.
I. Introduction
The intrinsic chemical and structural complexities of biological tissues and cells present significant analytical measurement challenges. Microscopy has long been considered one of the most powerful techniques to study the distribution of biologically relevant compounds in tissues. Chemical images of analyte distributions in biological specimens have been made possible via affinity labeling with antibodies or other chemical labels/stains in combination with optical microscopy. In fact, these imaging approaches have a several centuries-long history.
More recently, the last century has witnessed the development of the exceptionally effective chemical characterization approach known as mass spectrometry (MS). Using modern MS techniques, a small volume sample can be assayed and information on literally thousands of compounds observed. Can these two approaches—imaging and MS—be successfully combined to achieve even greater information content? As documented throughout this chapter, this combined imaging approach is now being used to examine a wide range of tissues and biological processes.
In general, MS imaging (MSI) techniques include a spatially-resolved ionization method to collect mass spectra from an array of positions across a sample. Following data acquisition, the intensities of selected signals from the mass spectra are each plotted to create a pixel array and hence, an ion image or distribution map for the individual signal/compound (Figure 1). The high level of spatial and chemical information afforded by MSI enables the distribution of many compounds to be imaged in a single experiment without the need for prior knowledge of the identity of the analyte(s) of interest.
Figure 1.

Overview of MSI. A series of complete mass spectra are taken in an ordered array across the sample. The intensity of the signal for selected compounds of interest are then plotted following data acquisition to create a series of ion images. (Reprinted with permission from reference (Rohner et al. 2005).)
At present, research efforts are actively directed towards furthering the development and application of MSI to study a broader range of compounds in tissues. Just as there are a number of optical techniques from which to choose for a particular application, different MS approaches are available for characterizing the varying types of analytes, with many of these methods adaptable to MSI. For example, secondary ion mass spectrometry (SIMS) imaging is often used to study the distribution of atoms and small molecules in tissues and even single cells at spatial resolutions below a micron. Matrix-assisted laser desorption/ionization (MALDI) MSI has become a popular imaging method for examining small molecules, peptides and proteins from a variety of tissue sections at a wide range of spatial resolutions and scales, including whole animal preparations (Khatib-Shahidi et al. 2006). Recently, imaging techniques using electrospray ionization (ESI) and desorption electrospray ionization (DESI) have been developed as alternate methods for the direct analysis of tissues at atmospheric pressure (Takats et al. 2004b).
Beyond higher resolution imaging, low resolution spatial profiling of tissues is also useful for understanding the localization of compounds in a tissue sample, particularly via MALDI MS. In all cases of MSI, the chemical information content is high but the data is at a lower spatial resolution than what is commonly afforded by optical microscopy. This chapter focuses on experimental strategies aimed at creating visual distribution maps of an analyte across a sample rather than profiling the sample at discrete points.
MSI relies on the desorption and ionization of biologically relevant compounds from structurally and biochemically heterogeneous samples. Many of the fixation approaches developed for optical and electron microscopy are not compatible with MSI and so new MS-specific protocols have been designed. As will be discussed in more detail later, care must be taken to ensure that analytes retain their native form and distribution within the samples. Mass spectra are obtained directly from the tissue surface (or in the case of MALDI MS, a thin coat of matrix on the tissue) such that the distribution of analytes resembles their in vivo state and the observed result is biologically relevant. The imaging approaches outlined in this chapter largely involve the in situ analyses of compounds from biological samples using the high vacuum instrumentation inherent to MS, although progress towards in vivo analyses has been made using the DESI ionization scheme (Takats et al. 2004b).
In addition to MS-compatible preparation protocols, an overview of each of the various ionization techniques (MALDI, SIMS, ESI, DESI) is presented, with further details available elsewhere (Gross and Caprioli 2007). While it seems obvious that selecting the ideal MS ionization methodology is important, it is the significance of choosing the appropriate sample preparation protocol that is consistently cited as being the key to experimental success. The optimal protocol depends, to some extent, on the nature of the tissue sample (Schwartz et al. 2003). In the following sections, we highlight the instruments and sample preparation processes associated with MSI experiments, and briefly discuss the strategies used to analyze and visualize the large datasets that are associated with these investigations.
II. Instrumentation
Although spatial analysis of biological tissues with MSI employs a vast range of mass spectrometers and associated instrumentation, each mass spectrometer is conceptually similar in that it contains an ionization source, a mass analyzer, and a detector. Here we describe the available mass spectrometer configurations and provide guidance in selecting the most appropriate set-up for a particular MSI experiment.
A. MALDI MS
Laser-desorption MS has been used to profile tissues since the 1970s. However, the largest molecules that could be ionized were typically less than 1000 Da. The refined method of MALDI MS, introduced by Karas and Hillenkamp (Karas and Hillenkamp 1988) and Tanaka (Tanaka et al. 1988) in the latter portion of the 1980s, can ionize higher molecular weight biomolecules, owing to the minimal analyte fragmentation induced during the desorption and ionization processes.
In this methodology, the sample is prepared by mixing it with a matrix. Although most MALDI applications use a solid organic matrix, a variety of liquid and solid matrices have been introduced, including glycerol and derivatives of benzoic and cinnamic acids. During the measurement process, the matrix absorbs nanoseconds-long ultraviolet (UV) or infrared (IR) laser pulses that resonantly excite the matrix, causing extremely rapid localized heating and subsequent ejection of neutral and charged analyte molecules, atoms, matrix molecules and analyte–matrix clusters. UV lasers are commonly used in MSI applications (Rohner et al. 2005) although IR lasers have been applied (Luxembourg et al. 2005; Li et al. 2007; Taban et al. 2007). Analyte ionization occurs after laser irradiation while the analyte is in the MALDI matrix crystals or in the expanding plume. Primarily, the result is singly-charged ions, either positive [M + H]+ or negative [M − H]−. The sample stage, laser, and mass analyzer are the key components in the MALDI instrument set-up.
Sample stage
In MALDI MSI, images are acquired by moving, or rastering, the sample in a controlled manner under a fixed-position laser beam. The sample movement (on the stage) must be both precise and accurate at small length-scales. This is not often an issue as modern translation stages can move in submicron steps with high reproducibility. However, many imaging experiments are performed on MALDI instruments not designed for imaging and so their stage movements may not be as accurate or precise as desired. Often, ion images must be overlaid on an optical image of the sample to assist in matching chemical information to morphological features, which may exacerbate any discrepancies in stage motion. The introduction of an ion microscope, where specialized optics are used to create ion images of the whole sample at once, eliminates the need for sample movement (Luxembourg et al. 2004).
Laser
Selecting a laser and its operating parameters is important to the success of a MALDI MSI experiment. The laser beam diameter can limit the maximal spatial resolution of images to the beam spot-size. Both UV and IR lasers have been used for imaging with remarkable results. Whereas UV irradiation is certainly more common and provides a smaller beam diameter, IR lasers offer some additional advantages, one of which is the ability to use a different family of matrices that includes water/ice.
The two most common UV lasers for MALDI MSI include the nitrogen (337 nm) and the frequency-tripled Nd:YAG lasers (355 nm). Both lasers can be focused to spot sizes considerably below 50 μm. Although the range of 50–100 μm is the common spot size, the use of additional focusing elements can further reduce the size of the probed area (Garrett et al. 2007). To increase the spatial resolution of an imaging experiment, an alternative approach uses only a portion of the beam profile to ionize a sample by oversampling the raster pattern (Jurchen et al. 2005). Briefly, this method involves completely ablating the MALDI matrix coat at each sample position before moving the sample to the next position. If the movement is smaller than the diameter of the laser beam, signals only originate from the portion of the laser beam profile that overlaps with the non-ablated portion of the sample surface. Using this method, images have been obtained at a spatial resolution of 15 μm with a 100 × 200 μm laser beam, as shown in Figure 2 (Jurchen et al. 2005).
Figure 2.

MALDI-MS images of the peptide angiotensin I (m/z 1297) on electron microscopy calibration grids (100 μm hole-to-hole spacing), obtained using an oversampling technique at raster sizes of (a) 100 μm, (b) 50 μm, (c) 25 μm, and (d) 15 μm, illustrate the utility of oversampling to resolve small features in the sample. (Reprinted with permission from reference (Jurchen et al. 2005).)
Nitrogen lasers have been commonly used for MALDI MSI due, in part, to their relatively low cost and strong performance in providing quality mass spectra. In addition, a vast amount of research and development regarding sample preparation strategies has been performed with MS instruments equipped with a nitrogen laser. The low pulse rate (3–20 Hz) of the older N2 lasers is a significant time constraint when tens to hundreds of thousands of laser shots are necessary to produce an image. Newer nitrogen lasers like the Nd:YAG are able to operate faster, approaching the >200 Hz repetition rates of solid state lasers. The frequency-tripled Nd:YAG, a diode-pumped solid-state laser, is attractive for high-throughput applications, such as proteomics or imaging, for both its robustness (>109 shot lifetime) and high repetition rate.
Overall, the Nd:YAG laser’s performance has been favorable; however, it produces results inferior to nitrogen lasers in some applications. For instance, with the MALDI matrix sinapinic acid, the results are not as good as with a comparable nitrogen laser, but similar results are obtained from both lasers when using α-cyano-4-hydroxycinnamic acid (CHCA) as the matrix. Lower laser powers and slightly defocused beams can reduce one negative aspect of the highly efficient Nd:YAG laser—fast sample consumption. Promising work to improve the performance of solid-state lasers for MALDI to that of a nitrogen laser has focused on structuring and modulating the Nd:YAG beam, with great success (Holle et al. 2006).
While the use of UV lasers is nearly ubiquitous in MALDI MSI, other lasers have unique benefits and are worthy of consideration. For example, IR lasers such as Er:YAG (2.94 μm) enable the use of matrices such as native frozen water (Berkenkamp et al. 1996) and frozen tissue, as well as glycerol (Menzel et al. 2002; Leisner et al. 2004), which is often employed as a preservative/stabilization compound during sample dissection and storage (Rubakhin et al. 2003). IR-MALDI also produces a low degree of metastable ion fragmentation and an analytical mass range similar to that of UV-MALDI; however, the long wavelength and difficulty in focusing the laser to the small spot-size present challenges for higher spatial resolution MSI experiments using traditional scanning microprobe analyses. Fiber optics (Garrett et al. 2007), near field (Spengler and Hubert 2002), or the mass microscope (Luxembourg et al. 2004) help to alleviate these challenges and enable tissue imaging without the addition of acidic matrices that alter the physiological conditions of the sample.
Mass analyzer
A large variety of mass analyzers are available for MS. Because of the pulsed nature of laser ionization, its high repetition rate, and the large mass range provided, MALDI MSI requirements are met by the analytical figures of merit of time-of-flight (ToF) instruments. MSI has also been adapted to several other mass analyzers including the ion trap, hybrid quadrupole ToF, and Fourier-transform (FT) (Taban et al. 2007). As we discuss each mass analyzer, special focus on their application to MSI experiments will be included.
In ToF mass measurements, ions are accelerated to a constant kinetic energy and move into a field-free region. The ions separate while traveling along the flight tube because smaller ions have a higher velocity than larger molecules. What limits the resolution obtainable? During formation, ions have a range of kinetic energies causing a spread of flight times; using a reflectron, this effect is reduced and a higher resolution spectrum results. ToF instruments are commonly used in MSI because of their high sensitivity, mass range, and duty cycle.
The addition of fragmentation capabilities to a ToF instrument not only enhances the confidence of analyte identification, it enables the identification of unknown signals via de novo or database-guided sequencing of peptides or proteins. Sequential ToFs (sometimes known as ToF/ToFs), like other tandem methods, are becoming more common for MALDI. Using fragment signals acquired across a sample in MSI can also assist in detection of compounds of similar mass. This is particularly beneficial for the study of small molecules such as drugs and their metabolites in specific tissues (Hsieh et al. 2006) and in the whole animal (Khatib-Shahidi et al. 2006).
Another mass analyzer used with MALDI is the ion trap, which confines ions to a specific region by applying a radio frequency potential to the trapping electrodes. To detect the ions, the radio frequency potential is ramped or a supplemental voltage is applied to the endcap electrodes to sequentially eject the ions from the trap. Ion traps are well suited for analyzing small to moderate molecular weight molecules with MALDI, but the reduced mass-to-charge ratio (m/z) range prevents the investigation of large proteins. In addition, the lower duty-cycle of ion traps increases image acquisition time, an important consideration when an image consists of tens of thousands individual mass spectra. However, unlike ToF instruments, ion traps enable multiple levels of analyte fragmentation (MSn) to increase the amount of information available when identifying an unknown (Cha and Yeung 2007; Drexler et al. 2007). Further, ion traps tend to be less expensive than other mass analyzers. These characteristics make them attractive for MSI experiments of compounds with masses below several kilodaltons.
Hybrid ion trap or quadrupole ToF mass spectrometers place a quadrupole mass filter or ion trap between the ion source and the flight tube. In this case, the ion trap is used to filter and store ions before sending them into the ToF portion of the analyzer for mass separation and analysis. These instruments tend to have higher mass accuracy than ToF-only instruments and have the added benefit of MSn capabilities; multiple fragmentation cycles may occur in the ion trap with the resulting fragments being sent to the ToF for analysis.
The FT mass spectrometer is the highest performance mass analyzer discussed here. FT mass spectrometers separate and detect ions in an ion cyclotron in the presence of a large magnetic field. The motion of the ions in the cyclotron induces a periodic signal from the detection plates. Because this ion motion is a function of the m/z, the frequency of the induced signals may be deconvolved by applying a Fourier transform to produce a mass spectrum. The advantages of this approach include the high mass accuracy and precision obtainable. Why aren’t most imaging experiments performed using FT MS? FT mass spectrometers require a large superconducting magnet, resulting in higher instrument cost. In addition, the limited mass range for singly-charged analytes and the longer spectral acquisition time for ion accumulation/detection are considerations when using FT MS for imaging. Of course, the high mass resolution enables compounds with similar mass to be differentiated and imaged (Taban et al. 2007).
Although the ToF has been the predominant mass analyzer used in MALDI MSI, the adaptation of multiple mass analyzers to imaging has expanded the range of applications amenable to MSI. Commercial MALDI mass spectrometers now commonly have imaging capabilities, and several instruments originally designed for other applications may be fitted with commercial MALDI sources. Each analyzer has specific benefits and shortcomings when applied to imaging applications; thus, instrument selection is based on the needs of the experiment.
Mass analyzers are often used in conjunction with other off-line, non-imaging strategies. For instance, serial sections adjacent to an imaged tissue section can be collected, homogenized, and analyzed with liquid chromatography (LC) MS in order to increase the quantity of analyte available for identification via MS/MS studies (Han and Schey 2006).
B. SIMS
Among all of the ionization techniques used in MSI, SIMS may be the original approach, having been documented as early as 1910, with imaging of tissues reported in the 1960s (Honig 1985). In SIMS, the impact of a primary ion beam penetrates several nanometers into a sample, thereby causing the ejection, or sputtering, of material that may include atoms, clusters of atoms, and molecular fragments. The penetration depth and amount of ejected matter is determined largely by selection of the specific primary ion source (Szakal et al. 2006), and will be discussed further in this section. Unlike MALDI MS, this ionization mechanism tends to be rather harsh and has, until recently, somewhat limited SIMS imaging to the analysis of atoms and smaller molecular ions. However, recent advances in both sample preparation and instrumentation (notably improved primary ion sources) have greatly expanded the mass range and sensitivity of SIMS measurements.
Primary ion source
Just as in MALDI MS, the first stage of the experiment is the generation of ions. Because the characteristics of the primary ion beam often determine overall performance, selecting the appropriate source is important. A wide variety of primary ion sources have been developed over the years including Ar+, Xe+, O2+, Cs+, In+, Au+, Ga+, He3+, SF6+, CO2+, C2F6+, Aux+ and Bix+ cluster ions and C60+ (buckminsterfullerene). Of these sources, Ga+, Aux+, Bix+ and C60+ are most commonly used for biological studies. Recent developments and the availability of several of these sources (e.g., Aux+, Bix+, C60+) have greatly expanded the mass range and sensitivity of SIMS imaging experiments, making the imaging of molecular and pseudo-molecular ions from tissues and even isolated cells attractive. Nonetheless, the other ion sources still provide valuable tools to study the distribution of atomics or isotopically-labeled compounds.
Besides the identity of the primary ion sources, the size of the beam and the primary ion flux, which are typically interdependent, influence the spatial resolution and duration of an imaging experiment. Unlike the laser pulses used in MALDI MSI, the primary ion beam is readily focused to well below a micrometer in diameter for most sources, and is rastered across the sample rather than moving the sample under an ionizing beam. This both speeds analyses and reduces the impact of irregularities in sample stage movement, allowing high spatial resolution images to be obtained. Most imaging experiments are performed below the “static limit” such that the primary ion dosage is less than 1013 primary ion impacts/cm2. This limit aims to prevent the gross sputtering of the sample by impacting only ~1% of the sample surface. Beyond the static limit, the surface of the sample begins to erode, which enables depth profiling of the sample. Although depth profiling is useful for hard materials, biological tissue depth profiling has been complicated by several issues including molecular fragmentation (Debois et al. 2007). Even so, several examples have been reported, such as depth profiling of Xenopus oocytes with the C60 source (Fletcher et al. 2007). As can be expected, approaching the static limit greatly benefits the sensitivity of analyses as it more completely samples the surface.
Mass analyzers
Owing to the high repetition rates typically used for SIMS, only a few mass analyzers are appropriate for these imaging experiments. ToF mass spectrometers are most commonly used for molecular imaging, although dynamic SIMS instruments often include a sector mass analyzer, which employs an electric or magnetic field to filter ions on their flight towards a detector or array of detectors. The deflection magnitude depends on m/z, with lighter, faster moving ions being deflected more. If a single detector is used, the electric/magnetic field may be ramped or scanned to sequentially detect analytes. When investigating an individual analyte, the field is kept constant to continuously detect the analyte. Alternatively, in a selective-ion monitoring mode, a series of detectors may be used to monitor several ions at once. Sector mass spectrometers, often used for atomic analyses, have been applied to imaging human hair (Gillen et al. 1999), the distribution of boron neutron capture therapy drugs (Lorey et al. 2001), and human brain sections (Candy et al. 1992).
The ToF instruments applied in SIMS imaging experiments operate on the same principles as discussed previously, with several utilizing a standard ToF arrangement for mass analysis. Alternatively, the TRIFT line of SIMS mass spectrometers from Physical Electronics employ a series of three electrostatic analyzers (ESAs) along the ion flight path to account for kinetic energy differences among the ions. To compensate for the small velocity differences of individual ions, three 90° turns in the ion path function much like the reflectron described earlier by causing ions of different kinetic energy, but with the same nominal m/z, to travel slightly longer or shorter paths before reaching the detector (Schueler et al. 1990; Szakal et al. 2006).
ESAs also enable stigmatic imaging experiments. Unlike the microprobe methodology of chemical imaging, the stigmatic imaging capabilities enable TRIFT spectrometers to serve as chemical microscopes. This is accomplished by desorbing ions from a relatively large region of a sample all at once, thus retaining the spatial distribution of the ions during mass separation, prior to their detection with a position-sensitive detector (Luxembourg et al. 2004). Recently adapted to MALDI MSI, this approach enables an entire sample to be imaged for each laser or ion pulse. Although the summation of multiple laser shots greatly increases the fidelity of images, this method is currently limited to the imaging of a single analyte signal rather than the collection of a complete mass spectrum (McDonnell et al. 2005; Altelaar et al. 2006; Altelaar et al. 2007).
Other instrumentation considerations
Recognizing that the mass analyzer and primary ion source are the two most important instrument components, charge-compensating devices and temperature controls also may be beneficial for individual imaging experiments. A low energy electron flood-gun is often used to reduce sample charging that may occur during the experiment, which can greatly degrade mass resolution and secondary ion yield (Delcorte et al. 2003; Wittig et al. 2005). In addition, several sample preparation strategies have been developed to limit sample charging, and will be discussed later. The ability to control the temperature of the sample surface itself can also be of significant benefit. Cooled sample stages enable the use of frozen, hydrated samples and in situ freeze-fractured samples, both of which have shown great value in imaging experiments (Roddy et al. 2002a). The frozen water acts as a matrix to enhance secondary ion yields while freeze-fracturing protocols facilitate imaging of internal structures that may not otherwise be available for study, particularly in single cell analyses.
C. DESI and ESI
DESI and ESI ion sources are a relatively recent development for MSI, and are currently undergoing rapid advancement. Both DESI and ESI produce a constant flow of ions for analysis, with the ion trap mass analyzer being most commonly used for these MSI studies.
In DESI, perhaps the newest ionization approach applied to imaging, pneumatically assisted electrosprayed droplets of solvent are directed onto a sample surface that is analyzed at atmospheric conditions. The method requires minimal adaptation to existing mass spectrometers and unlike the previously discussed ionization methods, the DESI ionization source is relatively simple and may be readily constructed in house (Takats et al. 2004b). The basic set up is comprised of a pneumatically assisted micro-electrospray source, a positioning device, and often a sample holder/translation assembly for imaging purposes (Takats et al. 2005). The ion source consists of a stainless steel t-junction that enables a high pressure sheath gas to exit the source supersonically and coaxially, along with the electrosprayed solvent, via several fused silica capillaries, delivering both gas and solvent to the sample surface (Takats et al. 2003; Takats et al. 2004a). The sprayer should be mounted on a solid stage that enables its positioning in three dimensions and adjustment of the angle from the ion source to the surface. By placing the sample on its own translation stage, a continuous movement or raster/pixelation strategy may be used for MSI experiments. The various translational aspects facilitate the optimization of sprayer-to-mass spectrometer, sprayer-to-sample, and sample-to-mass spectrometer distances, as well as the angle from the source-to-sample and sample-to-source, while also enabling compensation for surface height or profile variations. Commercialized ion sources (Prosolia, Indianapolis, IN) also use several CCD cameras for angle and sample visualization (Takats et al. 2005).
Traditional ESI techniques have not been commonly used as ionization methodologies for MSI experiments, in part due to analyte collection concerns when using a liquid interface in a spatially distinct manner. Two methods have, however, been developed to accomplish these tasks. In the first, developed by Smith and co-workers (Petyuk et al. 2007), a brain slice was divided into an ordered array of samples that were individually digested in separate vials and analyzed. Because sample preparation is very important in this methodology, it will be discussed in further detail in the following sample preparation section.
In the second strategy, a sampling probe is used to apply small amounts of a liquid to a sample surface, then the liquid is pulled back through a central channel to an electrospray tip (Ford and Van Berkel 2004). The probe consists of nested capillaries whereby the eluting solvent is applied through the larger, exterior capillary and then drawn from the tissue surface in a continuous manner via the central capillary. The application of a solvent (such as 1:1 methanol:water) dissolves the analyte from the surface in the area directly under the probe. By scanning the surface in two dimensions via a series of line scans, the probe selectively scans the sample in a manner that enables the creation of ion images (Ford et al. 2005). In practice, the solvent is pushed through a 330-μm inner diameter capillary at 10–15 μL/min with a standard syringe pump and is collected back through a 127-μm inner diameter capillary (254-μm outer diameter). The analytes are then transferred towards an electrospray tip held at a high potential to induce electrospray. The probe is kept 20–50 μm above the sample surface. For imaging experiments, the sample may be moved under the probe at ~100 μm/sec to produce ~600 μm spatial resolution ion images (as defined by the sampling width of the probe) (Ford et al. 2005).
III. Sample Preparation for MSI
A. Sample Collection and Isolation
Traditionally, imaging experiments have focused on the analysis of thin tissue sections. In order to preserve tissue morphology as well as native distribution of analytes, tissues must be rapidly dissected following animal sacrifice and flash-frozen to inhibit enzymatic degradation and analyte redistribution. Immediately following dissection, the tissue is briefly (30–60 sec) submerged in a cryogenic liquid such as liquid nitrogen. Liquid nitrogen slushed–liquid propane is often used for its enhanced thermal conductivity and higher boiling point because it reduces freezing time. Alternatively, dry ice and ethanol may be used to freeze smaller tissues. The goal of these freezing protocols is to prevent enzymatic degradation as well as ice crystal formation. Sample cracking may be prevented by gently submerging the tissue and loosely wrapping it in aluminum foil to prevent it from adhering to the walls of a Dewar. Once frozen, tissues have been stored at −80 °C for more than a year with successful MSI after storage (Schwartz et al. 2003).
Once sample preparation is complete, the frozen tissues are then sectioned and transferred to a substrate suitable for MSI experiments. The intact tissue is first affixed to the cryostat stage using either a droplet of water or a small amount of optimal cutting temperature embedding media (OCT). Tissues should not be embedded in the OCT as its presence on the tissue sections, which can occur during sectioning, has been found to reduce ion formation and the quality of the mass spectra (Schwartz et al. 2003). This effect may be eliminated by using only a small amount of OCT to affix the tissue to the stage, taking care to ensure that the OCT does not contact the cut tissue face or microtome blade during sectioning, as in Figure 3. Note also that often a small film of oil is applied to separate individual microtome blades during packaging and should be removed by rinsing the blade with acetone or methanol to prevent any chemical contamination (Chaurand et al. 2006). If the tissue must be embedded to facilitate sectioning, a thin layer of water may be used to coat the sample in a thin layer of ice while the tissue is held at cutting temperatures, or embedded in agar to help preserve tissue morphology without degrading the quality of the mass spectra (Borner et al. 2007). The sections, 5–50 μm thick, are collected at −5 °C to −25 °C using a cryomicrotome. The exact temperature is tissue-dependant but typically is within this range of values. Although thicker sections are easier to collect and manipulate, thinner sections have been shown to provide higher quality mass spectra (Lemaire et al. 2006b). During sectioning, tissue orientation should be considered in order to ensure the section contains the morphological features of interest.
Figure 3.

Tissue processing. (a) Tissue oriented on a cryostat, prior to sectioning. (b) Sectioned tissues are then rinsed with ethanol and often (c) stained for histology (microphotograph of stained tissue is presented). (Reprinted with permission from reference (Chaurand et al. 2006).)
After sectioning, tissues must be transferred to a suitable sample plate for MS analyses, using one of several available methodologies. Commonly, the tissue is transferred to a cold sample plate or conductive ITO-coated glass slide using forceps for thicker sections or an artist’s brush for thinner sections. Care should be taken during transfer as a thin tissue slice is easily deformed. The tissue section is then thaw-mounted to the cold sample plate by quickly warming them together. There are a number of ways to accomplish this. The easiest is by placing a finger or hand on the opposite side of the sample plate and using body heat to warm the sample and sample plate together. In another, the sample may be warmed in a desiccator, taking care to prevent condensation when moving from the cryotome to the desiccator. Finally, a sample plate that is at room temperature may be placed directly on a tissue section, which then thaws onto the plate. Although the transfer methods are similar in nature, the cold plate transfer produces superior mass spectra as the transfer is quantitative, whereas the warm plate transfer often leaves a small amount of ice on the cryostat cutting surface, which may retain analyte (Schwartz et al. 2003). In the cold plate method, ice that contains water-soluble compounds is thawed on the sample plate so that these compounds remain with the tissue sample.
Although the majority of imaging experiments are performed using thin tissue sections, the sensitivity and resolution afforded by MSI experiments now enable the profiling and imaging of single, isolated or cultured cells. Isolation of single cells is useful when studying neural tissues, as individual cells often are chemically different from their immediate neighbors. As might be expected, the isolation of single cells from tissues is often non-trivial, but several protocols have been developed to assist with this process, including partial enzymatic degradation, glycerol stabilization, and fracturing methodologies for cell cultures.
In the case of larger, more physically stable cells, such as those found in the nervous system of several invertebrate neurobiological models, cells may be isolated after partial enzymatic digestion of the ganglionic sheath in a physiological solution containing 1% protease for 1–2.5 hours at 36 °C. Following sheath removal, cells are isolated using sharp needles or via suction from small glass or plastic pipettes and then transferred to a glass slide or other suitable mass spectrometer target (Rubakhin et al. 2003). Although samples for MALDI MSI may also be fixed in a 4% paraformaldehyde solution, cross-linking of the cellular membrane during the paraformaldehyde fixation may be detrimental to SIMS studies of the lipid membrane.
In contrast to invertebrate cells, the isolation of mammalian neurons is somewhat more involved as the cells are typically smaller than invertebrate neurons. To isolate single pituitary cells from rats, Rubakhin and co-workers (Rubakhin et al. 2006) used a physiological solution containing 30% glycerol to improve sample preparation and reduce the time required for isolation. A natural stabilizing agent, glycerol allows extracellular physiological solution to be removed without lysing the cells or significantly altering the biochemical profile of neurons (Miao et al. 2005). Following glycerol stabilization, cells may be mechanically separated with fine glass pipettes using micromanipulators under an inverted microscope.
In addition to isolating cells directly from tissues, cell culturing may also be of great value in MSI experiments. Glycerol stabilization may be applied to cultures in the same manner as the cell isolates. Cultures may also be flash-frozen and freeze-fractured or analyzed in a frozen-hydrated state (Ostrowski et al. 2004). Although these freezing protocols require the sample to be maintained in a frozen state, frozen samples may also be freeze dried. Alternatively, 50 mM trehalose may be added to the culture solution prior to freeze drying to create a condition similar to a freeze-fracturing protocol, precluding the need for the sample to remain frozen over the course of preparation and analysis (Parry and Winograd 2005).
B. Preparing the sample for MSI
Each of the various MSI approaches (MALDI, SIMS, DESI, ESI) has different ionization methods, and each works best with specific types of analytes. Thus, it should not be surprising that sample preparation methods are also distinct for each. In this section, the more common sample treatments are described for each of these ionization approaches.
MALDI MSI
MALDI MS requires that analytes from a tissue be incorporated into a thin matrix layer. The extraction of analytes without fixation/cross linking into the matrix often is accompanied by analyte migration. Thus, proper matrix application is one of the most important steps in the acquisition of high quality MALDI MSI from tissue. Of course, heterogeneities in ion yield across the sample can introduce significant experimental artifacts into the produced ion images.
Can we address these concerns by optimizing protocol parameters? Matrix deposition conditions, including matrix composition, concentration, method, and thickness of application, are important factors in developing a matrix application protocol. Choosing the right matrix often depends on the mass range of interest and the laser wavelength. For UV lasers, sinapinic acid (3,5-dimethoxy-4-hydroxycinnamic acid) performs well with higher mass analytes such as proteins, while CHCA performs well with compounds under ~3 kDa such as peptides. Due to a tendency to form large heterogeneous crystals, 2,5-dihydroxybenzoic acid (DHB) is less commonly used for imaging, with the exception of controlled spotting and crystallization in profiling experiments, which may be considered a low pixel count image (Lemaire et al. 2006a). The selected matrix is often dissolved in 1:1 acetonitrile:water or ethanol:water solutions, which is useful for a variety of thin tissue measurements and analytes of different solubilities (Schwartz et al. 2003). Matrix concentration and amount affects signal quality, crystal coverage, and crystal size. Often higher matrix:solvent ratios lead to larger crystals on the surface of the tissue section (Lemaire et al. 2006a). Sinapinic acid matrix, for instance, has an optimal concentration of ~10–30 mg/mL; signal quality often increases with concentration, with a saturated solution of 30 mg/mL providing better results (Schwartz et al. 2003). The other matrices tend to have an optimal concentration similar to that of the sinapinic acid.
Typically, other than ethanol washing, tissue processing is kept to a minimum. Washing increases the intensity of protein signal from 3- to 10-fold, depending on the specific sample. In ethanol washing, the target-affixed tissue is submerged in cold 70% HPLC grade ethanol for 30 s, followed by drying under a nitrogen stream. The precipitation of proteins from the solution increases their signal intensity and decreases the amount of protein delocalization that otherwise occurs while the sample is exposed to a liquid phase, thus preserving spatial resolution (Chaurand et al. 2006). To further increase signal quality, a second washing step in 90% ethanol, 9% glacial acetic acid, and 1% deionized water may also be used to help remove salts and phospholipids (Chaurand et al. 2006). However, the ethanol washing procedure may potentially remove desirable ethanol-soluble compounds from the tissue. Variations on this ethanol rinsing procedure include employing 0.3–1% trifluoroacetic acid (an ion-paring agent often added to MALDI matrix solutions) to further increase signal (Schwartz et al. 2003), or applying a small amount of MALDI matrix to the ethanol wash to “seed” matrix crystallization on the tissue (Chaurand et al. 2005).
The spatial resolution desired is an important factor in determining the method of matrix application. If relatively low-spatial resolution is acceptable, as when comparing diseased versus normal states, profiling experiments are often sufficient (Caldwell and Caprioli 2005). In profiling, small discrete matrix droplets are manually deposited onto areas of the tissue, reducing spatial resolution to the size and spacing of the droplets. As a benefit, such matrix droplets often extract more analyte from the tissue and thus result in higher signal intensities compared to traditional imaging protocols. When a higher spatial resolution is required to examine the spatial structure of small morphological features, matrix can be applied in a thin homogenous layer across the tissue to enable imaging.
Several application strategies are used to apply MALDI matrix to tissue sections. A large drop may be dragged across the tissue or the sample may be immersed in an organic solvent solution that has been saturated with the selected MALDI matrix. However, both of these methods increase the likelihood that some analyte redistribution will occur (Stoeckli et al. 2001). Higher spatial resolution experiments may be achieved by the application of a homogenous layer of matrix or small, evenly-distributed matrix droplets onto the tissue. Homogenous matrix application requires the use of a device to create a fine mist of matrix, sprayed in a series of even coats to the tissue. Typically, this consists of a glass spray nebulizer that is typically used to develop TLC plates, an artist’s airbrush, or a similar home-built sprayer. Applying the matrix in a series of thin coats prevents the matrix layer from becoming too thick (which may result in multiple crystal layers and reduced ion yields) or the tissue section becoming too wet (which may induce analyte redistribution). Roughly ten passes, lasting 5–10 s each, with a drying period of 1–2 min between coats, limits the analyte migration that can occur when the tissue sample is wet and yields the most intense signals (Chaurand et al. 2006). It is important to allow the tissue to nearly dry between coats but not become completely dry. This requires optimization of the protocol according to tissue and atmospheric conditions within the lab. Following matrix coating, samples may be coated with a thin layer of metal such as gold to increase ion yield from the tissue sections (Altelaar et al. 2006); however, such treatment is often not necessary. Although samples may be stored at −80 °C until needed, it is preferable to analyze samples shortly following preparation.
An alternative to spray nebulizers is electrospray deposition, which applies high voltage to a liquid in a glass or metal capillary to create a matrix spray of small droplets (Kruse and Sweedler 2003). By controlling the spray needle with an x-y translation stage, this methodology offers a high level of homogeneity (Chaurand et al. 2006).
Recently, an acoustic printer has been used to deposit high density droplet patterns of matrix in an automated manner. Matrix is placed in a reservoir below the sample and an acoustic pulse ejects a small droplet of matrix onto the sample. The sample is mounted on a two-dimensional translation stage that enables the printing of spot arrays. Uniform droplets, ranging in size from 0.1 pL to 10 μL, may be applied by the acoustic ejection process at a spatial resolution of ~200 μm (Aerni et al. 2006). Unlike the homogenous coating methods where analyte redistribution is a problem, here such migration is limited to the diameter of the printed spot. Acoustic printing has recently been applied to the study of breast cancer (Cornett et al. 2006), toxicity in rat kidney (Meistermann et al. 2006), and pharmacokinetics (Khatib-Shahidi et al. 2006).
Prior to the application of matrix as outlined above, tissues may be seeded with matrix to allow greater crystal homogeneity across the sample, as shown in Figure 4. Matrix may be added to the ethanol washes, as mentioned previously, or to a solid matrix such as sinapinic acid, which may be mechanically ground into a fine powder and then spread across the tissue section. The subsequent application of liquid matrix then forms smaller, more homogenous crystals to create a more stable, uniform signal across the entire tissue section. Smaller matrix crystals also reduce the number of laser shots needed at each location, thus reducing the time needed to collect the mass spectra from the sample. Matrix seeding has only recently been applied to MALDI MSI of mouse brain tissue (Clerens et al. 2006).
Figure 4.
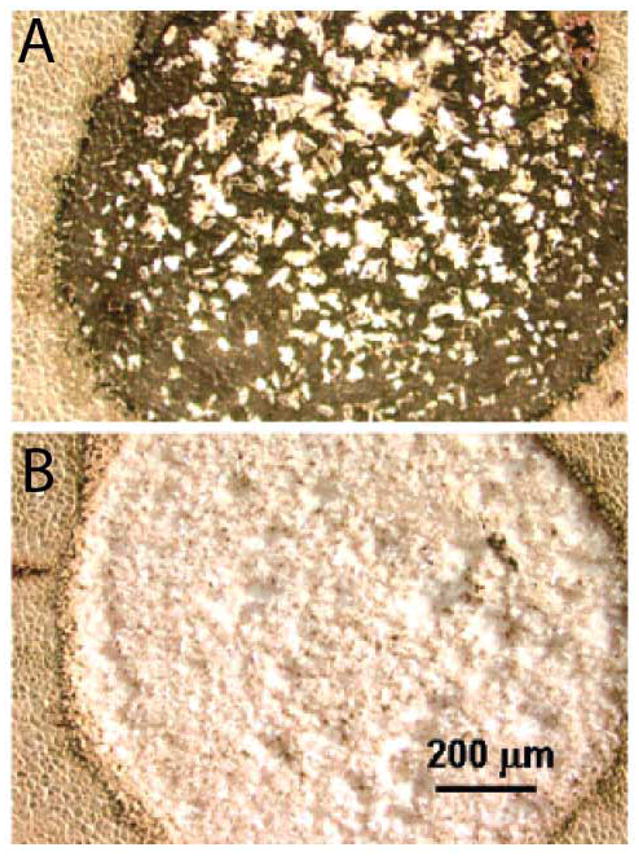
MALDI matrix applied to (A) unseeded rat liver tissue and (B) matrix seeded tissue. Greater crystal homogeneity is observed in tissues that have been previously seeded with ground matrix. (Reprinted with permission from reference (Aerni et al. 2006).)
Another deposition method combines both matrix seeding and high density microspotting to improve signal intensities for profiling/imaging experiments. In this two-step “spray-droplet” method, a sprayed low-concentration matrix seed layer is followed by microdroplet application via inkjet printing of a higher-concentration matrix solution (Sugiura et al. 2006).
The previously outlined techniques have focused on analyzing intact, complete tissue sections. The Sweedler group (Monroe et al. 2006) has developed a method, the “stretched sample” approach, to study tissue sections at approximately single cell spatial resolution that allows maximal matrix-analyte incorporation while inhibiting analyte redistribution. Briefly, a substrate is prepared by affixing a monolayer of glass beads (~38 μm diameter) to a Parafilm M membrane using pressure and heat. A tissue section is then placed on the substrate and adheres strongly to the glass beads. The substrate is manually stretched to fragment the tissue as the beads separate. Fragmentation occurs because the mechanical stability of the tissue section is less than that of both the tissue-bead and bead-Parafilm M adhesion. As the substrate may be stretched to four times its original size, individual beads are separated by ~100 μm from one another by the hydrophobic Parafilm M membrane, which inhibits analyte migration during matrix application. Additionally, water may be condensed onto the sample in small droplets to increase the time of analyte incorporation without fear of redistribution as long as the droplets do not form connections between adjacent beads. This slow extraction/crystal formation methodology has also been found to reduce the presence of alkali metal adducts by inducing mutually exclusive crystallization of the MALDI matrix and the salts from the tissue (Monroe et al. 2007).
SIMS Imaging
As mentioned previously, owing to a combination of decreased analyte redistribution and a smaller probe dimension, SIMS imaging provides higher spatial resolutions than MALDI MSI. This spatial resolution is routinely at the single micron to 100 nanometer range. Because SIMS uses primary ion impacts to desorb and ionize analytes from a sample, large molecules are ionized less effectively than in MALDI MS, in large part due to an increased level of fragmentation during the desorption/ionization process (McDonnell et al. 2005). This increased fragmentation has traditionally limited SIMS to the analysis of atomics and relatively small molecules. Nonetheless, developments in sample preparation techniques, including cryogenic treatment of tissue, surface metallization, and matrix enhancement, as well as the “softer” primary ion sources discussed previously, make the imaging of ever-larger biomolecules in tissues more feasible. Sample preparation remains the principal challenge, particularly at high spatial resolutions. Differences in ionization efficiency caused by variations in the chemical and topological properties across a sample surface can complicate analyses and sample preparation strategies (Delcorte 2006). SIMS is a surface-sensitive ionization process, thus it is inherently attuned to the interaction of the ion beam with the surface. Fortunately, these surface effects can be largely controlled and/or overcome by choosing the appropriate sample preparation and data processing protocols.
Following isolation, samples for SIMS are often subject to cryogenic treatments such as flash freezing or freeze fracturing. Flash freezing fixes the sample by rapidly cooling it at a rate of ~5000 K/s in a coolant such as Freon 22 or liquid nitrogen-slushed propane (Chandra and Morrison 1992). The rapid cooling rate quenches the movement of even atomic ions such as sodium and potassium within a sample, which is indicative of the high level of preservation necessary for imaging at sub-micron spatial scales. Frozen samples may be transferred into the SIMS instrument using a cold transfer stage in a hydrated state (Roddy et al. 2002a) or freeze dried to preserve the sample, keeping in mind that the drying process may allow some analyte redistribution to occur. The alternative cryogenic treatment, freeze-fracture, was originally developed for electron microscopy, and is used to access subcellular features within a sample (Roddy et al. 2002b). Often the sample is placed between two silicon shards prior to flash freezing. While under liquid nitrogen, the two pieces of silicon are then separated to fracture the frozen sample. This fracturing is beneficial for the study of single cells and may expose several different regions of the cell; for example, the outer membrane surface or the intracellular components, which may be identified on the basis of the spatial and chemical patterns that arise from the SIMS analyses (Roddy et al. 2002b). This fracturing enables the interior of isolated cells to be examined that would not otherwise be available due to the surface-profiling nature of static SIMS. To limit analyte migration, the freeze-fractured cells are freeze dried at −90 °C or analyzed in a frozen hydrated state in which the water ice helps to reduce analyte fragmentation (Roddy et al. 2003). Phosphocholine was recently imaged in freeze-fractured cells from rat kidney tissue (Nygren et al. 2005). An analogous fracture method was developed for SIMS imaging by using 50 mM trehalose at room temperature, instead of freezing, to stabilize cell cultures (Parry and Winograd 2005).
In SIMS, when charged particles impact the sample surface, notable surface charging and analyte fragmentation can occur. One of the most promising means by which to address these issues is to apply a thin layer of metal to the sample surface. Sample metallization may be performed in either of two manners. In the imprint-imaging method, the sample is prepared and then pressed onto a silver surface, resulting in the transfer of a thin layer of sample to the metal; the metallized sample is then imaged. This technique has been shown to reduce the fragmentation of moderate-weight analytes and sub-kDa peptides and has been used to image phosphatidylcholine and cholesterol in human blood cells (Nygren et al. 2003; Sjovall et al. 2003). Higher secondary ion yields are obtained from the silver surface compared to the direct analysis of tissue, and this method may be applied easily to both tissue and isolated cells.
An alternative metallization technique completely covers the sample surface with a 1–5 nm thick layer of metal such as gold or silver applied with a conventional sputter coater. This methodology is consistent with strategies used for SEM preparations. The metal coating not only prevents charging but is also believed to help “soften” the initial impact of the primary ions by forming a protective shell over the sample surface. Surface metallization both increases sensitivity and greatly expands the mass range available for analyses (to ~5 kDa) while keeping the sample surface intact rather than transferring it to another surface. After using this silver coating technique, the cholesterol signal was found to be up to 600 times higher in rat kidney (Nygren et al. 2004). Gold metallization has been used for ToF-SIMS imaging of cholesterol and other cell membrane components in rat brain (Altelaar et al. 2006). Direct surface metallization has also been applied to detect large synthetic polymers such as polyalanine (Delcorte et al. 2003), but not as yet to in situ large biomolecules. Although the sample is coated in this preparative strategy, analytes are not incorporated into the metal layer but rather are maintained in their native locations under the thin metallic coating.
Organic MALDI matrices are also being used for the analysis of tissues in SIMS. In matrix enhanced-SIMS (ME-SIMS), small molecule organic matrices (typically traditional MALDI matrices such as CHCA) are used to coat tissues in a similar manner to those methods outlined for MALDI MSI. These approaches result in the incorporation of analyte into the matrix layer. ME-SIMS has shown promise for extending the mass range to the level required for proteomics experiments, particularly when linked with surface metallization strategies (Delcorte et al. 2003). In addition to improving the upper end of the mass range for SIMS, matrix-enhancement also reduces the fragmentation of lower mass analytes, thus increasing sensitivity across the mass range (Delcorte 2006). Although SIMS images can be collected at sub-micrometer spatial resolutions, matrix crystal size often limits the experimental spatial resolution to ~2–3 microns. Proteins as large as a lysozyme, at 14 kDa (Wu and Odom 1996), have been detected using the ME-SIMS approach, but thus far, compounds this large have not been directly detected from biological tissues. However, ME-SIMS has been used to create ion images of small peptides from a section of the cerebral ganglion of the pond snail, Lymnaea stagnalis, at 2.5 μm spatial resolution (McDonnell et al. 2005).
DESI and ESI
Although used less frequently, DESI and ESI imaging methods have some advantages in that they require less sample preparation and do not have the vacuum requirements of SIMS and most MALDI MS instruments. Specifically, DESI relies on a supersonic electrosprayed solvent mixture to desorb analytes directly from a surface (Takats et al. 2004b). Although the precise mechanism of this desorption is still under investigation, as little or no sample preparation is required, the desorption properties of DESI are rather well suited for the two-dimensional imaging of biological samples. DESI MSI has been successfully used in detection, directly from the skin, of the antihistamine drug, loratadine, in vivo (Takats et al. 2004b). Furthermore, DESI has shown promise for its ability to ionize small and nonpolar molecules (Van Berkel et al. 2005), and provide images of tissue sections from rat brain for lipid analysis (Wiseman et al. 2006), as well as images of distribution of other small molecules. While the spatial resolution of such experiments is still low (~400 μm), DESI is useful in defining gross morphological features, as shown in Figure 5 (Ifa et al. 2007).
Figure 5.
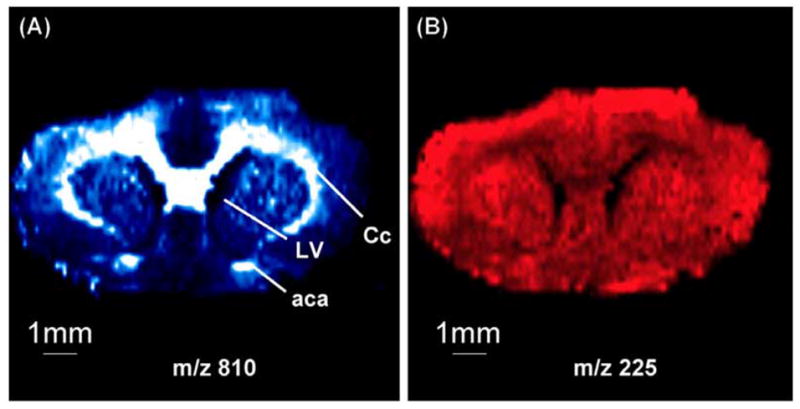
Negative ion DESI MS images of (A) m/z 810 and (B) m/z 255 from a 4 μm coronal section of rat brain tissue illustrate the utility of the method to resolve morphological features in tissues. (Reprinted with permission from reference (Ifa et al. 2007).)
Efforts to apply traditional ESI to imaging are complicated by the fact that this method was not designed as a surface analysis technique. Several methodologies have, however, been developed that incorporate this approach. Smith and co-workers (Petyuk et al. 2007) have developed a technique whereby a thick (1 mm) tissue section is dissected into 1 mm3 cubes and individually digested and analyzed with LC coupled to FT MS. In this example, over 250 different protein distributions were imaged in a mouse brain by mapping the normalized intensity of a peptide resulting from the tryptic digest of the parent protein. Although the presented images were of low spatial resolution (1 mm), improved sample handling procedures and increased throughput of sample analyses may increase both the resolution and speed of these experiments.
An alternative ESI methodology utilizes a surface probe to remove analyte from a sample with a suitable solvent and then delivers the eluent to the mass spectrometer. This method has not yet been applied to the imaging of biological materials but is similar to online dialysates or push-pull perfusion probes. Furthermore, it would most likely require some desalting because the ESI process can be sensitive to the presence of high salt concentrations. Nonetheless, the spatial distribution of a dye mixture has been successfully examined from the surface of a thin-layer chromatography plate using the probe-ESI methodology (Ford and Van Berkel 2004; Ford et al. 2005).
IV. Image Acquisition and Data Analysis
Mass spectral images often contain 104 pixels and have been as large as 107 pixels (Amaya et al. 2007), depending on the size of the sample and the spatial resolution. Since a mass spectrum is taken at each pixel location, dataset sizes can rapidly approach and even exceed several gigabytes. This presents challenges in both data acquisition and analysis. Software that interacts with the instrument to make acquisition of these large datasets more efficient is readily available for most MALDI mass spectrometers in either commercial (from instrument manufacturers) or freely available forms (www.maldi-msi.org). Although the specifics vary with each instrument, in general these programs create a list of positions on the sample target and gather mass spectra in an automated manner. Once collected, the mass spectra are processed into a form that is more easily analyzed. The freely available tools produce an Analyze 7.5 dataset that may be read by several software packages, such as BioMap or Matlab, to produce images (Stoeckli et al. 2002; Clerens et al. 2006). In general, commercially available software is tailored to the specific instrument and/or integrated into the instrument control and data analysis programs and results largely in proprietary formats. Unlike MALDI MS, imaging is nearly inherent to static SIMS instruments as rastering of the primary ion beam is required to prevent the rapid ablation of the sample surface. Therefore, imaging is typically integrated directly into the instrument control and data analysis software.
The large number of mass spectra and surface variations across a sample may introduce some level of systematic error into an experiment but can often be compensated for in post-processing. For example, an uneven sample surface topology may introduce mass errors or shifts in ToF-MS instruments, as the mass measurement depends on the flight distance and extraction efficiency. By measuring the shift in time-of-flight of a particular m/z signal across the surface, a height map can be generated and used to correct the acquired mass spectra (McDonnell et al. 2005). Other widely used methods to correct for systematic errors include baseline subtraction, noise estimation, normalization, and spectral realignment (Chaurand et al. 2004; Chaurand et al. 2006). Localized charging may also introduce similar errors. However, this variation in ionization efficiency may be addressed by normalizing the ion image for a selected compound with the image of a ubiquitous compound (Ostrowski et al. 2004; Monroe et al. 2005).
Collecting a complete mass spectrum for each pixel in a high density raster over a sample generates up to several gigabytes of raw data, and particularly in the case of MALDI MSI, consumes a fair amount of time (several hours). This process can result in a significant number of laser shots and extensive instrument usage. If the mass range of the compounds and specific tissue region of interest is known, the dataset may be vastly simplified. Often it is impractical to perform many MALDI MSI experiments and it is more advantageous to use profiling or low-density raster patterns prior to final, high-density imaging of a sample for optimization and reproducibility experiments. For example, serial sections of a tissue sample may be taken so that each has approximately the same chemical profile as one another. This enables parallel profiling and imaging experiments to be performed so that the profiling results may assist in driving the specifications of the imaging experiment.
Often experiments are designed to examine different physiological states in order to identify changes in protein expression patterns that may be correlated with a disease state or stimulus (pharmacological, conditioning, etc.). Comparisons between tissues of a different nature or physiological role are also of great interest. Uncovering such correlations from the entire raw dataset requires the use of statistical methods. Clustering methods, such as principal components analysis (PCA) combined with linear discriminants, have been used to identify pixels and spatial regions that are spectrally correlated in the MALDI MSI (McCombie et al. 2005) and SIMS data (Tyler et al. 2007). The analysis of mass spectra from 28 bacterial strains followed by PCA enabled the differentiation of gram-positive from gram-negative bacteria and, in some cases, individual species (Ingram et al. 2003). The analysis of cancer biopsies also resulted in the differentiation of the various stages of cancer, predicting patient mortality with an accuracy similar to traditional histological approaches (Chaurand et al. 2005; Cornett et al. 2006).
V. Specialized Methods
A. Combining MSI with Histological Staining
Histological staining may be used to associate mass spectral data to morphological structures in a tissue. This enables comparison of multiple tissue sections to each other, or to a tissue atlas. Combining optical microscopic and mass spectral images requires careful selection of stains. While cresyl violet and methylene blue have shown to be compatible with MALDI MSI experiments (Chaurand et al. 2004), conventional hematoxylin and eosin dyes suppress mass spectral signals. Typically, following sectioning, the tissue is placed onto a conductive glass slide so that it may be examined by optical microscopy. Suitable slides should be permeable to 85% of visible light and conductive to prevent charging; for example, slides coated with indium-tin oxide. Several hundred microliters of a staining solution are then pipetted onto the tissue section. Any excess stain can be removed by submerging the tissue in ethanol, which as mentioned previously, also serves to fix proteins (Chaurand et al. 2004). Combining MALDI MSI with histological examination has aided in the identification of several novel biomarkers in human brain tumors (Johnson et al. 2006) and breast cancer (Chaurand et al. 2006).
B. Three-dimensional MSI
The ability to combine three-dimensional analyses with other imaging techniques such as magnetic resonance imaging (MRI) enables the highest information content available to be gleaned from a sample. In three-dimensional MSI, serial sectioning is followed by the acquisition of two-dimensional images of each section; then the individual sections are combined to create the three dimensional image. One issue when combining three-dimensional imaging with MSI is the registration of adjacent serial tissue sections while creating the third dimension based on two-dimensional morphologies. One way to address this issue is with histological staining, which assists in identifying landmark features in the tissue to aid in registration between sections. In addition, prior to sectioning, registration marks may be added to aid in image reconstruction. The efficacy of three-dimensional image reconstruction has been demonstrated using a series of 20 μm-thick sections from a mouse brain (Crecelius et al. 2005). Three-dimensional images allow the study of detailed proteomic or pharmacodynamic information by enabling the chemical reconstruction of entire organs in a structural visualization scheme.
C. Tandem MSI
Although many analytes may be putatively identified on the basis of accurate mass match to a known compound, fragmentation data assists in the identification of novel signals or the verification of a signal’s identity. In addition, imaging the distribution of a fragment ion across a sample separates signals from different compounds with the same nominal molecular mass. Tandem MS (MS/MS) has been used for the concurrent imaging and de novo sequencing of several insect neuropeptides (Verhaert et al. 2007). Imaging of the distribution of small organic molecules can be achieved by plotting the intensity of a selected fragment ion from a parent compound of interest. Khatib-Shahidi and coworkers (Khatib-Shahidi et al. 2006) have used the MS/MS transition from the parent to fragment ion to image the distribution of a drug and its metabolites in a complete saggital section of a mouse following oral drug dosing. Similarly, a pharmaceutical study has mapped the location of an active drug in multiple types of rat tissues using tandem MSI (Drexler et al. 2007). Intermediate pressures (0.17 torr) with MALDI MS, along with an intermediate-pressure linear ion trap, reduce fragmentation of labile analytes such as lipids, while also allowing tandem MSI experiments to resolve species of similar mass (Garrett et al. 2007). Tandem MSI also been used to image the distribution of cerebroside lipids in nerve tissues (Cha and Yeung 2007).
VI. Summary and Future Directions
The ability to map the distribution of a wide range of compounds directly from tissues and isolated cells will greatly aid researchers in many fields. A significant advantage of MS-based approaches is that analyte preselection or labeling is not typically required and little, if any, prior knowledge of the imaged compounds is needed. An additional benefit is that compounds may be directly sampled from a tissue (or following minimal preparation such as matrix coating) to enable the visualization of the native distribution of a wide range of both known and unknown compounds in a single experiment. Because of the reduced sample preparation steps, the amount of analyte required for characterization is often less than for separation/MS (e.g., LC-MS) approaches. Although the field of MSI is rapidly developing, sample preparation protocols still require optimization as most have not been fully standardized or validated. In fact, as discussed throughout this chapter, sampling protocols must be tailored not only to the various methodologies, but also according to the type of tissue being analyzed.
The design of a successful MSI experiment requires consideration of several factors, including the mass range, spatial resolution, and sensitivity desired or required. Through careful selection of the right methodology and sample preparation strategy, high quality mass spectra can be obtained at thousands of positions across a sample at a broad range of spatial resolutions, from sub-micron to hundreds of microns. As a result, tens to hundreds of compounds can be imaged in a single experiment. MS-based imaging has shown real promise in addressing several biological questions, but the full potential of the approach is just beginning to be realized. The recent and rapid application of MSI to drug development, disease prognosis, and fundamental biochemistry suggests that MSI will enable significant biological breakthroughs in the future.
Acknowledgments
The authors gratefully acknowledge the support of the National Institute on Drug Abuse under Award No. P30DA018310 to the UIUC Center on Neuroproteomics on Cell to Cell Signaling and Award No. PHS 5 R01DA17940. E.M. is also pleased to acknowledge fellowship support from Merck Research Laboratories and the ACS Division of Analytical Chemistry Graduate Fellowship sponsored by Proctor & Gamble.
References
- Aerni HR, Cornett DS, Caprioli RM. Automated acoustic matrix deposition for MALDI sample preparation. Anal Chem. 2006;78:827–834. doi: 10.1021/ac051534r. [DOI] [PubMed] [Google Scholar]
- Altelaar AF, Klinkert I, Jalink K, de Lange RP, Adan RA, Heeren RM, Piersma SR. Gold-enhanced biomolecular surface imaging of cells and tissue by SIMS and MALDI mass spectrometry. Anal Chem. 2006;78:734–742. doi: 10.1021/ac0513111. [DOI] [PubMed] [Google Scholar]
- Altelaar AFM, Taban IM, McDonnell LA, Verhaert PDEM, de Lange RPJ, Adan RAH, Mooi WJ, Heeren RMA, Piersma SR. High-resolution MALDI imaging mass spectrometry allows localization of peptide distributions at cellular length scales in pituitary tissue sections. Int J Mass Spectrom. 2007;260:203–211. [Google Scholar]
- Amaya KR, Monroe EB, Sweedler JV, Clayton DF. Lipid imaging in the zebra finch brain with secondary ion mass spectrometry. Int J Mass Spectrom. 2007;260:121–127. [Google Scholar]
- Berkenkamp S, Karas M, Hillenkamp F. Ice as a matrix for IR-matrix-assisted laser desorption/ionization: mass spectra from a protein single crystal. Proc Natl Acad Sci USA. 1996;93:7003–7007. doi: 10.1073/pnas.93.14.7003. [DOI] [PMC free article] [PubMed] [Google Scholar]
- Borner K, Malmberg P, Mansson JE, Nygren H. Molecular imaging of lipids in cells and tissues. Int J Mass Spectrom. 2007;260:128–136. [Google Scholar]
- Caldwell RL, Caprioli RM. Tissue profiling by mass spectrometry: a review of methodology and applications. Mol Cell Proteomics. 2005;4:394–401. doi: 10.1074/mcp.R500006-MCP200. [DOI] [PubMed] [Google Scholar]
- Candy JM, Oakley AE, Mountfort SA, Taylor GA, Morris CM, Bishop HE, Edwardson JA. The imaging and quantification of aluminium in the human brain using dynamic secondary ion mass spectrometry (SIMS) Biol Cell. 1992;74:109–118. doi: 10.1016/0248-4900(92)90016-t. [DOI] [PubMed] [Google Scholar]
- Cha S, Yeung ES. Colloidal graphite-assisted laser desorption/ionization mass spectrometry and MSn of small molecules. 1 Imaging of cerebrosides directly from rat brain tissue. Anal Chem. 2007;79:2373–2385. doi: 10.1021/ac062251h. [DOI] [PubMed] [Google Scholar]
- Chandra S, Morrison GH. Sample preparation of animal tissues and cell cultures for secondary ion mass spectrometry (SIMS) microscopy. Biol Cell. 1992;74:31–42. doi: 10.1016/0248-4900(92)90006-m. [DOI] [PubMed] [Google Scholar]
- Chaurand P, Schwartz SA, Reyzer ML, Caprioli RM. Imaging mass spectrometry: principles and potentials. Toxicol Pathol. 2005;33:92–101. doi: 10.1080/01926230590881862. [DOI] [PubMed] [Google Scholar]
- Chaurand P, Norris JL, Cornett DS, Mobley JA, Caprioli RM. New developments in profiling and imaging of proteins from tissue sections by MALDI mass spectrometry. J Proteome Res. 2006;5:2889–2900. doi: 10.1021/pr060346u. [DOI] [PubMed] [Google Scholar]
- Chaurand P, Schwartz SA, Billheimer D, Xu BJ, Crecelius A, Caprioli RM. Integrating histology and imaging mass spectrometry. Anal Chem. 2004;76:1145–1155. doi: 10.1021/ac0351264. [DOI] [PubMed] [Google Scholar]
- Clerens S, Ceuppens R, Arckens L. Createtarget and analyze this!: new software assisting imaging mass spectrometry on Bruker Reflex IV and Ultraflex II instruments. Rapid Commun Mass Spectrom. 2006;20:3061–3066. doi: 10.1002/rcm.2698. [DOI] [PubMed] [Google Scholar]
- Cornett DS, Mobley JA, Dias EC, Andersson M, Arteaga CL, Sanders ME, Caprioli RM. A novel histology-directed strategy for MALDI-MS tissue profiling that improves throughput and cellular specificity in human breast cancer. Mol Cell Proteomics. 2006;5:1975–1983. doi: 10.1074/mcp.M600119-MCP200. [DOI] [PubMed] [Google Scholar]
- Crecelius AC, Cornett DS, Caprioli RM, Williams B, Dawant BM, Bodenheimer B. Three-dimensional visualization of protein expression in mouse brain structures using imaging mass spectrometry. J Am Soc Mass Spectrom. 2005;16:1093–1099. doi: 10.1016/j.jasms.2005.02.026. [DOI] [PubMed] [Google Scholar]
- Debois D, Brunelle A, Laprevote O. Attempts for molecular depth profiling directly on a rat brain tissue section using fullerene and bismuth cluster ion beams. Int J Mass Spectrom. 2007;260:115–120. [Google Scholar]
- Delcorte A. Matrix-enhanced secondary ion mass spectrometry: the alchemist’s solution? Appl Surf Sci. 2006;252:6582–6587. [Google Scholar]
- Delcorte A, Bour J, Aubriet F, Muller JF, Bertrand P. Sample metallization for performance improvement in desorption/ionization of kilodalton molecules: quantitative evaluation, imaging secondary ion MS, and laser ablation. Anal Chem. 2003;75:6875–6885. doi: 10.1021/ac0302105. [DOI] [PubMed] [Google Scholar]
- Drexler DM, Garrett TJ, Cantone JL, Diters RW, Mitroka JG, Prieto Conaway MC, Adams SP, Yost RA, Sanders M. Utility of imaging mass spectrometry (IMS) by matrix-assisted laser desorption ionization (MALDI) on an ion trap mass spectrometer in the analysis of drugs and metabolites in biological tissues. J Pharmacol Toxicol Methods. 2007;55:279–288. doi: 10.1016/j.vascn.2006.11.004. [DOI] [PubMed] [Google Scholar]
- Fletcher JS, Lockyer NP, Vaidyanathan S, Vickerman JC. TOF-SIMS 3D biomolecular imaging of Xenopus laevis oocytes using buckminsterfullerene (C60) primary ions. Anal Chem. 2007;79:2199–2206. doi: 10.1021/ac061370u. [DOI] [PubMed] [Google Scholar]
- Ford MJ, Van Berkel GJ. An improved thin-layer chromatography/mass spectrometry coupling using a surface sampling probe electrospray ion trap system. Rapid Commun Mass Spectrom. 2004;18:1303–1309. doi: 10.1002/rcm.1486. [DOI] [PubMed] [Google Scholar]
- Ford MJ, Kertesz V, Van Berkel GJ. Thin-layer chromatography/electrospray ionization triple-quadrupole linear ion trap mass spectrometry system: analysis of rhodamine dyes separated on reversed-phase C8 plates. J Mass Spectrom. 2005;40:866–875. doi: 10.1002/jms.796. [DOI] [PubMed] [Google Scholar]
- Garrett TJ, Prieto-Conaway MC, Kovtoun V, Bui H, Izgarian N, Stafford G, Yost RA. Imaging of small molecules in tissue sections with a new intermediate-pressure MALDI linear ion trap mass spectrometer. Int J Mass Spectrom. 2007;260:166–176. [Google Scholar]
- Gillen G, Roberson S, Ng C, Stranick M. Elemental and molecular imaging of human hair using secondary ion mass spectrometry. Scanning. 1999;21:173–181. doi: 10.1002/sca.4950210301. [DOI] [PubMed] [Google Scholar]
- Gross ML, Caprioli RM, editors. The Encyclopedia of Mass Spectrometry: Ionization Methods. Elsevier; Oxford, San Diego: 2007. [Google Scholar]
- Han J, Schey KL. MALDI tissue imaging of ocular lens alpha-crystallin. Invest Ophthalmol Vis Sci. 2006;47:2990–2996. doi: 10.1167/iovs.05-1529. [DOI] [PubMed] [Google Scholar]
- Holle A, Haase A, Kayser M, Hohndorf J. Optimizing UV laser focus profiles for improved MALDI performance. J Mass Spectrom. 2006;41:705–716. doi: 10.1002/jms.1041. [DOI] [PubMed] [Google Scholar]
- Honig RE. The development of secondary ion mass spectrometry (SIMS): a retrospective. Int J Mass Spectrom. 1985;66:31–54. [Google Scholar]
- Hsieh Y, Casale R, Fukuda E, Chen J, Knemeyer I, Wingate J, Morrison R, Korfmacher W. Matrix-assisted laser desorption/ionization imaging mass spectrometry for direct measurement of clozapine in rat brain tissue. Rapid Commun Mass Spectrom. 2006;20:965–972. doi: 10.1002/rcm.2397. [DOI] [PubMed] [Google Scholar]
- Ifa DR, Wiseman JM, Song Q, Cooks RG. Development of capabilities for imaging mass spectrometry under ambient conditions with desorption electrospray ionization (DESI) Int J Mass Spectrom. 2007;259:8–15. [Google Scholar]
- Ingram JC, Bauer WF, Lehman RM, O’Connell SP, Shaw AD. Detection of fatty acids from intact microorganisms by molecular beam static secondary ion mass spectrometry. J Microbiol Methods. 2003;53:295–307. doi: 10.1016/s0167-7012(02)00236-1. [DOI] [PubMed] [Google Scholar]
- Johnson MD, Floyd JL, Caprioli RM. Proteomics in diagnostic neuropathology. J Neuropathol Exp Neurol. 2006;65:837–845. doi: 10.1097/01.jnen.0000235116.67558.24. [DOI] [PubMed] [Google Scholar]
- Jurchen JC, Rubakhin SS, Sweedler JV. MALDI-MS imaging of features smaller than the size of the laser beam. J Am Soc Mass Spectrom. 2005;16:1654–1659. doi: 10.1016/j.jasms.2005.06.006. [DOI] [PubMed] [Google Scholar]
- Karas M, Hillenkamp F. Laser desorption ionization of proteins with molecular masses exceeding 10,000 daltons. Anal Chem. 1988;60:2299–2301. doi: 10.1021/ac00171a028. [DOI] [PubMed] [Google Scholar]
- Khatib-Shahidi S, Andersson M, Herman JL, Gillespie TA, Caprioli RM. Direct molecular analysis of whole-body animal tissue sections by imaging MALDI mass spectrometry. Anal Chem. 2006;78:6448–6456. doi: 10.1021/ac060788p. [DOI] [PubMed] [Google Scholar]
- Kruse R, Sweedler JV. Spatial profiling invertebrate ganglia using MALDI MS. J Am Soc Mass Spectrom. 2003;14:752–759. doi: 10.1016/S1044-0305(03)00288-5. [DOI] [PubMed] [Google Scholar]
- Leisner A, Rohlfing A, Berkenkamp S, Hillenkamp F, Dreisewerd K. Infrared laser post-ionization of large biomolecules from an IR-MALD(I) plume. J Am Soc Mass Spectrom. 2004;15:934–941. doi: 10.1016/j.jasms.2004.03.010. [DOI] [PubMed] [Google Scholar]
- Lemaire R, Tabet JC, Ducoroy P, Hendra JB, Salzet M, Fournier I. Solid ionic matrixes for direct tissue analysis and MALDI imaging. Anal Chem. 2006a;78:809–819. doi: 10.1021/ac0514669. [DOI] [PubMed] [Google Scholar]
- Lemaire R, Wisztorski M, Desmons A, Tabet JC, Day R, Salzet M, Fournier I. MALDI-MS direct tissue analysis of proteins: Improving signal sensitivity using organic treatments. Anal Chem. 2006b;78:7145–7153. doi: 10.1021/ac060565z. [DOI] [PubMed] [Google Scholar]
- Li Y, Shrestha B, Vertes A. Atmospheric pressure molecular imaging by infrared MALDI mass spectrometry. Anal Chem. 2007;79:523–532. doi: 10.1021/ac061577n. [DOI] [PubMed] [Google Scholar]
- Lorey DR, 2nd, Morrison GH, Chandra S. Dynamic secondary ion mass spectrometry analysis of boron from boron neutron capture therapy drugs in co-cultures: single-cell imaging of two different cell types within the same ion microscopy field of imaging. Anal Chem. 2001;73:3947–3953. doi: 10.1021/ac0103266. [DOI] [PubMed] [Google Scholar]
- Luxembourg SL, Mize TH, McDonnell LA, Heeren RM. High-spatial resolution mass spectrometric imaging of peptide and protein distributions on a surface. Anal Chem. 2004;76:5339–5344. doi: 10.1021/ac049692q. [DOI] [PubMed] [Google Scholar]
- Luxembourg SL, McDonnell LA, Mize TH, Heeren RM. Infrared mass spectrometric imaging below the diffraction limit. J Proteome Res. 2005;4:671–673. doi: 10.1021/pr049762+. [DOI] [PubMed] [Google Scholar]
- McCombie G, Staab D, Stoeckli M, Knochenmuss R. Spatial and spectral correlations in MALDI mass spectrometry images by clustering and multivariate analysis. Anal Chem. 2005;77:6118–6124. doi: 10.1021/ac051081q. [DOI] [PubMed] [Google Scholar]
- McDonnell LA, Piersma SR, MaartenAltelaar AF, Mize TH, Luxembourg SL, Verhaert PD, van Minnen J, Heeren RM. Subcellular imaging mass spectrometry of brain tissue. J Mass Spectrom. 2005;40:160–168. doi: 10.1002/jms.735. [DOI] [PubMed] [Google Scholar]
- Meistermann H, Norris JL, Aerni HR, Cornett DS, Friedlein A, Erskine AR, Augustin A, De Vera Mudry MC, Ruepp S, Suter L, Langen H, Caprioli RM, Ducret A. Biomarker discovery by imaging mass spectrometry: transthyretin is a biomarker for gentamicin-induced nephrotoxicity in rat. Mol Cell Proteomics. 2006;5:1876–1886. doi: 10.1074/mcp.M500399-MCP200. [DOI] [PubMed] [Google Scholar]
- Menzel C, Dreisewerd K, Berkenkamp S, Hillenkamp F. The role of the laser pulse duration in infrared matrix-assisted laser desorption/ionization mass spectrometry. J Am Soc Mass Spectrom. 2002;13:975–984. doi: 10.1016/S1044-0305(02)00397-5. [DOI] [PubMed] [Google Scholar]
- Miao H, Rubakhin SS, Sweedler JV. Subcellular analysis of D-aspartate. Anal Chem. 2005;77:7190–7194. doi: 10.1021/ac0511694. [DOI] [PubMed] [Google Scholar]
- Monroe EB, Jurchen JC, Lee J, Rubakhin SS, Sweedler JV. Vitamin E imaging and localization in the neuronal membrane. J Am Chem Soc. 2005;127:12152–12153. doi: 10.1021/ja051223y. [DOI] [PubMed] [Google Scholar]
- Monroe EB, Koszczuk BA, Losh JL, Jurchen JC, Sweedler JV. Measuring salty samples without adducts with MALDI MS. Int J Mass Spectrom. 2007;260:237–242. [Google Scholar]
- Monroe EB, Jurchen JC, Koszczuk BA, Losh JL, Rubakhin SS, Sweedler JV. Massively parallel sample preparation for the MALDI MS analyses of tissues. Anal Chem. 2006;78:6826–6832. doi: 10.1021/ac060652r. [DOI] [PMC free article] [PubMed] [Google Scholar]
- Nygren H, Johansson BR, Malmberg P. Bioimaging TOF-SIMS of tissues by gold ion bombardment of a silver-coated thin section. Microsc Res Tech. 2004;65:282–286. doi: 10.1002/jemt.20133. [DOI] [PubMed] [Google Scholar]
- Nygren H, Borner K, Malmberg P, Tallarek E, Hagenhoff B. Imaging TOF-SIMS of rat kidney prepared by high-pressure freezing. Microsc Res Tech. 2005;68:329–334. doi: 10.1002/jemt.20258. [DOI] [PubMed] [Google Scholar]
- Nygren H, Eriksson C, Malmberg P, Sahlin H, Carlsson L, Lausmaa J, Sjovall P. A cell preparation method allowing subcellular localization of cholesterol and phosphocholine with imaging TOF-SIMS. Colloids Surf B Biointerfaces. 2003;30:87–92. [Google Scholar]
- Ostrowski SG, Van Bell CT, Winograd N, Ewing AG. Mass spectrometric imaging of highly curved membranes during Tetrahymena mating. Science. 2004;305:71–73. doi: 10.1126/science.1099791. [DOI] [PMC free article] [PubMed] [Google Scholar]
- Parry S, Winograd N. High-resolution TOF-SIMS imaging of eukaryotic cells preserved in a trehalose matrix. Anal Chem. 2005;77:7950–7957. doi: 10.1021/ac051263k. [DOI] [PubMed] [Google Scholar]
- Petyuk VA, Qian WJ, Chin MH, Wang H, Livesay EA, Monroe ME, Adkins JN, Jaitly N, Anderson DJ, Camp DG, 2nd, Smith DJ, Smith RD. Spatial mapping of protein abundances in the mouse brain by voxelation integrated with high-throughput liquid chromatography-mass spectrometry. Genome Res. 2007;17:328–336. doi: 10.1101/gr.5799207. [DOI] [PMC free article] [PubMed] [Google Scholar]
- Roddy TP, Cannon DM, Jr, Meserole CA, Winograd N, Ewing AG. Imaging of freeze-fractured cells with in situ fluorescence and time-of-flight secondary ion mass spectrometry. Anal Chem. 2002a;74:4011–4019. doi: 10.1021/ac0255734. [DOI] [PubMed] [Google Scholar]
- Roddy TP, Cannon DM, Jr, Ostrowski SG, Winograd N, Ewing AG. Identification of cellular sections with imaging mass spectrometry following freeze fracture. Anal Chem. 2002b;74:4020–4026. doi: 10.1021/ac025574w. [DOI] [PubMed] [Google Scholar]
- Roddy TP, Cannon DM, Jr, Ostrowski SG, Ewing AG, Winograd N. Proton transfer in time-of-flight secondary ion mass spectrometry studies of frozen-hydrated dipalmitoylphosphatidylcholine. Anal Chem. 2003;75:4087–4094. doi: 10.1021/ac026353t. [DOI] [PubMed] [Google Scholar]
- Rohner TC, Staab D, Stoeckli M. MALDI mass spectrometric imaging of biological tissue sections. Mech Ageing Dev. 2005;126:177–185. doi: 10.1016/j.mad.2004.09.032. [DOI] [PubMed] [Google Scholar]
- Rubakhin SS, Greenough WT, Sweedler JV. Spatial profiling with MALDI MS: distribution of neuropeptides within single neurons. Anal Chem. 2003;75:5374–5380. doi: 10.1021/ac034498+. [DOI] [PubMed] [Google Scholar]
- Rubakhin SS, Churchill JD, Greenough WT, Sweedler JV. Profiling signaling peptides in single mammalian cells using mass spectrometry. Anal Chem. 2006;78:7267–7272. doi: 10.1021/ac0607010. [DOI] [PMC free article] [PubMed] [Google Scholar]
- Schueler B, Sander P, Reed DA. A time-of-flight secondary ion microscope. Vacuum. 1990;41:1661–1664. [Google Scholar]
- Schwartz SA, Reyzer ML, Caprioli RM. Direct tissue analysis using matrix-assisted laser desorption/ionization mass spectrometry: practical aspects of sample preparation. J Mass Spectrom. 2003;38:699–708. doi: 10.1002/jms.505. [DOI] [PubMed] [Google Scholar]
- Sjovall P, Lausmaa J, Nygren H, Carlsson L, Malmberg P. Imaging of membrane lipids in single cells by imprint-imaging time-of-flight secondary ion mass spectrometry. Anal Chem. 2003;75:3429–3434. doi: 10.1021/ac0207675. [DOI] [PubMed] [Google Scholar]
- Spengler B, Hubert M. Scanning microprobe matrix-assisted laser desorption ionization (SMALDI) mass spectrometry: instrumentation for sub-micrometer resolved LDI and MALDI surface analysis. J Am Soc Mass Spectrom. 2002;13:735–748. doi: 10.1016/S1044-0305(02)00376-8. [DOI] [PubMed] [Google Scholar]
- Stoeckli M, Chaurand P, Hallahan DE, Caprioli RM. Imaging mass spectrometry: a new technology for the analysis of protein expression in mammalian tissues. Nat Med. 2001;7:493–496. doi: 10.1038/86573. [DOI] [PubMed] [Google Scholar]
- Stoeckli M, Staab D, Staufenbiel M, Wiederhold KH, Signor L. Molecular imaging of amyloid beta peptides in mouse brain sections using mass spectrometry. Anal Biochem. 2002;311:33–39. doi: 10.1016/s0003-2697(02)00386-x. [DOI] [PubMed] [Google Scholar]
- Sugiura Y, Shimma S, Setou M. Two-step matrix application technique to improve ionization efficiency for matrix-assisted laser desorption/ionization in imaging mass spectrometry. Anal Chem. 2006;78:8227–8235. doi: 10.1021/ac060974v. [DOI] [PubMed] [Google Scholar]
- Szakal C, Kozole J, Winograd N. Fundamental studies of the cluster ion bombardment of water ice. Appl Surf Sci. 2006;252:6526–6528. [Google Scholar]
- Taban IM, Altelaar AF, van der Burgt YE, McDonnell LA, Heeren RM, Fuchser J, Baykut G. Imaging of peptides in the rat brain using MALDI-FTICR mass spectrometry. J Am Soc Mass Spectrom. 2007;18:145–151. doi: 10.1016/j.jasms.2006.09.017. [DOI] [PubMed] [Google Scholar]
- Takats Z, Wiseman JM, Cooks RG. Ambient mass spectrometry using desorption electrospray ionization (DESI): instrumentation, mechanisms and applications in forensics, chemistry, and biology. J Mass Spectrom. 2005;40:1261–1275. doi: 10.1002/jms.922. [DOI] [PubMed] [Google Scholar]
- Takats Z, Wiseman JM, Gologan B, Cooks RG. Electrosonic spray ionization. A gentle technique for generating folded proteins and protein complexes in the gas phase and for studying ion-molecule reactions at atmospheric pressure. Anal Chem. 2004a;76:4050–4058. doi: 10.1021/ac049848m. [DOI] [PubMed] [Google Scholar]
- Takats Z, Wiseman JM, Gologan B, Cooks RG. Mass spectrometry sampling under ambient conditions with desorption electrospray ionization. Science. 2004b;306:471–473. doi: 10.1126/science.1104404. [DOI] [PubMed] [Google Scholar]
- Takats Z, Nanita SC, Cooks RG, Schlosser G, Vekey K. Amino acid clusters formed by sonic spray ionization. Anal Chem. 2003;75:1514–1523. doi: 10.1021/ac0260793. [DOI] [PubMed] [Google Scholar]
- Tanaka K, Waki H, Ido Y, Akita S, Yoshida Y, Yoshida T, Matsuo T. Protein and polymer analyses up to m/z 100.000 by laser ionization time-of-flight mass spectrometry. Rapid Commun Mass Spectrom. 1988;2:151–153. [Google Scholar]
- Tyler BJ, Rayal G, Castner DG. Multivariate analysis strategies for processing ToF-SIMS images of biomaterials. Biomaterials. 2007;28:2412–2423. doi: 10.1016/j.biomaterials.2007.02.002. [DOI] [PMC free article] [PubMed] [Google Scholar]
- Van Berkel GJ, Ford MJ, Deibel MA. Thin-layer chromatography and mass spectrometry coupled using desorption electrospray ionization. Anal Chem. 2005;77:1207–1215. doi: 10.1021/ac048217p. [DOI] [PubMed] [Google Scholar]
- Verhaert PD, Conaway MCP, Pekar TM, Miller K. Neuropeptide imaging on an LTQ with vMALDI source: The complete ‘all-in-one’ peptidome analysis. Int J Mass Spectrom. 2007;260:177–184. [Google Scholar]
- Wiseman JM, Ifa DR, Song Q, Cooks RG. Tissue imaging at atmospheric pressure using desorption electrospray ionization (DESI) mass spectrometry. Angew Chem Int Ed Engl. 2006;45:7188–7192. doi: 10.1002/anie.200602449. [DOI] [PubMed] [Google Scholar]
- Wittig A, Wiemann M, Fartmann M, Kriegeskotte C, Arlinghaus HF, Zierold K, Sauerwein W. Preparation of cells cultured on silicon wafers for mass spectrometry analysis. Microsc Res Tech. 2005;66:248–258. doi: 10.1002/jemt.20159. [DOI] [PubMed] [Google Scholar]
- Wu KJ, Odom RW. Matrix-enhanced secondary ion mass spectrometry: a method for molecular analysis of solid surfaces. Anal Chem. 1996;68:873–882. doi: 10.1021/ac950717i. [DOI] [PubMed] [Google Scholar]