

Abstract
Purpose
The goal of this study was to investigate whether Ca2+-binding protein 5 (CaBP5) is required for vision using CaBP5 knockout mice. We also tested whether CaBP5 can modulate expressed Cav1.2 voltage-activated calcium channels.
Methods
CaBP5 knockout (Cabp5-/-) mice were generated. The retinal morphology and visual function of six-week-old Cabp5-/- mice was analyzed by confocal and electron microscopy, by single flash electroretinography (ERGs) and whole-cell patch-clamp recordings of retinal ganglion cells. The interaction and modulation of Cav1.2 channels by CaBP5 was analyzed using affinity chromatography, gel overlay assays and patch-clamp recordings of transfected HEK293 cells.
Results
No evidence of morphological changes and no significant difference in the amplitude of the ERG responses were observed in CaBP5 knockout mice compared with wild-type mice. However, the sensitivity of retinal ganglion cell light responses was reduced by ∼50% in Cabp5-/- mice. CaBP5 directly interacted with the CaM-binding domain of Cav1.2 and colocalized with Cav1.2 in rod bipolar cells. In transfected HEK293T cells, CaBP5 suppressed calcium-dependent inactivation of Cav1.2 and shifted the voltage-dependence of activation to more depolarized membrane potentials.
Conclusion
This study provides evidence that lack of CaBP5 results in reduced sensitivity of rod-mediated light responses of retinal ganglion cells, suggestive of a role for CaBP5 in the normal transmission of light signals throughout the retinal circuitry. The interaction, colocalization and modulation of Cav1.2 by CaBP5 suggest that CaBP5 can alter retinal sensitivity through modulation of voltage-gated calcium channels.
Keywords: CaBP5, Ca2+-binding proteins, CaBPs, voltage-activated calcium channels, bipolar cells, ganglion cells, retina
CaBP5 is a member of a subfamily of neuronal Ca2+-binding proteins that are highly similar to calmodulin (CaM)1-4. CaBPs can modulate various targets known to also be regulated by CaM, including voltage-gated calcium channels 5-7, TRP channels and inositol 1,4,5-trisphosphate (IP3) receptors 8-11. CaBP4, thus far the most characterized member of the CaBP subfamily, is localized at the photoreceptor synaptic terminals. CaBP4 is essential for normal development and/or maintenance of the photoreceptor output synapse, likely through modulation of photoreceptor Ca2+ channels and transmitter release12. CaBP4 interacts with alpha1F (Cav1.4) L-type voltage-dependent calcium channels in transfected HEK293T cells and shifts their activation to more hyperpolarized voltages12. Mutations in the Cabp4 gene have been shown in patients with autosomal recessive incomplete congenital stationary night blindness 13, a disease associated with mutations also in the CACNA1F gene encoding Cav1.414-16. CaBPs are also found in the cochlea, e.g. in the inner hair cells, and can modulate Cav1.3 channels that are required for hearing7, 17.
CaBP5 is expressed in rod and cone bipolar cells in retina of a variety of mammalian species. In mice, CaBP5 is expressed in rod bipolar cells, in type-5 ON-cone bipolar cells and in type-3 OFF-cone bipolar cells 18-20. In both human and monkey retina, rod bipolar cells and both ON and OFF cone bipolar cells are immunoreactive for CaBP521. Like CaBP1, 2 and 4, CaBP5 has been also observed in cochlear inner hair cells17. The specific function of CaBP5 in vivo remains unclear, but it may modulate various CaM targets in vitro1, 4, 10. CaBP5 modestly suppresses inactivation of Cav1.3 L-type voltage-activated Ca2+ channels in transfected cells17. L-type voltage-activated Ca2+ channels also mediate Ca2+ currents in rod bipolar cells22-27. Low-voltage-activated T-type Ca2+ channels may also be expressed in rod bipolar cells, although they may not be directly involved in triggering transmitter release 22, 24, 25.
In this study, we investigated whether CaBP5 is required for vision using mice lacking expression of CaBP5. We showed that CaBP5 deficiency results in reduced sensitivity of rod-mediated ganglion cell light responses. We also provide evidence that Cav1.2 might be a physiological target for CaBP5.
Material and methods
Animals
Mice were housed in the Department of Comparative Medicine at the University of Washington and treated according to the ARVO Statement for the Use of Animals in Ophthalmic and Vision Research. All the procedures for the maintenance and use of animals were approved by the Institutional Animal Care and Use Committee of the University of Washington.
Antibodies
Commercially available antibodies were: alkaline phosphatase-conjugated anti-mouse and anti-rabbit (Promega Corp., Madison, WI); anti-PKC alpha (Santa Cruz Biotechnology Inc., Santa Cruz, CA); anti-calbindin D-28K (Sigma, Saint Louis, MI); anti-calretinin (Chemicon International, Temecula, CA); anti-Cav1.2 (Alomone Laboratories, Jerusalem, Israel); Cy3 goat anti-rabbit and Cy3 goat anti-mouse (Jackson Immunoresearch Labs, Westgrove, PA); Alexa Fluor 488 goat anti-mouse and Alexa Fluor 488 goat anti-rabbit (Molecular Probes, Eugene, OR). The development and characterization of rabbit anti-CaBP5 (UW89) was described in Haeseleer et al1. To generate the anti-CaBP5 monoclonal antibody, mice were injected with 50 μg of purified His-tagged CaBP5 proteins in a RIBI adjuvant system. After two boosts at 2-week intervals, the mouse sera were analyzed using Western blot and immunohistochemistry. One mouse was used for fusion with myeloma. Ninety-six clones were screened for CaBP5 immunoreactivity using Western blot and immunohistochemistry. One clone, A1, producing antibodies that gave positive signals on retina tissues using Western blot and immunohistochemistry, was selected.
Generation and genotyping of Cabp5-/- mice
A BAC genomic clone originating from DNA of 129/Sv mice and containing the Cabp5 gene was purchased from Genome Systems, Inc. A ∼ 2kb covering the promoter region of the Cabp5 gene upstream the ATG was amplified by PCR with primer FH576 (5′-GCGGCCGCTGAGACAGTAAACCAGACCC-3′) that was extended with a NotI restriction site and primer FH575 (5′-GCTAGCTCAAGCTCTGATGTCAAGATGG-3′) that was extended with a NheI site. The long arm of ∼6kb covering part of intron 2 to intron 5 of the Cabp5 gene was amplified by PCR with primer FH577 (5′-GGTACCCACCACATTTACTAAG-3′) and primer FH578 (5′-GGTACCTGTAGTCACCTATTACTGCTCTC-3′). Both fragments were cloned in the pCRII-TOPO vector and partially sequenced.
The targeting vector was constructed by cloning the 2 kb DNA fragment as a NotI- SpeI fragment into the basic targeting vector 28 opened NotI-NheI, introducing this short arm at the 5′-end of the neo gene cassette. The long arm was then cloned as a fragment KpnI-KpnI into the targeting vector opened KpnI between the neo cassette and the HSV-TK (thymidine kinase). Following this strategy, exon 1 and exon 2 of the Cabp5 gene are replaced by the neo gene cassette. To increase the percentage of clones that undergo homologous recombination during the selection of transfected ES cells, we introduced a PGK-DTA (diphtheria toxin) cassette upstream of the 2 kb fragment. A cassette containing the “PGK-DTA-bovine growth hormone gene polyadenylation site” cassette was amplified with primers FH599 (5′-gcggccgctaccgggtaggggaggcgctttt-3′) and FH600 (5′-gcggccgctaccgggtaggggaggcgctttt-3′) using the PGKneolox2DTA vector (a kind gift from Dr. Philippe Soriano 29). These primers were extended with a NotI restriction site for cloning of this cassette upstream the short arm in the targeting vector opened NotI.
The PvuI linearized targeting vector was electroporated into 129/Sv derived embryonic stem cells. Recombinant clones were selected on medium containing G418 and ganciclovir. The screening of transfected ES cells for homologous recombination events was done using PCR analysis. To screen for homologous recombination upstream the neo cassette, we used the following primers combination K216 (5′-gaattatggtcccattagaggc -3′) hybridizing ∼ 300 bp upstream the 5′-end of the short arm in the Cabp5 gene and K204 (5′-GGAGAACCTGCGTGCAATCC-3′) located in the neo cassette amplifying a fragment of ∼2.6 kb. A control PCR for the wild-type gene was done with primers K216 and K206 (5′-GATGCAGGCAGGACCCATTGG-3′) located in exon 1 of the Cabp5 gene and amplifying a fragment of ∼2.2 kb. Selection of homologous recombination events at the 3′ end was analyzed by PCR using primers K214 (5′-Tcaacgagacatcatcttcac-3′) that hybridizes in exon 6 of the Cabp5 gene and K183 (5′-CTTGCCGAATATCATGGTGG-3′) located in the neo cassette. A control PCR for the wild-type gene was carried out with primers K214 and K212 (5′-gagaccactgggacaggatg-3′) that hybridizes in exon 2 of Cabp5.
One targeted ES clone was injected into C57BL/6J blastocysts. One 100% male chimera was crossed with C57BL/6J mice, and agouti offsprings were genotyped by PCR to verify germ line transmission. To identify the wild–type allele, the primer pair K212 (5′-gagaccactgggacaggatgag-3′, located in exon 2) and K35 (5′-CCCAACTCAGTCAACTCCATCTC-3′, hybridizing in exon 3) was used and gives a PCR product of 620 bp. The targeted Cabp5 allele was identified with primers K183 (5′-CTTGGCGAATATCATGGTGG-3′, located in the neo cassette) and K35 (∼800 bp) that gives a PCR product of 0.8 kb. Four out of 12 agouti pups were carrying the targeted gene. After five-generation backcross to C57Bl/6J, homozygous offsprings carrying the targeted gene were selected. The targeted disruption of the Cabp5 gene was confirmed by Southern blot analysis. Twenty μg of genomic DNA was digested with HindII and hybridized with a 0.25 kb fragment 5′-end probe located 500 bp upstream of the 5′end gene fragment introduced into the targeting vector. The 5′-end probe hybridizes to a ∼3.8 kb HindII fragment derived from the targeted allele and a 2.8 kb HindII fragment from the wild-type allele.
Immunohistochemistry
Mouse eyecups were fixed in 4% paraformaldehyde in 0.1 M phosphate buffer, pH 7.4 (PB) for 1 h. After fixation, tissues were incubated with a sucrose series to 20% sucrose in PB, and then embedded in 33% OCT compound (Miles, Elkhart, NY) diluted with 20% sucrose in PB. Eye tissue was cut in 12 μm sections. To block non-specific labeling, retinal sections were incubated with 3% normal goat serum in PBST buffer (136 mM NaCl, 11.4 mM sodium phosphate, 0.1% Triton X-100, pH 7.4) for 20 min at room temperature. Sections were incubated overnight at 4°C in a mix of diluted primary antibodies (1:500 for rabbit anti-CaBP5 with 1:1000 for mouse anti-calretinin; 1:200 for rabbit anti-PKCα with 1:500 for mouse anti-Calbindin D-28K, 1:200 for mouse anti-PKCα with 1:200 for rabbit anti-Cav1.2; 1:200 for mouse anti-CaBP5 with 1:200 for rabbit anti-Cav1.2). A mixture of Cy3-conjugated goat anti-rabbit IgG and Alexa 488-conjugated goat anti-mouse IgG or Cy3-conjugated goat anti-mouse IgG and Alexa 488-conjugated goat anti-rabbit was reacted with sections for 1 hr at room temperature. Then, the sections were rinsed in PBST and mounted with Prolong antifade reagent (Molecular Probes, Oregon) to retard photobleaching. Sections were analyzed under a confocal microscope (Zeiss LSM510, Carl Zeiss, NY, USA). Immunofluorescent images were obtained with a Plan-Neofluar 40×/1.3NA (Carl Zeiss, Inc. Thornwood, NY) objective lens.
Transmission electron microscopy
Mouse eyecups were primarily fixed by immersion in 2.5% glutaraldehyde, 1.6% paraformaldehyde in pH 7.4, 0.08 M PIPES buffer containing 2% sucrose, initially at room temperature for approximately 1 hr, then at 4° C for the remainder of 24 hr. The eyecups were then washed with pH 7.35, 0.13 M phosphate buffer, and secondarily fixed with 1% OsO4 in pH 7.4, 0.1 M phosphate buffer for 1 hr at room temperature. After another wash with 0.13 M phosphate buffer, the eyecups were dehydrated through a methanol series and transitioned to epoxy embedding medium with propylene oxide. The eyecups were infiltrated with Eponate 812 (Ted Pella, Inc., Redding, CA) and embedded for sectioning in Eponate 812 by hardening at 70° C for 24 hr prior to ultramicrotomy. Ultrathin sections (60-70 nm) were cut with a diamond knife and mounted on 50 mesh grids coated with a Pioloform (Ted Pella, Inc., Redding, CA) film. The sections were then stained with aqueous saturated Uranium acetate and Reynold's formula lead citrate prior to survey and micrography with a Philips CM10 electron microscope. A montage of individual images was created in Adobe Photoshop.
Electroretinograms (ERGs)
Prior to recording, mice were dark adapted overnight. Under dim red light, mice were anesthetized by intraperitoneal injection using 20 μl/g body weight of 6 mg/ml ketamine and 0.44 mg/ml xylazine diluted in 10 mM sodium phosphate (pH 7.2) containing 150 mM NaCl. The pupils were dilated with 2.5 % Phenylephrine-HCl and anestetized with 0.5 % proparacaine-HCl. A contact lens electrode was placed on the eye with a drop of 2.5% hydroxypropyl methylcellulose solution, and a reference electrode and ground electrode were placed in the ear and on the tail. ERGs were recorded with the universal testing and electrophysiologic system UTAS E-3000 (LKC Technologies, Inc.). The mice were placed on a temperature-regulated heating pad throughout the recordings. The light intensity was calibrated by the manufacturer and computer-controlled. The mice were placed in a Ganzfeld chamber, and scotopic and photopic responses to flash stimuli were each obtained from both eyes simultaneously.
Flash stimuli had a range of intensities (-2.4 – 2.8 log cd s m-2). Three to five recordings were made with >10 s intervals, and for higher intensity intervals were 1 min. For the photopic responses, a steady rod-desensitizing background (2.8 log cd.s.m-2+) was presented to the mice for 10 min prior to the light-adapted ERG recordings. Five animals were typically used for the recording of each point in all conditions. To analyze the rod photoreceptor component, the amplitude of the a-wave was measured 6 ms after flash stimuli from the prestimulus baseline30. The amplitude of the b-wave was measured from the a-wave trough to the peak of the b-wave. In photopic conditions, the amplitude of the slowly rising cone a-wave was analyzed from the prestimulus baseline to the a-wave trough30, 31. Statistical analysis of the differences between Cabp5+/+ and Cabp5-/- ERG data was carried out using the student t-test for each individual flash intensity (SigmaPlot, SPSS Inc., Chicago, IL).
Patch-clamp recordings
Responses of retinal ganglion cells were measured using whole-cell patch clamp recordings following previously published procedures32. In brief, retinas were isolated from a mouse that had been dark adapted overnight. A small piece of retina was mounted photoreceptor side down in a chamber on the microscope stage. These procedures were all carried out under infrared (>900 nm) light. ON alpha-like retinal ganglion cells were identified based on their large somas and characteristic spike responses to a light step32. Pipettes for whole cell voltage-clamp recordings were filled with an internal solution containing (in mM) 105 CsCH3SO3, 10 TEA-Cl, 20 HEPES, 10 EGTA, 5 Mg-ATP, 0.5 Tris-GTP, and 2 QX-314 (pH ∼7.3 with CsOH, ∼280 mOsm). Series resistance (∼10-15 MΩ) was compensated 70%. The chamber was superfused at ∼8ml/min with Ames solution (Sigma Aldrich, St. Louis MO) warmed to 31-34°C. Light stimuli were delivered from a calibrated light-emitting diode with a peak output at 470 nm. Stimuli uniformly illuminated a 630 μm diameter spot centered on the recorded cell.
Ganglion cell sensitivity was measured from the strength of the flash required to produce a half-maximal response. Half-maximal flash strengths were estimated in two ways. First, the stimulus-response relation for each cell was fit with a saturating exponential function with the half-maximal flash strength as the (only) free parameter. Second, half-maximal flash strengths were estimated by linearly interpolating between the two nearest responses. These approaches yielded similar results. The mean and standard error of the half-maximal flash strengths for ganglion cells from Cabp5+/+ and Cabp5-/- mice were compared.
Cloning and expression in bacteria of CaBP5, CaM, CT1 and CT2 domains of Cav1 calcium channels
The C-terminal domain (CT1) containing the CaM-binding domain (CBD) and distal C-terminal domain downstream of the CT1 (CT2) of mouse α1 1.4, and the mouse α1 1.3 CT1 were subcloned and fused to a 6His tag as described previously 33. The rat α1 1.2 CT1 domain (amino acid 1523-1668) was amplified with primers FH675 (5′-CACCCTGGATGAATTCAAGAGAATCTGGG-3′) and FH688 (5′TCACAGCCCCTGCTCTTTTCGCT3′) from cDNA encoding the rbcII variant of the rat brain α1 1.2. The mouse CaBP5 was amplified by PCR with primers FH700 (5′-CACCATGCAGTTTCCAATGGGTCCTG-3′) and C16 (5′-TCAGCGAGACATCATCTTCACAAAC-3′) and the mouse CaM was amplified by PCR with C208 (5′-caccatggctgatcagctgac 3′) and C209 (5′-TCATTTTGCAGTCATCATCTG-3′) from mouse cDNA4 and subcloned into the pentr/DTOPO vector (Entry clone, Gateway technology, Invitrogen, Carlsbad, CA). These cDNAs were then transferred by recombination in the pDest17 or pDest15 vectors for expression in bacteria and fused to a His-tag or GST-tag, respectively. The fusion proteins were expressed in BL21(DE3)pLysS E. coli after induction with 0.2 mM IPTG and purified on Ni2+-NTA or glutathione column according to the manufacturer's protocol.
Binding of a cytoplasmic fragment of Cav1.2 α1 to CaBP5 using affinity chromatography
Purified His tagged-Cav1.2 α1 CBD (CT1) was loaded onto the CaBP5-Sepharose column equilibrated with PBS buffer (10 mM sodium phosphate, 150 mM NaCl, pH 7.5) containing 2 mM benzamidine and 1 mM CaCl2. The column was then washed with 100 bed volumes of the same buffer. The elution was performed with 5 mM EGTA followed by 0.1 M glycine buffer, pH 2.5. Fractions were collected and aliquots were analyzed by SDS-PAGE followed by Western blotting with an anti-His tag antibody.
Gel overlay assay
Recombinant 6His-tagged purified proteins (2 μg) were separated on SDS-PAGE and transferred to PVDF membranes. After overnight saturation at 4°C in PBS, 0.1 % Tween-20 and 3% non-fat milk, the membrane were incubated in PBS, 0.1 % Tween-20, 2% non-fat milk (blotting buffer) containing 2 μg/ml of GST-tagged proteins for 1 h at room temperature. The blots were washed 3 × 5 minutes with 10 ml of blot buffer and then incubated for 1 h with anti-GST antibody in blotting buffer at room temperature. After 3 washes of 5 min each, the blots were incubated with an anti-mouse antibody conjugated to alkaline phosphatase for 1 hour at room temperature. The bound recombinant proteins were visualized by incubation with NBT/BCIP (Promega). The interactions were tested in the presence or absence of calcium. For the analysis in the absence of Ca2+, 5 mM EGTA was added to the blotting buffer.
Electrophysiological recordings of transfected cells
HEK293T cells were grown to 70-80% confluence and transfected using Gene Porter reagent (Gene Therapy Systems, San Diego, CA) according to the manufacturer's protocols. Cells were transfected with ∼5 μg total DNA (α11.2 (2 μg), β2A (0.8 μg), α2δ (0.8 μg)±CaBP5 (0.1 μg) and GFP expression plasmid (0.01 μg) for fluorescent detection of transfected cells. All electrophysiological data were acquired with EPC-9 patch-clamp amplifier driven by Pulse software (HEKA Elektronik, Lambrecht/Pfalz, Germany) and analyzed with Igor Pro software (Wavemetrics, Lake Oswego, Oregon). Extracellular recording solutions contained (in mM): 150 Tris, 1 MgCl2, and 10 CaCl2. Intracellular solutions consisted of (in mM): 140 N-methyl-D-glucamine, 10 HEPES, 2 MgCl2, 2 Mg-ATP, and 5 EGTA. The pH of intracellular and extracellular recording solutions was adjusted to 7.3 with methanesulfonic acid. Electrode resistances were typically 1-2 MΩ in the bath solution, and series resistance was∼2-4 MΩ, compensated up to 80%. All averaged data are presented as the mean±s.e.m. Statistical significance of differences between two groups was determined by student's t-test as indicated (SigmaPlot, SPSS Science, Chicago, IL).
Results
Generation of CaBP5 knockout mice
To study the role of CaBP5 in vivo, we generated CaBP5 knockout mice (Cabp5-/-) by replacing exon 1and exon 2 of the Cabp5 gene with a PGK-neo cassette (Fig. 1A). Agouti offspring obtained from one male chimera were genotyped by PCR to verify germ line transmission (Fig. 1B). The targeting of the Cabp5 allele was confirmed by the presence of a 3.9 kb Hind II fragment using Southern blotting with a 5′probe (Fig. 1C).
Figure 1.

(A) Generation of CaBP5 knockout mice using gene targeting. Exon and restriction map of the Cabp5 gene locus, targeting vector and targeted Cabp5 gene. In the targeting vector, the neo cassette replaces exon 1 and exon 2 of the Cabp5 gene. The targeting vector was constructed by using a ∼2 kb DNA fragment as short arm that extends upstream of the initial ATG. The long arm is a ∼6.0 kb genomic fragment encompassing intron 2 to intron 5 of the Cabp5 gene. The PGK-DTA and HSV-TK cassettes were included for negative selection. A gray box marks the position of the 5′ probe hybridizing to a 300bp region located upstream the short arm of the Cabp5 gene. H: HindII, M: MscI. (B) PCR-based genotyping of wild-type (+/+), heterozygous (+/-) and knockout (-/-) mice. A 620- and 800-bp PCR product is amplified from the wild-type Cabp5 and the targeted loci, respectively. (C) Southern blot analysis of targeted gene. HindII-digested genomic DNAs from wild type (+/+), heterozygous (+/-) and knockout (-/-) were probed with a 300 bp 5′ probe. A fragment of 2.9 kb indicative of the wild-type Cabp5 gene is identified in wild type and heterozygous mice. Knockout and heterozygous mice show a fragment of 3.9 kb corresponding to the targeted Cabp5 gene.
Morphological characterization of Cabp5-/- mouse retina
The expression of CaBP5 was analyzed by immunoblotting using antibodies against CaBP5 and PKCα, which served as a marker protein expressed in rod bipolar cells. As expected, CaBP5 was not detected in retinal extract from Cabp5-/- mice (Fig. 2A). As reported in previous studies18, 19, CaBP5 was localized in rod bipolar cells, type-3 OFF and type-5 ON cone bipolar cells; axon terminals of these cells form three distinct layers in the IPL (Fig. 2B). No CaBP5 was detected by immunohistochemistry in the Cabp5-/- mice. However, calretinin immunostaining revealed a normal distribution of ganglion cells and amacrine cells processes forming three bands in the inner plexiform layers both in Cabp5+/+ and Cabp5-/- retinas (Fig. 2B).
Figure 2.
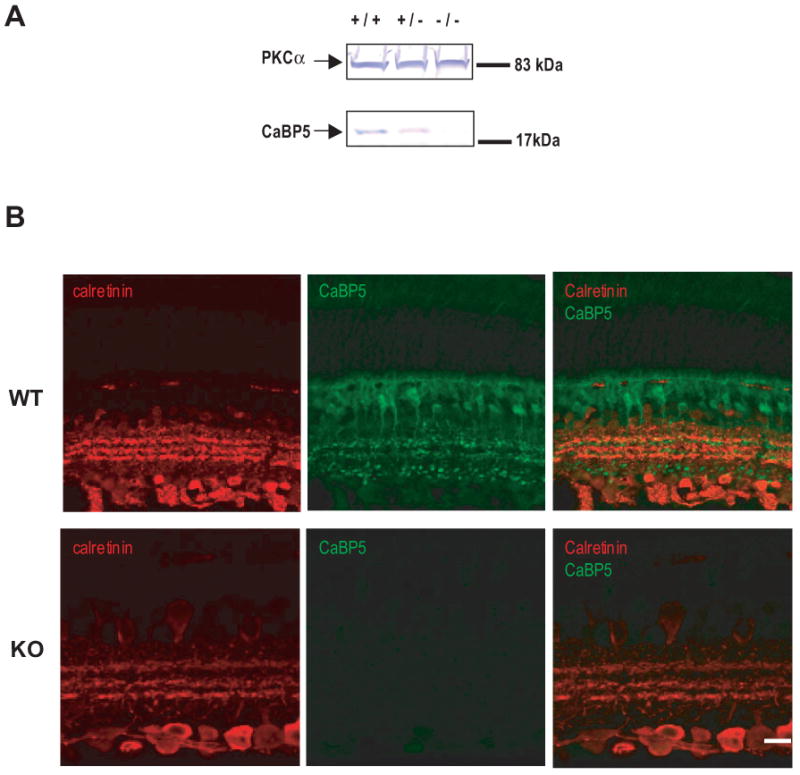
(A)Western blot analysis of retinal extracts prepared from Cabp5+/+, Cabp5+/-, Cabp5-/- mice probed with antibodies to CaBP5 and PKCα. CaBP5 proteins are not detected in Cabp5-/- retinas confirming targeting of the Cabp5 gene. (B) Immunofluorescence for CaBP5 and calretinin in 6-week-old Cabp5+/+ (WT) and Cabp5-/- (KO) mouse retinas. The lack of CaBP5 immunoreactivity in the Cabp5-/- retina confirmed the loss of CaBP5 protein in the knockout mice. Scale bar, 20 μm.
To determine whether CaBP5 deficiency triggers structural changes, the morphology and expression of marker proteins was analyzed in 6-week-old mice using electron and confocal microscopy. The thickness and organization of the retinal layers appeared normal in the CaBP5 knockout mice compared with the wild-type mice as analyzed with antibodies against PKCα (rod bipolar cell marker) and calbindin (horizontal cell marker) and DAPI labeling of nuclei (Fig. 3A). There was no apparent difference in the morphology of the dendrites and axons of rod bipolar cells in wild-type and CaBP5 knockout mice as shown in higher magnification images (Fig. 3B). The dendrites were well developed and normally stratified in the OPL of wild-type and CaBP5 knockout mice. The shape and number of bipolar cell terminals were also comparable in both genotypes. Synapse morphology in both the outer plexiform layer (OPL) and inner plexiform layer (IPL) was analyzed using an antibody against the ribbon marker ribeye/CtBP2. Normal horseshoe-shaped and punctuate staining was observed for synaptic ribbons of wild-type and CaBP5 knockout mice located in the OPL and IPL, respectively (Fig. 3C). The density and morphology of labeled ribbons were similar in wild-type and CaBP5 knockout mice. No changes in retinal morphology were observed in 1-year-old CaBP5 knockout mice (data not shown).
Figure 3. Morphological characterization of 6-week-old Cabp5+/+(WT) and Cabp5-/- (KO) mouse retina.

(A) Immunolocalization of PKCα (red) and calbindin (green) in mouse retina cross-sections. The cell nuclei were stained with DAPI (blue). Scale bar, 20 μm. (B) Immunofluorescence of PKCα (red) and calbindin (green) in the OPL (A, A′) and in the IPL (B, B′). Scale bars, 5 μm. (C) Immunofluorescence of ribeye (green) in the OPL (A, A′) and in the IPL (B, B′). Scale bars, 2 μm.
The structural organization of mouse retina was also analyzed at the ultrastructural level using transmission electron microscopy. No evidence of morphological changes in any retinal layers was observed in CaBP5 knockout mice (Fig. 4). The lamination pattern and the thickness of all layers appeared similar in wild-type and CaBP5 knockout mice. The cell density and morphology were also comparable in both genotypes.
Figure 4. Analysis of 6-week-old retina morphology by transmission electron microscopy.

(A) Montage of mouse retina cross–sections analyzed by transmission EM. Scale bar, 10 μm. (B) Mouse retina cross-sections through the OPL and IPL. Higher magnification of a cross–section through the OPL (upper row) and inner IPL/ganglion cell layer (bottom row). Scale bars, 5 μm.
Visual responses in CaBP5 knockout mice using ERG recordings
Because CaBP5 is localized throughout the bipolar cells, including fine processes of the dendrites and in the ramifying axons, we tested if deletion of CaBP5 might affect synaptic transmission between photoreceptors and bipolar cells using ERGs. ERGs of wild-type and CaBP5 knockout mice were recorded under both scotopic and photopic conditions to evaluate the effect on rod- and cone-mediated signals. In both scotopic and photopic conditions, no statistically significant reduction in the a-wave and b-wave amplitudes of CaBP5 knockout mice was observed compared with wild-type for any individual flash intensity (P>0.1 for all flash intensities, see Material and Methods)(Fig. 5). There was also no significant difference in the amplitudes of ERGs of either genotype in 1-year-old mice ERGs (data not shown). These data argue against a substantial role for CaBP5 in regulating synaptic transmission between photoreceptors and bipolar cells.
Figure 5. Single flash ERG responses to light stimuli of increasing intensity for 6-week-old Cabp5+/+and Cabp5-/- mice.

Serial responses to increasing flash stimuli were obtained for Cabp5+/+and Cabp5-/- for selected intensities under scotopic conditions (A) and photopic conditions (B), and plotted as a function of a-wave or b-wave amplitude versus light intensity. Representative ERG waveforms recorded from Cabp5+/+and Cabp5-/-mice in response to flashes of increasing intensity are shown on the left. In both scotopic and photopic conditions, no significant differences were observed between the a-wave- and b-wave-amplitudes of Cabp5+/+and Cabp5-/-mice (P>0.1). SEM bars are shown.
Responses of Cabp5+/+ and Cabp5-/- ON ganglion cells
At low light levels signals traverse the mammalian retina through the specialized rod bipolar pathway. We analyzed the effect of CaBP5 deficiency on signals mediated by this pathway by measuring the sensitivity of an identified class of ON ganglion cells to dim light flashes. Excitatory synaptic inputs were measured by holding a ganglion cell at -70 mV, near the reversal potential for inhibitory inputs. Figure 6A and B superimpose responses to a series of light flashes for single ganglion cells from a wild-type and a CaBP5-/- mouse. Figure 6C plots the relationship between response amplitude and flash strength for a population of cells. Ganglion cells from CaBP5-/- mice were, on average, ∼50% less sensitive than those from wild-type mice (p<0.05 for difference in half-maximal flash strengths, see Material and Methods). Thus CaBP5 enhances the sensitivity of rod-mediated responses reaching the retinal ganglion cells.
Figure 6. Flash responses of Cabp5+/+ and Cabp5-/- ON ganglion cells.

Flash families measured from a Cabp5+/+ ON ganglion cell (A) and a Cabp5-/- ON ganglion cell (B). Average responses are superimposed for flashes producing 0.001 to 0.5 photon/μm2. (C) Stimulus-response relationship for Cabp5+/+ and Cabp5-/- ON ganglion cells. Error bars are SEM. Half-maximal flash strengths, estimated from saturating exponential fits to the stimulus-response relations, were was 0.03045 ± 0.0035 (mean ± SEM, n=9) for Cabp5+/+ cells and 0.04971 ± 0.0034 for Cabp5-/- cells (n=7).
Analysis of CaBP5 interaction and modulation of Cav1.2
CaBP1 and CaBP4, the two CaBPs from the CaBP subfamily whose function has been most extensively investigated to date, differently modulate the activity of voltage-dependent calcium channels. Due to the high similarity between CaBPs, we tested the hypothesis that CaBP5 can also interact with and modulate voltage-dependent calcium channels. Because Cav1.2 was previously reported to be expressed in ON bipolar cells34-36, we analyzed the interaction of CaBP5 with Cav1.2.
CaBP5 colocalizes with Cav1.2 in rod bipolar cells. To be a physiological partner for CaBP5, Cav1 must colocalize with CaBP5. Because we had previously shown that CaBP5 is expressed in rod bipolar cells1, we first confirmed that Cav1.2 voltage-dependent calcium channel is also expressed in the rod bipolar cells. Cav1.2 is expressed in rod bipolar cells as shown by the extensive colocalization of Cav1.2 and PKCα, a marker for rod bipolar cells (Fig. 7A). We then confirmed that CaBP5 is coexpressed with Cav1.2 by double labeling with anti-CaBP5 and anti-Cav1.2 antibodies (Fig. 7A).
Figure 7.

(A) Colocalization of Cav1.2 voltage-dependent calcium channels with CaBP5 and PKCα in mouse retina. (A′-C′) Confocal images of mouse retina sections double-labeled with antibodies to PKCα (green, A′) and Cav1.2α1 (red, B′). Extensive colocalization of Cav1.2α1 and PKCα is observed in rod bipolar cells and appears yellow in the merged images (C′). Cav1.2 is expressed only in cells also labeled with the rod bipolar marker PKCαand is thus specifically expressed in rod bipolar cells. Scale bars: 20 μm. (D′-F′). Double-labeling of mouse retinal sections with CaBP5 (green, D′) and Cav1.2α1 (red, E′). CaBP5 colocalized with Cav1.2 in rod bipolar cells, predominantly at the axon terminals, and appears yellow in the merged images (F). Scale bars: 20 μm. (B) Affinity chromatography of purified recombinant Cav1.2 α1 CBD on CaBP5 column. His tagged- Cav1.2α1 CT1 was loaded onto the CaBP5-Sepharose column equilibrated with PBS buffer containing 1 mM CaCl2. After washes with the same buffer, the proteins were eluted with 3 mM EGTA followed by 0.2 M glycine buffer, pH 2.1. The eluted fractions were probed with anti-His antibodies. Lane1: protein loaded on the column; lane 2: protein present in the flow-trough; lane 3: last wash fraction before elution; lanes 4 to 6: elution with 5 mM EGTA; lane 7: last fraction before elution with glycine buffer; lanes 8 and 9: further elution with 0.1 M glycine buffer, pH 2.4. (C) Gel overlay assay of recombinant CaBP5 with α1 Cav1 cytoplasmic domains. His-tagged α1 CBD from Cav1.2, Cav1.3 and Cav1.4 (CT1) or C-terminal domain without CBD (CT2) were separated on SDS-PAGE and transferred to PVDF membranes, which were incubated with CaM-GST and CaBP5-GST in the presence or absence of EGTA. Bound proteins were detected with an anti-GST antibody. Ponceau staining (right) shows the relative amount of purified proteins. (D) Effect of CaBP5 on activation of Cav1.2 Ca2+ currents. Cav1.2 Ca2+ currents were evoked by 50-ms pulses from −80 mV to various voltages in HEK293T cells transfected with Cav1.2 (α11.2, β2A, α2δ) alone or cotransfected with CaBP5 (n=7 each). Current amplitudes were normalized to the largest in the series (I/Imax) and plotted (mean ± SE) against test voltage. Smooth lines represent fits by Boltzmann equation. CaBP5 significantly increased V1/2 (28.2 ± 2.8 vs 19.4 ± 2.3 for Cav1.2 alone, p=0.03) and k (-10.0 ± 0.4 vs. −8.9 ± 0.2 for Cav1.2 alone, p=0.05). (E) Effect of CaBP5 on inactivation of Cav1.2 Ca2+ currents. Cav1.2 Ca2+ currents were evoked by 2-s pulses from −80 to +10 mV (for Cav1.2 alone) or +20 mV (for +CaBP5). Inactivation was measured at these different test voltages due to the ∼+10 mV-shift in voltage-dependent activation in cells cotransfected with CaBP5. HEK293T cells were transfected with Cav1.2 (α11.2, β2A, α2δ) alone (black) or cotransfected with CaBP5 (red). Inactivation was measured as Ires/Ipk which was the current amplitude at 1-s normalized to the peak current amplitude. CaBP5 did not affect the kinetics of current decay but significantly suppressed inactivation of the Ca2+ current (p=0.02, n=6 each for Cav1.2 alone and +CaBP5).
CaBP5 binds to Cav1.2 in a Ca2+dependent manner. L-type voltage-dependent calcium channels are modulated by CaM, which binds to a domain in the C-terminal domain of the α1 subunit37-39. We have shown previously that CaBPs interacts with and modulates Cav2 6 and Cav1channels12, 17, 40. We tested whether CaBP5 can directly interact with a cytoplasmic fragment of Cav1.2 α1 containing the CaM binding sequence (CBD) using affinity chromatography. The Cav1.2α1 fragment CT1 domain (CBD, amino acid 1523-1668) was loaded on CaBP5-coupled sepharose in the presence of Ca2+. Most of the proteins were detected in the fractions first eluted with EGTA suggesting that CaBP5 binds mostly in a Ca2+-dependent manner to the CBD of Cav1.2α1 (Fig. 7B).
We further investigated the interaction of CaBP5 with Cav1 CT1 using gel overlay assay. Like CaM, GST-CaBP5 bound to 6His-tagged fusion proteins containing the CBD (CT1) of Cav1α1 (Fig. 7C). The binding was specific in that no binding was detected to a cytoplasmic fragment without the CBD (CT2). The binding of CaBP5 to α1 CT1 was observed in the presence of Ca2+ but was barely detectable in the absence of Ca2+, confirming that CaBP5 requires Ca2+ for binding to Cav1.2α1.
CaBP5 modulates Cav1.2. To test whether CaBP5 can modulate the activity of Cav1.2 channels, we analyzed Ca2+ currents using whole-cell patch-clamp recordings in transfected HEK293 cells. In these experiments, CaBP5 caused a positive shift in the half-activation voltage (V1/2) (19 ± 2 mV in WT compared to 28 ± 2 in KO, p=0.03). CaBP5 also influenced the slope of the I-V relationship (k =-10.0 ± 0.4 for CaBP5 KO vs. -8.9 ± 0.2 for Cav1.2 alone, p=0.05) (Fig. 7D). This effect of CaBP5 on the I-V curve caused a significant increase of the whole-cell Ca2+ current at more depolarized membrane voltages (∼20%, from +40 to +70 mV; p<0.05). In our experimental conditions, the effect of CaBP5 occurs at more depolarized potentials than bipolar cell physiological membrane potentials but the voltage dependence of the activation of Cav1.2 channels expressed in HEK293 cells is also shifted to more depolarized potentials compared with that of native Cav1.2 channel24. CaBP5 could cause a similar depolarizing shift in the voltage-dependence of activation of Cav1.2 in physiological conditions.
We also studied the effect of CaBP5 on inactivation of Cav1.2. Ca2+ currents. Cav1.2 Ca2+ currents were evoked by 2-s pulses from −80 to +10 mV (for Cav1.2 alone) or +20 mV (for +CaBP5). Inactivation was measured at these different test voltages due to the ∼+10 mV-shift in voltage-dependent activation in cells cotransfected with CaBP5. HEK293T cells were transfected with Cav1.2 (α11.2, β2A, α2δ) alone (black) or cotransfected with CaBP5 (red). Inactivation was measured as Ires/Ipk which was the current amplitude at 1-s normalized to the peak current amplitude. CaBP5 did not affect the kinetics of current decay but significantly suppressed the amount of inactivation (Ires/Ipk) of the Ca2+ current (p=0.02, n=6 each for Cav1.2 alone and +CaBP5) (Fig. 7E). Together, these results indicate that CaBP5 potentiates the activity of Cav1.2 channels, through effects on channel activation and inactivation.
Discussion
We generated and characterized CaBP5 knockout mice to investigate the function of CaBP5 in the retina. Our results suggest that CaBP5 is required for the normal transmission of the rod-mediated responses across the retina.
The structural organization of the retina appeared normal in CaBP5 knockout mice. This suggests that CaBP5 is not essential for normal bipolar cell development although it is expressed throughout the postnatal retina development (data not shown). CaBP5 deficiency did not result in any obvious change in the stratification, density and morphology of rod bipolar cell dendrites, axons and cell bodies. This indicates that structural changes are not likely to account for the changes in light responses observed in CaBP5 knockout mice.
Rod-mediated responses of retinal ganglion cells in the absence of CaBP5 had a reduced sensitivity compared to wild-type ganglion cells. This effect was modest – a ∼50% reduction increase in half-saturating flash strength – and the amplitude and kinetics of the ganglion cell responses otherwise appeared normal. The effect of CaBP5 on ganglion cell sensitivity could reflect defects in signal transmission at any previous step in the rod bipolar pathway. Because CaBP5 is expressed primarily in bipolar cells, we propose that the deficiency reflects a change in the presynaptic function of rod bipolar cells.
CaBP5 could act on the voltage-gated calcium channels that control transmitter release from the rod bipolar cells (23, 25, 27, 41, 42, 43 for recent review). More generally, we suggest that CaBPs are cell-type specific proteins that play a key role in Ca2+ signaling through regulation of a common target, the voltage-dependent calcium channel5-7, 12, 17, 44. This hypothesis is supported by our findings that Cav1.2 colocalizes with CaBP5 in rod bipolar cells and previous data that Cav1.2 is expressed in ON bipolar cells34-36. CaBP5 modulates both activation and inactivation of Cav1.2 in transfected cells. Thus CaBP5 shifted the Ca2+ channel activation curve to more positive potentials and suppressed calcium-dependent inactivation of the Cav1.2 Ca2+ current. Similar changes in the rod bipolar calcium channels could have a substantial effect on the transmission of rod-mediated signals from rod bipolar cells to AII amacrine cells. This synapse has a high gain in darkness and thus may be particularly susceptible to changes in the voltage-dependence of calcium entry45.
In summary, our results provide the first evidence for a role of CaBP5 in visual function. Although further studies will be needed to establish the molecular mechanisms by which CaBP5 affects the transmission of the light signal, our data suggest that CaBP5 participates in modulating retinal sensitivity possibly through modulation of voltage-gated calcium channels. Identifying the role of CaBP5 will not only contribute to our understanding of the basic processes modulated by CaBP5, but might also give insight into the contribution of a specific subset of bipolar cells to the processing of the light stimulus throughout the retinal circuitry.
Acknowledgments
The authors thank Amber Jimenez for her outstanding technical assistance in selecting the targeted ES clone, Edward Parker for his great expertise with the EM experiments, Dr. Jing Huang for her expert work in generating the anti-CaBP5 monoclonal antibody, Dr. Philippe Soriano for the PGKneolox2DTA vector, Dr. Carola Driessen for the basic targeting vector, Dr. Carol Ware and La'Akea Siverts (UW Transgenic Resource Program) for their expert work in transfecting ES cells and injecting mouse embryos and Dr. Artur Cideciyan for helpful comments on the manuscript.
This research was supported by a Royalty Research Funding award to FH, the Bridge Funding Program at the University of Washington and Vision CORE Grant EY01730, NIH grants NS044922 and DC009433 to AL and EY11850 to FR, and by HHMI.
References
- 1.Haeseleer F, Sokal I, Verlinde C, et al. Five members of a novel Ca2+-binding protein (CABP) Subfamily with Similarity to Calmodulin. Journal of Biological Chemistry. 2000;275:1247–1260. doi: 10.1074/jbc.275.2.1247. [DOI] [PMC free article] [PubMed] [Google Scholar]
- 2.Haeseleer F, Imanishi Y, Sokal I, Filipek S, Palczewski K. Calcium-binding proteins: Intracellular sensors from the calmodulin superfamily. Biochemical and Biophysical Research Communications. 2002;290:615–623. doi: 10.1006/bbrc.2001.6228. [DOI] [PubMed] [Google Scholar]
- 3.Haeseleer F, Palczewski K. Calmodulin and Ca2+-binding proteins (CaBPs): Variations on a theme. In: Palczewski K, editor. Photoreceptors and Calcium. Georgetown, Texas: Landes Bioscience; 2002. [DOI] [PubMed] [Google Scholar]
- 4.Sokal I, Li N, Verlinde C, Haeseleer F, Baehr W, Palczewski K. Ca2+-binding proteins in the retina: from discovery to etiology of human disease. Biochimica Et Biophysica Acta-Molecular Cell Research. 2000;1498:233–251. doi: 10.1016/s0167-4889(00)00099-9. [DOI] [PubMed] [Google Scholar]
- 5.Zhou H, Kim SA, Kirk EA, et al. Ca2+-binding protein-1 facilitates and forms a postsynaptic complex with Ca(v)1.2 (L-Type) Ca2+ channels. Journal of Neuroscience. 2004;24:4698–4708. doi: 10.1523/JNEUROSCI.5523-03.2004. [DOI] [PMC free article] [PubMed] [Google Scholar]
- 6.Lee A, Westenbroek RE, Haeseleer F, Palczewski K, Scheuer T, Catterall WA. Differential modulation of Ca(v)2.1 channels by calmodulin and Ca2+-binding protein 1. Nature Neuroscience. 2002;5:210–217. doi: 10.1038/nn805. [DOI] [PMC free article] [PubMed] [Google Scholar]
- 7.Yang PS, Alseikhan BA, Hiel H, et al. Switching of Ca2+-dependent inactivation of Ca(V)1.3 channels by calcium binding proteins of auditory hair cells. Journal of Neuroscience. 2006;26:10677–10689. doi: 10.1523/JNEUROSCI.3236-06.2006. [DOI] [PMC free article] [PubMed] [Google Scholar]
- 8.Kinoshita-Kawada M, Tang JS, Xiao R, Kaneko S, Foskett JK, Zhu MX. Inhibition of TRPC5 channels by Ca2+-binding protein 1 in Xenopus oocytes. Pflugers Archiv-European Journal of Physiology. 2005;450:345–354. doi: 10.1007/s00424-005-1419-1. [DOI] [PubMed] [Google Scholar]
- 9.Kasri NN, Holmes AM, Bultynck G, et al. Regulation of InsP(3) receptor activity by neuronal Ca2+-binding proteins. Embo Journal. 2004;23:312–321. doi: 10.1038/sj.emboj.7600037. [DOI] [PMC free article] [PubMed] [Google Scholar]
- 10.Yang J, McBride S, Mak DOD, et al. Identification of a family of calcium sensors as protein ligands of inositol trisphosphate receptor Ca2+ release channels. Proceedings of the National Academy of Sciences of the United States of America. 2002;99:7711–7716. doi: 10.1073/pnas.102006299. [DOI] [PMC free article] [PubMed] [Google Scholar]
- 11.Haynes LP, Tepikin AV, Burgoyne RD. Calcium-binding protein 1 is an inhibitor of agonist-evoked, inositol 1,4,5-trisphosphate-mediated calcium signaling. Journal of Biological Chemistry. 2004;279:547–555. doi: 10.1074/jbc.M309617200. [DOI] [PubMed] [Google Scholar]
- 12.Haeseleer F, Imanishi Y, Maeda T, et al. Essential role of Ca2+-binding protein 4, a Ca(v)1.4 channel regulator, in photoreceptor synaptic function. Nature Neuroscience. 2004;7:1079–1087. doi: 10.1038/nn1320. [DOI] [PMC free article] [PubMed] [Google Scholar]
- 13.Zeitz C, Kloeckener-Gruissem B, Forster U, et al. Mutations in CABP4, the gene encoding the Ca2+-binding protein 4, cause autosomal recessive night blindness. American Journal of Human Genetics. 2006;79:657–667. doi: 10.1086/508067. [DOI] [PMC free article] [PubMed] [Google Scholar]
- 14.Strom TM, Nyakatura G, Apfelstedt-Sylla E, et al. An L-type calcium-channel gene mutated in incomplete X-linked congenital stationary night blindness. Nature Genetics. 1998;19:260–263. doi: 10.1038/940. [DOI] [PubMed] [Google Scholar]
- 15.Boycott KM, Maybaum TA, Naylor MJ, et al. A summary of 20 CACNA1F mutations identified in 36 families with incomplete X-linked congenital stationary night blindness, and characterization of splice variants. Human Genetics. 2001;108:91–97. doi: 10.1007/s004390100461. [DOI] [PubMed] [Google Scholar]
- 16.Bech-Hansen NT, Naylor MJ, Maybaum TA, et al. Loss-of-function mutations in a calcium-channel alpha(1)-subunit gene in Xp11.23 cause incomplete X-linked congenital stationary night blindness. Nature Genetics. 1998;19:264–267. doi: 10.1038/947. [DOI] [PubMed] [Google Scholar]
- 17.Cui GY, Meyer AC, Calin-Jageman I, et al. Ca2+-binding proteins tune Ca2+-feedback to Ca(v)1.3 channels in mouse auditory hair cells. Journal of Physiology-London. 2007;585:791–803. doi: 10.1113/jphysiol.2007.142307. [DOI] [PMC free article] [PubMed] [Google Scholar]
- 18.Haverkamp S, Ghosh KK, Hirano AA, Wassle H. Immunocytochemical description of five bipolar cell types of the mouse retina. Journal of Comparative Neurology. 2003;455:463–476. doi: 10.1002/cne.10491. [DOI] [PMC free article] [PubMed] [Google Scholar]
- 19.Haeseleer F, Sokal I, Verlinde C, et al. Five members of a novel Ca2+-binding protein (CABP) subfamily with similarity to calmodulin. Journal of Biological Chemistry. 2000;275:1247–1260. doi: 10.1074/jbc.275.2.1247. [DOI] [PMC free article] [PubMed] [Google Scholar]
- 20.Ghosh KK, Bujan S, Haverkamp S, Feigenspan A, Wassle H. Types of bipolar cells in the mouse retina (vol 469, pg 70, 2004) Journal of Comparative Neurology. 2004;476:202–203. doi: 10.1002/cne.10985. [DOI] [PubMed] [Google Scholar]
- 21.Haverkamp S, Haeseleer F, Hendrickson A. A comparison of immunocytochemical markers to identify bipolar cell types in human and monkey retina. Visual Neuroscience. 2003;20:589–600. doi: 10.1017/s0952523803206015. [DOI] [PubMed] [Google Scholar]
- 22.Pan ZH. Voltage-activated Ca2+ channels and ionotropic GABA receptors localized at axon terminals of mammalian retinal bipolar cells. Visual Neuroscience. 2001;18:279–288. doi: 10.1017/s095252380118212x. [DOI] [PubMed] [Google Scholar]
- 23.Protti DA, Llano I. Calcium currents and calcium signaling in rod bipolar cells of rat retinal slices. Journal of Neuroscience. 1998;18:3715–3724. doi: 10.1523/JNEUROSCI.18-10-03715.1998. [DOI] [PMC free article] [PubMed] [Google Scholar]
- 24.Pan ZH. Differential expression of high- and two types of low-voltage- activated calcium currents in rod and cone bipolar cells of the rat retina. Journal of Neurophysiology. 2000;83:513–527. doi: 10.1152/jn.2000.83.1.513. [DOI] [PubMed] [Google Scholar]
- 25.Hartveit E. Reciprocal synaptic interactions between rod bipolar cells and amacrine cells in the rat retina. Journal of Neurophysiology. 1999;81:2923–2936. doi: 10.1152/jn.1999.81.6.2923. [DOI] [PubMed] [Google Scholar]
- 26.de la Villa P, Vaquero CF, Kaneko A. Two types of calcium currents of the mouse bipolar cells recorded in the retinal slice preparation. European Journal of Neuroscience. 1998;10:317–323. doi: 10.1046/j.1460-9568.1998.00051.x. [DOI] [PubMed] [Google Scholar]
- 27.Singer JH, Diamond JS. Sustained Ca2+ entry elicits transient postsynaptic currents at a retinal ribbon synapse. Journal of Neuroscience. 2003;23:10923–10933. doi: 10.1523/JNEUROSCI.23-34-10923.2003. [DOI] [PMC free article] [PubMed] [Google Scholar]
- 28.Driessen C, Winkens H, Haeseleer F, Palczewski K, Janssen J. Novel targeting strategy for generating mouse models with defects in the retinoid cycle. Vision Research. 2003;43:3075–3079. doi: 10.1016/s0042-6989(03)00483-8. [DOI] [PubMed] [Google Scholar]
- 29.Soriano P. The PDGF alpha receptor is required for neural crest cell development and for normal patterning of the somites. Development. 1997;124:2691–2700. doi: 10.1242/dev.124.14.2691. [DOI] [PubMed] [Google Scholar]
- 30.Robson JG, Saszik SM, Ahmed J, Frishman LJ. Rod and cone contributions to the a-wave of the electroretinogram of the macaque. Journal of Physiology-London. 2003;547:509–530. doi: 10.1113/jphysiol.2002.030304. [DOI] [PMC free article] [PubMed] [Google Scholar]
- 31.Lyubarsky AL, Falsini B, Pennesi ME, Valentini P, Pugh EN. UV- and midwave-sensitive cone-driven retinal responses of the mouse: A possible phenotype for coexpression of cone photopigments. Journal of Neuroscience. 1999;19:442–455. doi: 10.1523/JNEUROSCI.19-01-00442.1999. [DOI] [PMC free article] [PubMed] [Google Scholar]
- 32.Murphy GJ, Rieke F. Network variability limits stimulus-evoked spike timing precision in retinal ganglion cells. Neuron. 2006;52:511–524. doi: 10.1016/j.neuron.2006.09.014. [DOI] [PMC free article] [PubMed] [Google Scholar]
- 33.Lee A, Jimenez A, Cui G, Haeseleer F. Phosphorylation of the Ca2+-binding protein CaBP4 by protein kinase C zeta in photoreceptors. Journal of Neuroscience. 2007;27:12743–12754. doi: 10.1523/JNEUROSCI.4264-07.2007. [DOI] [PMC free article] [PubMed] [Google Scholar]
- 34.Xu HP, Zhao JW, Yang XL. Expression of voltage-dependent calcium channel subunits in the rat retina. Neuroscience Letters. 2002;329:297–300. doi: 10.1016/s0304-3940(02)00688-2. [DOI] [PubMed] [Google Scholar]
- 35.Kaneda M, Ito K, Morishima Y, Shigematsu Y, Shimoda Y. Characterization of voltage-gated ionic channels in cholinergic amacrine cells in the mouse retina. Journal of Neurophysiology. 2007;97:4225–4234. doi: 10.1152/jn.01022.2006. [DOI] [PubMed] [Google Scholar]
- 36.Satoh H, Aoki K, Watanabe S, Kaneko A. L-type calcium channels in the axon terminal of mouse bipolar cells. Neuroreport. 1998;9:2161–2165. doi: 10.1097/00001756-199807130-00002. [DOI] [PubMed] [Google Scholar]
- 37.Pitt GS, Zuhlke RD, Hudmon A, Schulman H, Reuter H, Tsien RW. Molecular basis of calmodulin tethering and Ca2+-dependent inactivation of L-type Ca2+ channels. Journal of Biological Chemistry. 2001;276:30794–30802. doi: 10.1074/jbc.M104959200. [DOI] [PubMed] [Google Scholar]
- 38.Erickson MG, Alseikhan BA, Peterson BZ, Yue DT. Preassociation of calmodulin with voltage-gated Ca2+ channels revealed by FRET in single living cells. Neuron. 2001;31:973–985. doi: 10.1016/s0896-6273(01)00438-x. [DOI] [PubMed] [Google Scholar]
- 39.Zuhlke RD, Pitt GS, Deisseroth K, Tsien RW, Reuter H. Calmodulin supports both inactivation and facilitation of L-type calcium channels. Nature. 1999;399:159–162. doi: 10.1038/20200. [DOI] [PubMed] [Google Scholar]
- 40.Zhou H, Kim SA, Kirk EA, et al. Ca2+-binding protein-1 facilitates and forms a postsynaptic complex with Cav1.2 (L-type) Ca2+ channels. J Neurosci. 2004;24:4698–708. doi: 10.1523/JNEUROSCI.5523-03.2004. [DOI] [PMC free article] [PubMed] [Google Scholar]
- 41.Katz B, Miledi R. Timing of Calcium Action During Neuromuscular Transmission. Journal of Physiology-London. 1967;189:535–&. doi: 10.1113/jphysiol.1967.sp008183. [DOI] [PMC free article] [PubMed] [Google Scholar]
- 42.Tachibana M, Okada T, Arimura T, Kobayashi K, Piccolino M. Dihydropyridine-Sensitive Calcium Current Mediates Neurotransmitter Release from Bipolar Cells of the Goldfish Retina. Journal of Neuroscience. 1993;13:2898–2909. doi: 10.1523/JNEUROSCI.13-07-02898.1993. [DOI] [PMC free article] [PubMed] [Google Scholar]
- 43.Heidelberger R, Thoreson WB, Witkovsky P. Synaptic transmission at retinal ribbon synapses. Progress in Retinal and Eye Research. 2005;24:682–720. doi: 10.1016/j.preteyeres.2005.04.002. [DOI] [PMC free article] [PubMed] [Google Scholar]
- 44.Zhou H, Yu K, McCoy KL, Lee A. Molecular mechanism for divergent regulation of Ca(v)1.2 Ca2+ channels by calmodulin and Ca2+-binding protein-1. Journal of Biological Chemistry. 2005;280:29612–29619. doi: 10.1074/jbc.M504167200. [DOI] [PubMed] [Google Scholar]
- 45.Dunn FA, Doan T, Sampath AP, Rieke F. Controlling the gain of rod-mediated signals in the mammalian retina. Journal of Neuroscience. 2006;26:3959–3970. doi: 10.1523/JNEUROSCI.5148-05.2006. [DOI] [PMC free article] [PubMed] [Google Scholar]