Abstract
Microchip capillary electrophoresis of proteins labeled either off- or on-chip with the “chameleon” CE dye 503 using poly(methyl methacrylate) microchips is presented. A simple dynamic coating using the cationic surfactant cetyltrimethyl ammonium bromide prevented nonspecific adsorption of protein and dye to the channel walls. The labeling reactions for both off- and on-chip labeling proceeded at room temperature without requiring heating steps. In off-chip labeling, a 9 ng/mL concentration detection limit for bovine serum albumin (BSA), corresponding to a ~7 fg (100 zmol) mass detection limit, was obtained. In on-chip tagging, the free dye and protein were placed in different reservoirs of the microchip, and an extra incubation step was not needed. A 1 μg/mL concentration detection limit for BSA, corresponding to a ~700 fg (10 amol) mass detection limit, was obtained from this protocol. The earlier elution time of the BSA peak in on-chip labeling resulted from fewer total labels on each protein molecule. Our on-chip labeling method is an important part of automation in miniaturized devices.
1 Introduction
Biomolecular separation using microchip capillary electrophoresis (CE) [1–3] is an important analytical method in the life sciences, because of small sample consumption, fast analysis times, and high throughput. Significantly, microchip CE can facilitate the realization of an integrated and automated micro total analysis system [4], in which sample preparation, separation, and detection are performed in a single miniaturized platform. Researchers have been and are still devoting considerable effort toward fully integrating operations in miniaturized systems. Pre- [5, 6] and post-column [7] amino acid labeling in integrated microchips have been reported. Recently, a hybrid droplet/channel microfluidic device was fabricated for in-line sample processing and separation [8]. Polymeric materials, such as poly(methyl methacrylate) (PMMA) [9] and poly(dimethylsiloxane) [10], play a key role in the fabrication of microfluidic devices [11–13]. Compared with conventional glass substrates, polymer microchips are superior in many respects, including cost, fabrication simplicity, and design flexibility.
Sample detection in miniaturized systems is a challenging, but important endeavor. Laser-induced fluorescence (LIF) offers low detection limits [14, 15], and systems can be made with relatively low cost. Although native fluorescence from tryptophan residues can be detected [16], the low abundance of tryptophan [17] and the need for ultraviolet excitation complicate native fluorescence detection. Alternatively, proteins can be derivatized with fluorescent labels through primary amines on more abundant lysine residues either before, during or after separation [14, 18, 19]. Two important considerations in finding suitable fluorescent labels for microchip CE are as follows. First, the labeling step for detection should either not perturb the analyte’s characteristics (e.g., charge, size, etc.), or should be carried out as close as possible to the detection time (during or after separation). This requires the labeling reaction to happen swiftly. A second concern is the small sample volume (and hence mass) loaded in microchip CE, which requires the labels to provide low detection limits.
Recently, fluorogenic “chameleon” dyes, consisting of a pyrylium group, have been developed [20]. The free label is weakly fluorescent, but generates a highly fluorescent product upon reaction with a primary amine. The dramatic color change that is observed upon the reaction led to the “chameleon” name, and these dyes have been used widely in CE of proteins [14, 15, 21, 22]. “Chameleon” labels offer desirable fluorogenic reagent properties, such as good detection limit [15, 23] and fast reaction time [14, 22], but in addition these labels do not change the natural charge characteristics of proteins upon reaction. However, the “chameleon” labels have not yet been used for microchip CE of proteins.
Here, we report microchip CE of proteins either off- or on-chip labeled with the “chameleon” CE dye 503 using PMMA microchips. Detection limits of ~10 ng/mL and ~1 μg/mL can be achieved in off- and on-chip labeling, respectively, using our straightforward and rapid procedures. No microchip surface pre-treatment is needed, and the labeling reaction proceeds at room temperature without requiring a heating step. In on-chip tagging, the labeling reaction and separation both occur inside the microchip; thus, no additional operations are needed for the incubation step. On-chip labeling offers a simple and fast method for automating protein analysis in microchip CE.
2 Materials and methods
2.1 Materials
The CE dye 503 kit was from Active Motif (Carlsbad, CA). Although the company does not specify the structure or chemical name of the reagent in the CE dye 503 kit, the product literature and publications [21, 22] indicate that the dye is similar to the “chameleon” label, Py-1 [21]. Fluorescein sodium salt was from Spectrum Quality Products Inc. (New Brunswick, NJ). Bovine serum albumin (BSA, 66.5 kDa), cytochrome C (CYC, 10–15 kDa, from bovine heart), lysozyme (LYZ, 14.4 kDa, from chicken egg white), dimethyl sulfoxide (DMSO), cetyltrimethyl ammonium bromide (CTAB), and sodium bicarbonate of analytical purity were from Sigma (St. Louis, MO).
2.2 Microchip design and operation
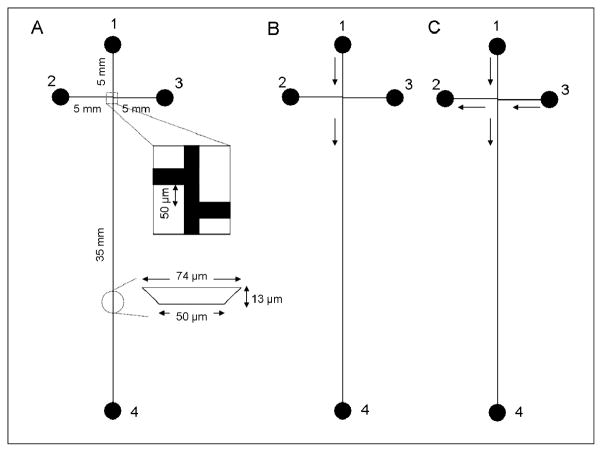
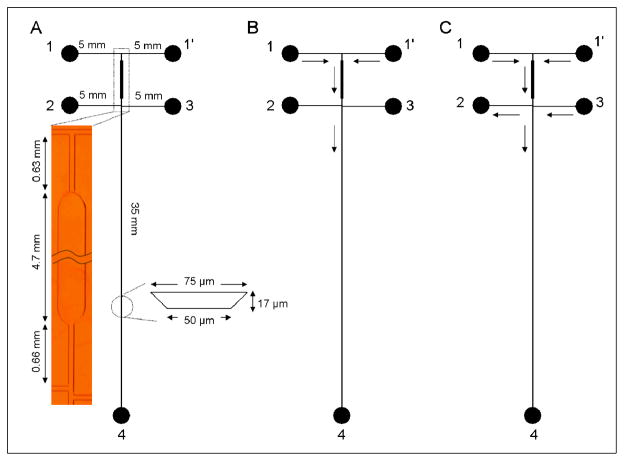
PMMA microchips were fabricated using protocols reported previously [24, 25], including photolithography, hot embossing, and thermal bonding. Schematic diagrams of the microchip layouts for off- and on-chip labeling are shown in Figures 1 and 2, respectively. For on-chip labeling, a wide (300 μm) reaction channel was designed to extend the labeling time of reagents prior to separation [5]. The buffer used, unless otherwise indicated, was 10 mM sodium bicarbonate (pH unadjusted) containing 1 mM CTAB. Prior to use, the microchip channels were filled with running buffer. Dynamic coating with CTAB surfactant was used to decrease nonspecific adsorption of protein and dye to the channel walls [26–28].
Figure 1.
(A) Schematic of microchip layout for off-chip labeling showing channel lengths, channel cross-sectional dimensions, and reservoir numbers. Reservoirs 1–4 are analyte inlet, analyte waste, buffer inlet, and waste, respectively. (B) Schematic of flow during injection. Reservoir 1 was grounded, reservoirs 2 and 3 were floated, and reservoir 4 was maintained at +1600 V. The solution flow directions are indicated by arrows. (C) Schematic of flow in separation mode. Reservoirs 1 and 3 were grounded, reservoir 2 was at +400 V, and reservoir 4 was at +1600 V. The solution flow directions are indicated by arrows.
Figure 2.
(A) Schematic of microchip layout for on-chip labeling showing channel lengths, channel cross-sectional dimensions, and reservoir numbers. (Inset) Photomicrograph of the reaction channel. The reaction chamber is 300 μm wide on the bottom. Reservoirs 1 and 1′ are dye inlet and analyte inlet, respectively. Reservoirs 2–4 are waste, buffer inlet, and waste, respectively. (B) Schematic of flow during injection. Reservoirs 1 and 1′ were grounded, reservoirs 2 and 3 were floated, and reservoir 4 was maintained at +1600 V. The solution flow directions are indicated by arrows. (C) Schematic of flow in separation mode. Reservoirs 1, 1′ and 3 were grounded, reservoir 2 was at +700 V, and reservoir 4 was at +1600 V. The solution flow directions are indicated by arrows.
A “gated” injection scheme [29] was used, and the reservoir content for off- and on-chip labeling is indicated in the Figure 1 and 2 legends. The voltage configuration and flow direction during injection are shown in Figures 1B and 2B. Similarly, the voltage arrangement and microchannel flow paths during separation are illustrated in Figures 1C and 2C.
2.3 Apparatus
A LIF detection system coupled with an inverted optical microscope was used, as reported previously [25]. The 488 nm excitation light was generated by an air-cooled Ar ion laser and directed to a 20×, 0.45 NA objective. Collected fluorescence went through a D600/60 band-pass filter (Chroma, Rockingham, VT) and was detected at a Hamamatsu photomultiplier tube (HC120-05, Bridgewater, NJ); out-of-focus light was blocked by a 1000-μm-diameter pinhole. The photomultiplier voltage signal was processed by a preamplifier (SR-560, Stanford Research Systems, Sunnyvale, CA) and an analog-to-digital converter (PCI 6035E, National Instruments, Austin, TX), and was recorded by LabView software running on a Dell computer.
Microchip devices were affixed to a holder above the objective in the inverted microscope. Platinum wires were inserted into the solution-filled reservoirs to provide electrical contact. Two high-voltage power supplies controlled sample loading and electrophoresis. A custom-designed voltage switching box for “gated” injection was controlled by LabView and applied potentials to the microchips. The default configuration was separation mode (Figures 1C and 2C), and injection times from 0.1 to 10.0 s could be programmed. In this paper, injection times of 0.8 and 1.0 s were used. In detecting separations, the laser beam was focused within the separation channel ~5 mm before reservoir 4 (see Figures 1A and 2A). Fluorescence micrographs of the injection region were captured by a Nikon D 90 (Tokyo, Japan) digital camera. To increase the illuminated area for these images, the expanded laser beam was directed into a 5× objective. Absorption spectra were obtained from a spectrophotometer (ND-1000, NanoDrop Technologies, Wilmington, DE). Emission spectra were obtained from a fluorometer (QuantaMaster UV VIS QM-4, Photon Technology International, Birmingham, NJ).
2.4 Off-chip labeling
A stock solution of CE dye 503 was prepared by adding 635 μL of DMSO into a newly opened container having 0.5 g dye powder, and was stored at 4 °C. For samples containing only BSA, dye stock solution (0.5 μL) was added to 100 μL of 0–100 ng/mL BSA solutions in buffer. After incubation for 20 min at room temperature, 20 μL of the mixture was delivered into reservoir 1 of the microchip (see Figure 1A), while the other reservoirs were filled with buffer. Next, the device was run in separation mode (Figure 1C) for 10 min (30 min total reaction time), and then microchip CE runs were performed. For the protein mixture, 1 μL of dye stock solution was added to 100 μL of solution containing 100 ng/mL BSA and 100 ng/ml CYC in buffer. After the labeling reaction had proceeded for 20 min, the solution was delivered into reservoir 1, and the device was run in separation mode (Figure 1C) for 4 min (24 min total reaction time) before gated injections were performed.
2.5 On-chip labeling
To label single-component protein samples, a diluted dye solution was made by mixing 1 μL of dye stock solution with 50 μL of buffer immediately prior to use. While a microchip was configured in separation mode as shown in Figure 2C, reservoir 1 was emptied of the running buffer with a micropipette, rinsed, and filled with 20 μL of the diluted dye solution (this process typically took about 40 s). After running for 3 min, reservoir 1′ was similarly emptied, rinsed, and filled with 20 μL of the unlabeled protein solution in buffer. After both reservoirs 1 and 1′ were filled with reagents, the microchip was maintained in separation mode for another 2 min, and then microchip CE was performed.
To label protein mixtures, a diluted dye solution was made by mixing 3 μL of dye stock solution with 50 μL of buffer immediately prior to use. Reservoirs 1 and 1′ were filled with dye and protein solution, respectively, as described above, and then the device was maintained in separation mode for another 40 s, after which microchip CE was performed. Between samples, the microchip was held in separation mode, and all reservoirs were rinsed with buffer at least three times before fresh solution was put in. The concentration series for on-chip labeling of BSA was all done on the same microchip, analyzing in order of low to high BSA concentration.
3 Results and discussion
3.1 Injection characterization
Fluorescence micrographs of microchip channels during a 1.0 s injection are shown in Figure 3. The device started in separation mode (Figure 1C), was switched to injection mode (Figure 1B) for 1.0 s, and then was returned to separation mode. The loading volume for the 1.0 s injection was estimated to be ~750 pL.
Figure 3.

Fluorescence micrographs of microchip channels during a 1.0 s gated injection. Reservoir 1 was filled with high concentration (mM) fluorescein solution, and the other reservoirs were filled with buffer. The loading volume during the 1.0 s injection was estimated to be ~750 pL, by calculating the volume of a rectangular block 930 μm long, 62 μm wide, and 13 μm high. The scale bar in the 0.0 s frame applies to all images.
3.2 Off-chip labeling
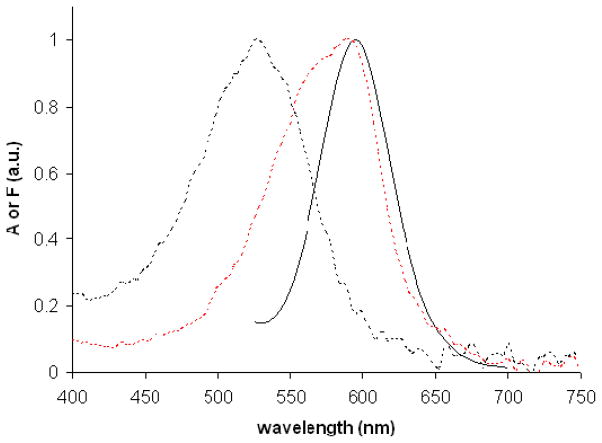
The absorption and emission spectra of free CE dye 503 and labeled BSA are shown in Figure 4. The free dye had an absorbance maximum at ~590 nm and emitted weakly with a maximum at 600 nm for a 488 nm excitation wavelength (data not shown). After the labeling reaction, the absorbance maximum shifted to 525 nm, the fluorescence signal for 488 nm excitation increased, and the emission maximum was ~595 nm.
Figure 4.
Normalized absorption spectra of free CE dye 503 (red dashed line) and CE dye 503 labeled BSA (black dashed line), and normalized emission spectrum of CE dye 503 labeled BSA excited at 488 nm (black solid line).
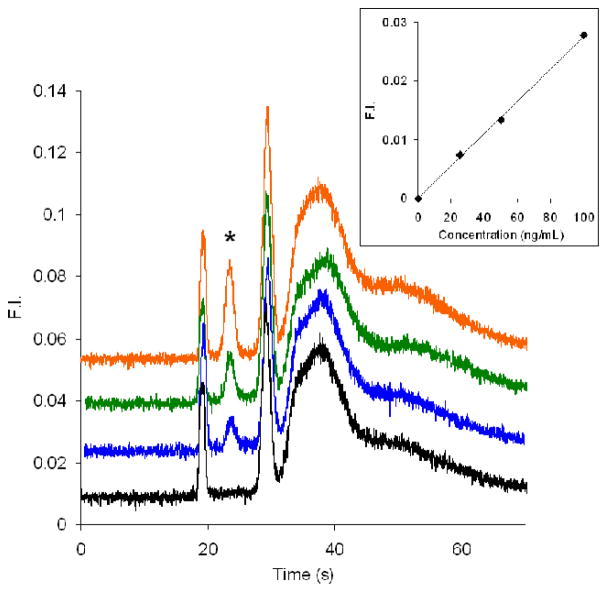
Figure 5 shows electropherograms of different concentrations of CE dye 503 labeled BSA in a PMMA microchip. Based on the inset plot of BSA concentration versus peak height, the concentration detection limit was calculated to be 9 ng/mL, which is comparable to previous work [21]. Our results, however, have a much clearer elution pattern, and the separation is fast, with the BSA peak eluting around 23 s. Similar results were obtained on different devices over a one month timescale. Moreover, the labeling time was decreased from 60 min [21] to 30 min, and a heating step was not needed.
Figure 5.
Microchip electropherograms of BSA labeled off-chip with CE dye 503. From bottom to top (offset traces) are 0 (black), 25 (blue), 50 (green), and 100 ng/mL (orange) BSA. The gated injection time was 1.0 s. The BSA peak is denoted with an asterisk. The inset is a plot of BSA concentration vs. peak height. The detection limit (3σ) was calculated to be 9 ng/mL. Standard deviations of the slope and intercept of the linear least squares fit are 7.0×10⁻⁶ and 4.0×10⁻⁴, respectively.
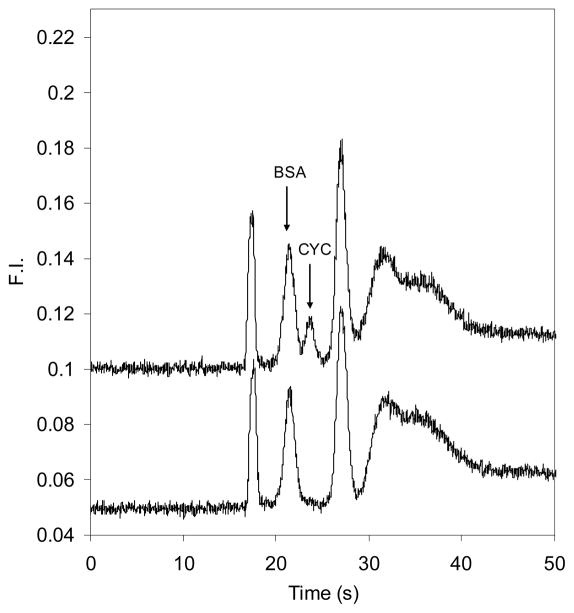
In Figure 6, electropherograms of CE dye 503 labeled BSA, and a mixture of 100 ng/mL BSA and CYC are shown. The labeled BSA and CYC peaks are well resolved. Although BSA and CYC had the same solution concentration, their peak heights differed somewhat. We attribute this difference to two possible factors. First, gated injection biases the loading of faster migrating components (BSA) versus slower ones (CYC). Secondly, CYC may have fewer available lysine amine groups than BSA to react with the fluorescent label.
Figure 6.
Microchip electropherograms of proteins labeled off-chip with CE dye 503. The lower trace is 100 ng/mL BSA and the upper (offset) trace is a mixture of 100 ng/mL BSA and 100 ng/mL CYC. The sample injection time was 0.8 s.
Our off-chip labeling protocol was very simple and relatively fast. BSA concentrations in the ng/mL range were detectable, corresponding to a ~7 fg (100 zmol) mass detection limit, which compares favorably to recent work by Dovichi’s group [15]. The cationic surfactant CTAB worked as a dynamic coating [26–28], and was the only buffer additive found to decrease nonspecific adsorption of dye and protein to the channel walls. Dynamic coating eliminates the need for complex or time-consuming covalent microchip surface modification [30]. Since the free dye emits weakly [20], we suggest that complexes involving the fluorophore and CTAB surfactant in the running buffer are responsible for the peaks and broad shoulder in the protein-free blank in Figure 5. Strong background fluorescence from chameleon labels was also observed previously [31] with the anionic surfactant sodium dodecyl sulfate (SDS).
We also tried SDS as a dynamic microchip coating, but strong adsorption of free dye on the channel walls was observed. SDS coats the PMMA channel walls, making them negatively charged [26, 27], and since CE dye 503 is positively charged [20], electrostatic interaction between the column walls and dye is likely. In contrast, the cationic surfactant CTAB makes the channel walls positively charged [26, 27], which should repel CE dye 503, as well as dye-labeled CTAB-protein complexes. Thus, CTAB was more effective than SDS in surface passivation in our experiments.
To optimize the labeling conditions, we performed separations with varying incubation times and amounts of CTAB or dye. The incubation time for the labeling reaction was critical. Under our conditions, the first CTAB peak eluted more slowly as the incubation time increased, such that over-incubation resulted in poor separation between the first CTAB peak and the BSA peak. The amount of CTAB also affected separation. When 0.2 mM CTAB was used in the buffer, only the first CTAB peak was present, and the second CTAB peak and the broad shoulder disappeared from the electropherogram. However, the resolution between the first CTAB peak and the BSA peak decreased. Finally, the amount of dye was important too. As the dye to protein ratio increased, the peak height of labeled BSA decreased, as has been reported previously [20].
3.3 On-chip labeling
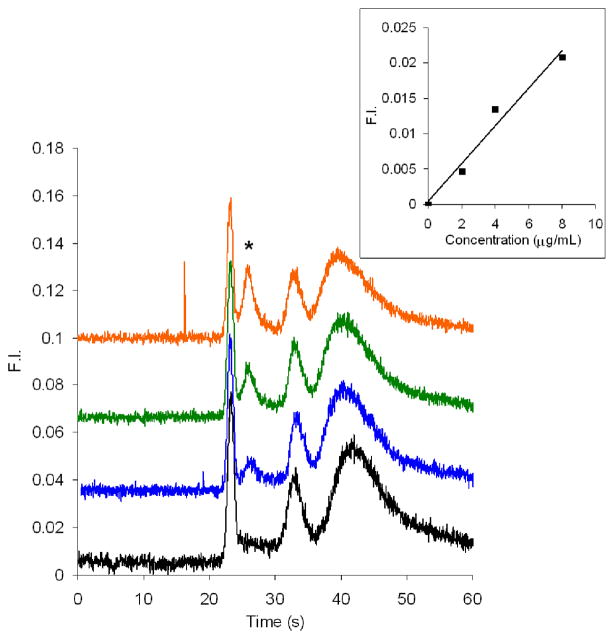
For on-chip labeling, the step of pre-incubation is eliminated, quickening the process and facilitating automation of miniaturized analytical methods. Reaction occurs as diluted dye and protein travel from reservoirs 1 and 1′ through the wider reaction channel (see Figure 2). Figure 7 shows microchip electropherograms of CE dye 503 tagged BSA at several concentrations using our on-chip labeling protocol. In the blank (black trace), several peaks from the CTAB-dye fluorescent conjugates appeared as in Figure 5. In the other separations a clear BSA peak was visible at ~26 s; the height of this peak was linearly proportional to the BSA concentration (see Figure 7 inset). Based on the plot of BSA concentration versus peak height, the detection limit for BSA was calculated to be 1 μg/mL. Our detected 2 μg/mL BSA concentration (blue trace) is more than 10 times lower than the concentration previously reported for on-column labeling with a similar “chameleon” dye in conventional CE [21].
Figure 7.
Microchip electropherograms (offset vertically) of BSA labeled on-chip with CE dye 503. From bottom to top are 0 (black), 2 (blue), 4 (green), and 8 (orange) μg/mL BSA. The gated injection time was 1.0 s, and the BSA peak is denoted with an asterisk. The inset is a plot of BSA concentration vs. peak height. The detection limit (3σ) was calculated to be 1 μg/mL. Standard deviations of the slope and intercept of the linear least squares fit are 3.3×10⁻⁴ and 1.5×10⁻³, respectively.
The BSA peaks in Figure 7 were slightly closer to the first background peak than those in Figure 5, and the system peaks also had a somewhat different appearance. Our hypothesis is that the incubation process accounts for the subtle difference between off- and on-chip labeling. In off-chip labeling, the reaction happens on a longer time scale, allowing each protein molecule to react with some number of dye molecules during the allotted time. Thus, most of the protein molecules reach a similar degree of labeling by the end of incubation, which results in the well-separated BSA peaks in Figure 5. In contrast, on-column labeling happens in a dynamic manner while reagents traverse the reaction channel. Individual protein molecules were exposed to, and subsequently reacted with, a varying number of dye molecules while both reagents had their brief transit through the reaction chamber.
Is this difference in the number of labels on BSA sufficient to influence the elution time or mobility? BSA contains 60 lysine residues [32]. Prior to reaction with CE dye 503 on-chip, the BSA had interacted with CTAB in the buffer, forming BSA-CTAB complexes. The surfactant alters the native conformation [33], making many of the primary amines on lysine residues exposed and accessible. A single dye label should cause a mass shift of just under 300 Da [14], but the effects of several tens of dye labels on molecular weight and affinity for CTAB could be enough to influence the mobility and hence elution time of BSA. We feel that these factors cause the BSA peaks in the on-chip labeling process to elute faster than the off-chip-labeled peaks. As with off-chip labeling experiments, we found that when devices were exposed to the dye for longer times, the resolution between the first background peak and the BSA peak decreased.
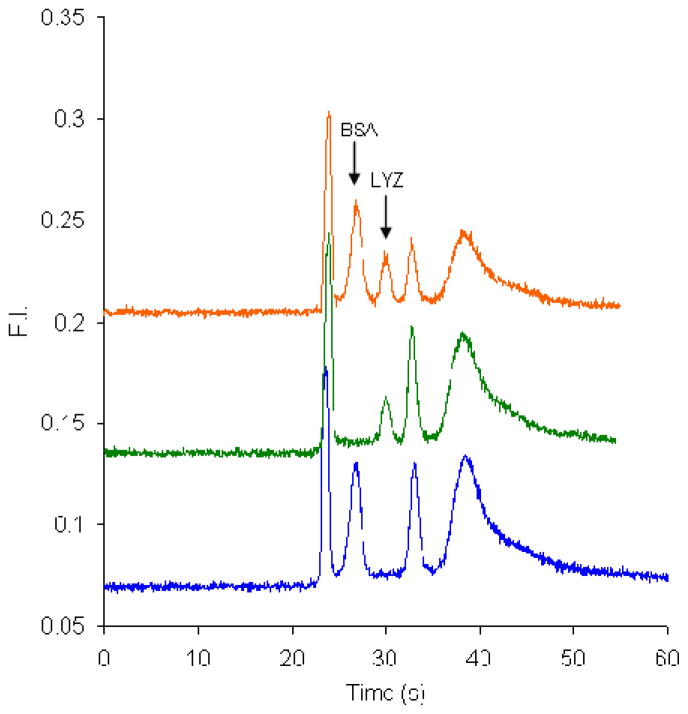
Figure 8 shows electropherograms of 30 μg/mL LYZ, 8 μg/mL BSA, and a mixture of these two proteins labeled on-chip with CE dye 503. The two protein peaks are baseline resolved in the mixture separation. We note that the LYZ peak is smaller than the BSA peak even though its concentration is greater than that of BSA. The same factors of mobility bias in gated injection and different numbers of accessible lysine residues that were noted in Section 3.2 for off-chip labeling also influence the relative peak heights for on-chip labeling. Furthermore, when equal concentrations (500 ng/mL) of BSA and LYZ are labeled off-chip, the peak height of LYZ is about half that of the BSA peak (data not shown), indicating that in on-chip labeling LYZ is under-labeled compared with off-chip tagging. Finally, although we have been successful in applying our approach to the separation of BSA, CYC and LYZ, we note that other analytes could have migration times that overlap with these peak or the system peaks, such that their quantitation would be more challenging.
Figure 8.
Microchip electropherograms (offset vertically) of proteins labeled on-chip with CE dye 503. From bottom to top are 8 μg/mL BSA (blue), 30 μg/ml LYZ (green), and a mixture of 8 μg/mL and 30 μg/mL LYZ (orange). The gated injection time was 0.8 s.
4 Concluding remarks
Here, we developed a protocol for PMMA microdevices to analyze “chameleon” dye labeled proteins in both off- and on-chip labeling scenarios. CTAB worked as a dynamic coating to prevent nonspecific adsorption of protein and dye to the channel walls. In off-chip labeling, a 9 ng/mL concentration detection limit for BSA, corresponding to a ~7 fg (100 zmol) mass detection limit, was obtained. In on-chip labeling, the free dye and proteins were loaded in different reservoirs on the microdevice. This approach had a 1 μg/mL concentration detection limit for BSA, corresponding to a ~700 fg (10 amol) mass detection limit. The BSA peaks were shifted to a shorter elution time in on-chip labeling because of fewer total dyes on each protein molecule. Importantly, we have demonstrated that both off- and on-chip labeling can be used in separating protein mixtures in these polymer microdevices. Our methods eliminate time-consuming microchip pre-treatments, inconvenient heating steps, and the need for long reaction incubation times. Finally, instead of multiple manually controlled inputs [21], our on-column labeling is performed in a relatively continuous and integrated manner, an important aspect of automating miniaturized devices, further demonstrating the promise of our approach.
Acknowledgments
This work was supported by a Presidential Early Career Award for Scientists and Engineers (PECASE) through the National Institutes of Health (R01 EB006124). Microfabrication of the Si templates was performed in the Integrated Microelectronics Laboratory at Brigham Young University. We are grateful to Dr. Daniel Eves and Elisabeth Pound for proofreading assistance, to Yun Li for discussions, and to Prof. Milton Lee for providing access to equipment and reagents.
References
- 1.Fiorini GS, Chiu DT. Biotechniques. 2005;38:429–446. doi: 10.2144/05383RV02. [DOI] [PubMed] [Google Scholar]
- 2.Nagata H, Tabuchi M, Hirano K, Baba Y. Electrophoresis. 2005;26:2687–2691. doi: 10.1002/elps.200410337. [DOI] [PubMed] [Google Scholar]
- 3.Woolley AT, Mathies RA. Proc Natl Acad Sci USA. 1994;91:11348–11352. doi: 10.1073/pnas.91.24.11348. [DOI] [PMC free article] [PubMed] [Google Scholar]
- 4.Vilkner T, Janasek D, Manz A. Anal Chem. 2004;76:3373–3385. doi: 10.1021/ac040063q. [DOI] [PubMed] [Google Scholar]
- 5.Jacobson SC, Hergenroder R, Moore AW, Jr, Ramsey JM. Anal Chem. 1994;66:4127–4132. [Google Scholar]
- 6.Yassine O, Morin P, Dispagne O, Renaud L, Denoroy L, Kleimann P, Faure K, Rocca JL, Ouaini N, Ferrigno R. Anal Chim Acta. 2008;609:215–222. doi: 10.1016/j.aca.2007.12.045. [DOI] [PubMed] [Google Scholar]
- 7.Jacobson SC, Koutny LB, Hergenroder R, Moore AW, Jr, Ramsey JM. Anal Chem. 1994;66:3472–3476. [Google Scholar]
- 8.Abdelgawad M, Watson MWL, Wheeler AR. Lab Chip. 2009;9:1046–1051. doi: 10.1039/b820682a. [DOI] [PubMed] [Google Scholar]
- 9.Martynova L, Locascio LE, Gaitan M, Kramer GW, Christensen RG, MacCrehan WA. Anal Chem. 1997;69:4783–4789. doi: 10.1021/ac970558y. [DOI] [PubMed] [Google Scholar]
- 10.Duffy DC, McDonald JC, Schueller OJA, Whitesides GM. Anal Chem. 1998;70:4974–4984. doi: 10.1021/ac980656z. [DOI] [PubMed] [Google Scholar]
- 11.Osiri JK, Shadpour H, Park S, Snowden BC, Chen ZY, Soper SA. Electrophoresis. 2008;29:4984–4992. doi: 10.1002/elps.200800496. [DOI] [PubMed] [Google Scholar]
- 12.Fuentes HV, Woolley AT. Anal Chem. 2008;80:333–339. doi: 10.1021/ac7017475. [DOI] [PMC free article] [PubMed] [Google Scholar]
- 13.Marchiarullo DJ, Lim JY, Vaksman Z, Ferrance JP, Putcha L, Landers JP. J Chromatogr A. 2008;1200:198–203. doi: 10.1016/j.chroma.2008.05.031. [DOI] [PubMed] [Google Scholar]
- 14.Meier RJ, Steiner MS, Duerkop A, Wolfbeis OS. Anal Chem. 2008;80:6274–6279. doi: 10.1021/ac800581v. [DOI] [PubMed] [Google Scholar]
- 15.Ramsay LM, Dickerson JA, Dada O, Dovichi NJ. Anal Chem. 2009;81:1741–1746. doi: 10.1021/ac8025948. [DOI] [PMC free article] [PubMed] [Google Scholar]
- 16.Lee TT, Yeung ES. Anal Chem. 1992;64:3045–3051. doi: 10.1021/ac00047a029. [DOI] [PubMed] [Google Scholar]
- 17.Pinto D, Arriaga EA, Schoenherr RM, Chou SSH, Dovichi NJ. J Chromatogr B. 2003;793:107–114. doi: 10.1016/s1570-0232(03)00368-4. [DOI] [PubMed] [Google Scholar]
- 18.Stoyanov AV, Ahmadzadeh H, Krylov SN. J Chromatogr B. 2002;780:283–287. doi: 10.1016/s1570-0232(02)00535-4. [DOI] [PubMed] [Google Scholar]
- 19.Gottschlich N, Culbertson CT, McKnight TE, Jacobson SC, Ramsey JM. J Chromatogr B. 2000;745:243–249. doi: 10.1016/s0378-4347(00)00287-5. [DOI] [PubMed] [Google Scholar]
- 20.Hoefelschweiger BK, Duerkop A, Wolfbeis OS. Anal Biochem. 2005;344:122–129. doi: 10.1016/j.ab.2005.06.030. [DOI] [PubMed] [Google Scholar]
- 21.Craig DB, Wetzl BK, Duerkop A, Wolfbeis OS. Electrophoresis. 2005;26:2208–2213. doi: 10.1002/elps.200410332. [DOI] [PubMed] [Google Scholar]
- 22.Wojcik R, Swearingen KE, Dickerson JA, Turner EH, Ramsay LM, Dovichi NJ. J Chromatogr A. 2008;1194:243–248. doi: 10.1016/j.chroma.2008.04.042. [DOI] [PMC free article] [PubMed] [Google Scholar]
- 23.Ramsay LM, Dickerson JA, Dovichi NJ. Electrophoresis. 2009;30:297–302. doi: 10.1002/elps.200800498. [DOI] [PubMed] [Google Scholar]
- 24.Kelly RT, Pan T, Woolley AT. Anal Chem. 2005;77:3536–3541. doi: 10.1021/ac0501083. [DOI] [PubMed] [Google Scholar]
- 25.Kelly RT, Woolley AT. Anal Chem. 2003;75:1941–1945. doi: 10.1021/ac0262964. [DOI] [PubMed] [Google Scholar]
- 26.Badal MY, Wong M, Chiem N, Salimi-Moosavi H, Harrison DJ. J Chromatogr A. 2002;947:277–286. doi: 10.1016/s0021-9673(01)01601-6. [DOI] [PubMed] [Google Scholar]
- 27.Mersal GAM, Bilitewski U. Microchim Acta. 2005;151:29–38. [Google Scholar]
- 28.Righetti PG, Gelfi C, Verzola B, Castelletti L. Electrophoresis. 2001;22:603–611. doi: 10.1002/1522-2683(200102)22:4<603::AID-ELPS603>3.0.CO;2-N. [DOI] [PubMed] [Google Scholar]
- 29.Ermakov SV, Jacobson SC, Ramsey JM. Anal Chem. 2000;72:3512–3517. doi: 10.1021/ac991474n. [DOI] [PubMed] [Google Scholar]
- 30.Liu J, Lee ML. Electrophoresis. 2006;27:3533–3546. doi: 10.1002/elps.200600082. [DOI] [PubMed] [Google Scholar]
- 31.Swearingen KE, Dickerson JA, Turner EH, Ramsay LM, Wojcik R, Dovichi NJ. J Chromatogr A. 2008;1194:249–252. doi: 10.1016/j.chroma.2008.04.047. [DOI] [PMC free article] [PubMed] [Google Scholar]
- 32.Huang BX, Kim HY, Dass C. J Am Soc Mass Spectrom. 2004;15:1237–1247. doi: 10.1016/j.jasms.2004.05.004. [DOI] [PubMed] [Google Scholar]
- 33.Madaeni SS, Rostami E. Chem Eng Technol. 2008;31:1265–1271. [Google Scholar]


