

Abstract
Protein–DNA interactions are essential for fundamental cellular processes such as transcription, DNA damage repair, and apoptosis. As such, small molecule disruptors of these interactions could be powerful tools for investigation of these biological processes, and such compounds would have great potential as therapeutics. Unfortunately, there are few methods available for the rapid identification of compounds that disrupt protein–DNA interactions. Here we show that photonic crystal (PC) technology can be utilized to detect protein–DNA interactions, and can be used in a high-throughput screening mode to identify compounds that prevent protein–DNA binding. The PC technology is used to detect binding between protein–DNA interactions that are DNA-sequence-dependent (the bacterial toxin–antitoxin system MazEF) and those that are DNA-sequence-independent (the human apoptosis inducing factor (AIF)). The PC technology was further utilized in a screen for inhibitors of the AIF–DNA interaction, and through this screen aurin tricarboxylic acid was identified as the first in vitro inhibitor of AIF. The generality and simplicity of the photonic crystal method should enable this technology to find broad utility for identification of compounds that inhibit protein–DNA binding.
High-throughput screening (HTS) of compound collections is now a staple of modern drug discovery. In the most common incarnation, in vitro enzyme inhibition screens of large (>100,000 members) compound libraries are conducted using substrates that provide an easily quantified chromogenic/ fluorescent readout. Such screens have led to the discovery of many novel enzyme inhibitors and drug leads (1, 2). Unfortunately, many potential drug targets are not enzymes, and thus for these systems high-throughput methods are needed that go beyond enzyme inhibition assays and directly report on small molecule–protein binding events.
One area in which small molecule ligands for nonenzyme proteins would be useful is in the disruption of protein–macromolecule interactions. The identification of compounds that perturb protein–protein or protein–nucleic acid interactions is extremely challenging (3–6), and this is partly due to the paucity of good high-throughput screens. Successes in modulating protein–protein and protein–nucleic acid interactions with small molecules fall into a few classes: surface receptor–ligand interactions (integrins (7–9), IL-1/2 (10, 11), TNFα (12)), cytoplasmic targets (iNOS (13), HIV protease (14), Bcl-2/xL (15), XIAP (16)), and transcription-related targets (17). This last class of compounds can elicit their action by inhibiting transcription factor dimerization/DNA-binding (B-ZIP (18), Zn-finger proteins (19), STAT3 (20, 21), c-Myc/Max (22, 23), HIF-1 (24), GLI (25)), by relieving inhibitory proteins (p53/ MDM2 (26)), or by recruiting transcription factors or co-activators to certain DNA sequences by using polyamides (27, 28) or small molecules (29–31). In order to further facilitate the identification of inhibitors of protein–nucleic acid interactions, we sought to develop a high-throughput screening method that would directly report on the inhibition of protein–nucleic acid complexes.
There are several techniques utilized to measure protein–nucleic acid binding. Current methodologies include DNA microarrays (32), fluorescence anisotropy (33), electrophoretic mobility shift assays (EMSA) (34), DNA/RNA footprinting (35, 36), chromatin immunoprecipitation (ChIP) (37), isothermal titration calorimetry (ITC) (38), and surface plasmon resonance (SPR) (38, 39); each is able to measure the degree and/or specificity of protein–DNA/RNA binding. While the aforementioned techniques are useful in determining binding affinities, few are optimal for HTS and drug discovery. DNA microarrays and emerging SPR microscopy techniques may ultimately be suitable for HTS, and the technology reported herein may be viewed as complementary to these assays. However, DNA microarray and SPR microscopy based screening has generally been applied to the identification of optimal promoter binding sites for transcription factors (33, 40–42) and not in drug discovery. Fluorescence anisotropy (also termed fluorescence polarization, or FP) has been widely used for the measurement of protein–protein and protein–nucleic acid interactions (33), as well as the screening of compound libraries for inhibitors of these interactions (43–45). Although fluorescence anisotropy is a popular method for such experiments, there are some limitations on fluorescence anisotropy as a HTS method. One limitation is the recommended >10-fold mass excess of the nonfluorescent binding partner (46), although there are examples showing that fluorescence anisotropy can be effective below this limit (47). Another limitation is the potential for false positives due to fluorescent compounds, which is an inherent limitation of any fluorescence-based HTS method. Given the largely unexplored pharmacological realm that is protein–nucleic acid interactions, HTS assays independent of fluorescent tags would be extremely useful, especially in those cases where fluorescence anisotropy is not possible. In this report we describe the first use of photonic crystal technology for the development of an assay capable of detecting protein–DNA binding and further apply it in a high-throughput screening mode for discovery of inhibitors of a protein–DNA interaction.
Results and Discussion
As stated above, fluorescence polarization has been successfully utilized in multiple high-throughput screens, including some whose goal was the identification of inhibitors of protein–DNA interactions (18, 23). Thus, in our search for inhibitors of the apoptosis inducing factor (AIF)–DNA interaction, we initially attempted to develop an FP-based HTS. Unfortunately, DNA sequences with two different fluorescent tags did not give a noticeable change in fluorescence polarization upon incubation with AIF (see Supplementary Figure 1). We ascribed the failure of the FP method in this case to the low affinity of AIF for any DNA sequence, as demonstrated by the molar ratios required in EMSA (48, 49). In addition, the FP assay with AIF is complicated by the fact that AIF itself is fluorescent due to the presence of its flavin cofactor. We thus sought to develop a general and high-throughput technique for the identification of inhibitors of protein–DNA interactions that would be able to avoid these complications.
A new class of disposable microplate-based optical biosensors based on the unique properties of photonic crystals (PC) have been recently developed by Cunningham et al. (50). Like other optical biosensors, including those utilized in SPR, PC biosensors detect biomolecular interactions on the surface of a transducer through changes in dielectric permittivity with respect to the liquid media. A PC is composed of a periodic arrangement of dielectric material that effectively prevents propagation of light at specific wavelengths and directions. When illuminated with white light, appropriately configured photonic crystals are able to reflect narrow band light whose wavelength is directly dependent on the local density of adsorbed biomolecules (Figure 1). Association of macromolecules to the sensor surface modulates the peak wavelength value (PWV) of the reflected light, allowing for detection of binding by a shift in the PWV. Photonic crystal biosensors incorporated onto standard format 96-, 384-, or 1536-well microplates have been used to detect antibody–antigen, small molecule–protein, and whole cell interactions on the biosensor surface without the use of fluorescent labels (50). In the work described herein, photonic crystal technology is applied to the detection and analysis of protein–DNA interactions. To demonstrate the scope of this method, we chose two very different protein–DNA interactions: the bacterial MazEF complex, which binds to its promoter DNA in a sequence-specific manner, and the human AIF, a protein that binds nonspecifically to chromosomal DNA.
Figure 1.
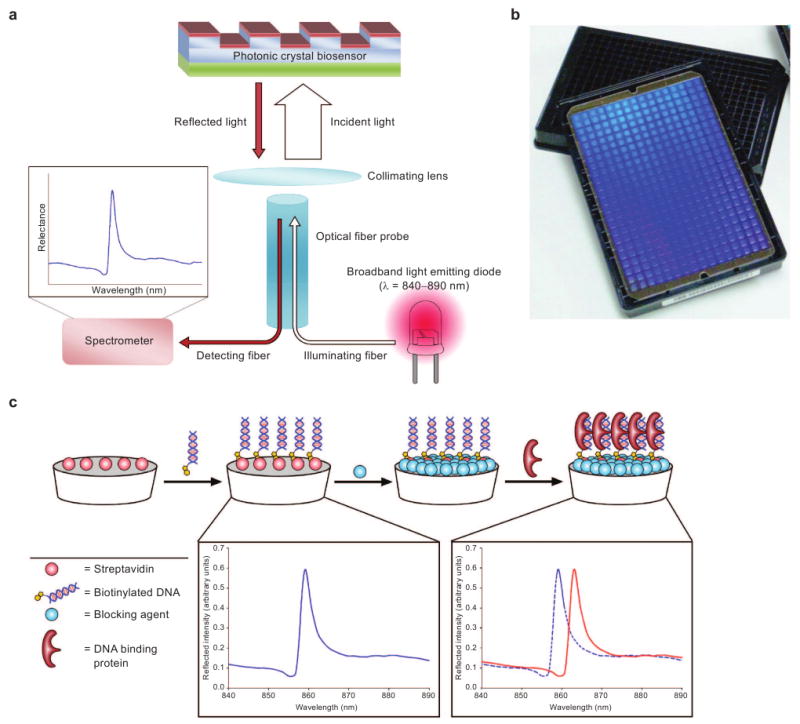
a) Schematic of the PC biosensor. A broadband LED illuminates the biosensor from the bottom, and reflected light is collected and transferred to a spectrometer where the PWV is measured. b) Image of PC biosensor films adhered to the bottom of black 384-well plates. c) Diagram of protein–DNA binding experiments performed with PC biosensors. Streptavidin-coated biosensors are used to bind biotinylated DNA oligomers, and a distinct peak wavelength of the reflected light is observed. After the addition of Starting Block (Pierce Biotechnologies), a DNA-binding protein is added, and a shift in the wavelength of reflected light is observed.
MazEF is a bacterial toxin–antitoxin system thought to be responsible for the maintenance of resistance-encoding plasmids in certain infectious bacteria (51–53). Originally identified on the E. coli chromosome, MazEF is a heterohexameric, ∼77 kDa complex consisting of 1 MazE (antitoxin) dimer, and two MazF (toxin) dimers (54). MazF is an RNase which is released from MazE upon plasmid loss, resulting in inhibition of bacterial growth (55). In addition to its toxic action, the MazEF complex also regulates its expression by binding to its own promoter sequence (55).
AIF is a mammalian mitochondrial NADH-oxidoreductase that also has a key role in caspase-independent cell death (56, 57). The 67 kDa form of AIF is produced in the cytoplasm, where it then translocates to the mitochondria and carries out its oxidoreductase function as well as possible upkeep of complex I (58). Upon cellular insults (such as DNA damage), AIF is cleaved off the inner mitochondrial membrane and released into the cytoplasm as a 57 kDa protein. Once in the cytoplasm, AIF translocates to the nucleus and binds to DNA in a sequence-independent fashion, causing stage I chromatin condensation, eventually leading to cell death. AIF is thought to contact DNA through electrostatic interactions, as mutations of surface lysine and arginine residues abrogate DNA binding in vitro and in cell culture (49). These surface residues are contained within the FAD-binding domain and the C-terminal domain of AIF, and it is proposed that 12 base pairs of double-stranded DNA (dsDNA) can be bound in this stretch of AIF (49). Although the crystal structure of AIF has been solved (49, 59), no cocrystal structure has been obtained for AIF and DNA. Small molecule inhibitors of the AIF–DNA interaction are of great interest due to the involvement of AIF in multiple disease state models including Parkinson's disease (60), ischemia/reperfusion injury (61), amyotrophic lateral sclerosis (62), and Huntington's disease (63); however, no small molecule inhibitors of the AIF–DNA interaction have been reported.
Sensor Fabrication
The PC optical biosensors used in this work have been described previously (50). Briefly, the sensor contains a one-dimensional surface grating structure with a period of 550 nm (Figure 1, panel a). It is produced via a room-temperature replica molding process using a UV-curable polymer on a transparent polyester sheet. The low refractive index polymer grating structure is subsequently coated with a film of high refractive index TiO2 to achieve the final sensor structure. The completed sensor is cut from the polyester sheet and attached to the bottom of a standard 384-well microplate (Figure 1, panel b). The readout instrument (SRU Biosystems BIND Reader) (50, 64, 65) illuminates microplate wells from below with a broadband light source coupled to eight optical fibers, each illuminating a ∼2 mm diameter region of the PC surface at normal incidence. Reflected light is collected by a second optical fiber, bundled next to the illuminating fiber, and measured by a spectrometer. An automated motion stage enables parallel collection of reflectance data at timed intervals to acquire kinetic information from all 384 wells. In Figure 1, panel c illustrates the general experimental setup of DNA-binding assays performed using PC biosensors.
Sequence-Dependent DNA Binding: MazEF
MazEF was shown previously to bind to its own promoter sequence using an electrophoretic mobility shift assay (EMSA) (55). MazE has some intrinsic DNA binding ability, while formation of the MazEF complex dramatically increases DNA binding (55). For the experiments described herein, the same promoter sequence used by Zhang and co-workers (55) was purchased with one end functionalized with biotin. The sensor surface was coated with 12 μL of 1 μM biotinylated DNA (12 h at 4 °C) and blocked with Starting Block (Pierce Biotechnology) for 2 h at 4 °C. MazEF was expressed and purified as described (76) and then added to DNA-containing wells at the specified concentration (Figure 2, panel a) for 1 h at 25 °C. In Figure 2, panel a shows the association of the MazEF protein complex with biosensors coated with promoter DNA. This association was inhibited by preincubating MazEF with increasing concentrations of free promoter DNA for 15 min (Figure 2, panel b). The binding of MazEF to its promoter sequence was also specific; when a control sequence of GC-rich DNA with one end biotinylated was complexed to the PC biosensor, MazEF exhibited only minimal binding (Figure 2, panel c). The kinetics of MazEF binding to the promoter-bound biosensor were also monitored over the course of 30 min (Figure 2, panel c).
Figure 2.
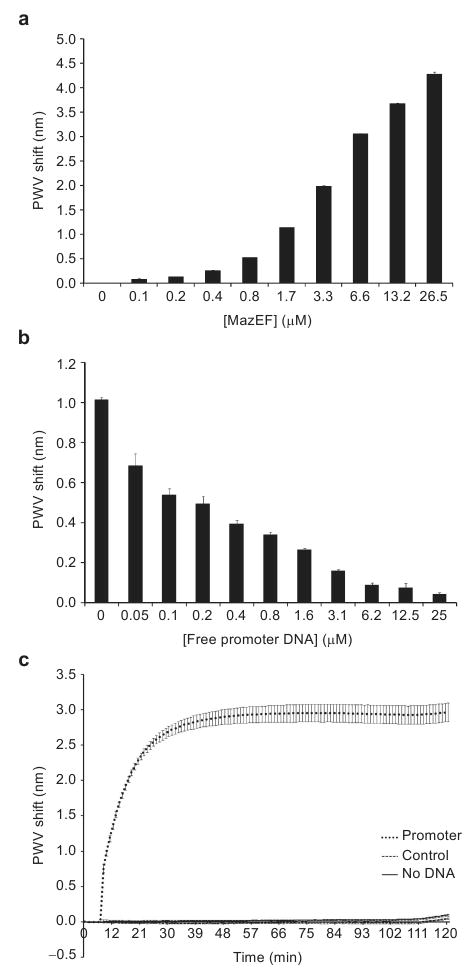
a) MazEF associates with its promoter sequence bound to the PC biosensor surface in a dose-dependent fashion. b) Preincubation of MazEF (1.8 μM) with its nonbiotinylated promoter sequence reduces the association of MazEF with the promoter-bound biosensor surface. c) Kinetics of MazEF (0.2 mg mL-1) binding to its own promoter sequence. A rapid increase in PWV shift is observed upon MazEF addition to the promoter-bound biosensor surface. In contrast, MazEF showed little affinity for a biotinylated alternating GC control DNA of the same length as its promoter sequence, similar to its association blocked sensor surface (no DNA). All error bars represent the calculated standard error (n = 3).
Sequence-Independent DNA Binding: AIF
Analyses of the DNA binding properties of the 57 kDa form of AIF (AIFΔ1-121) have been performed previously using EMSA (48). AIF binds DNA nonspecifically, as different sequences of free oligomer are able to prevent AIF binding to a DNA ladder (48). Therefore, a biotinylated, randomized 30 bp sequence of dsDNA was chosen as the DNA target of AIF; it has been shown that AIF is capable of binding DNA of this length (48). Preparation of the biosensor surface was analogous to the MazEF experiments described above, except the specified concentrations of AIF were incubated with biotinylated DNA for 30 min at 25 °C. As monitored by the PC biosensor, the association of AIF with biotinylated DNA was found to be pH dependent (Figure 3, panel a), and a pH of 6.3 was found to give modest PWV shifts while maintaining protein stability. This pH dependence is not surprising due to the fact that the pI of AIFΔ1-121 is 7.8, and a pH lower than the pI would favor binding to a DNA substrate. In Figure 3, panel b shows the association of AIF with biotinylated DNA; this interaction is also inhibited by a 15 min preincubation with free DNA (Figure 3, panel c). AIF is thought to bind DNA in a cooperative fashion, due to the fact that a large molar excess of AIF is required to detect binding (48). Because MazEF binds to its promoter sequence specifically, and no known cooperative interaction has been postulated, we propose the difference in PWV shift values between MazEF and AIF are because of the difference in the relative affinities of these proteins for their DNA targets.
Figure 3.
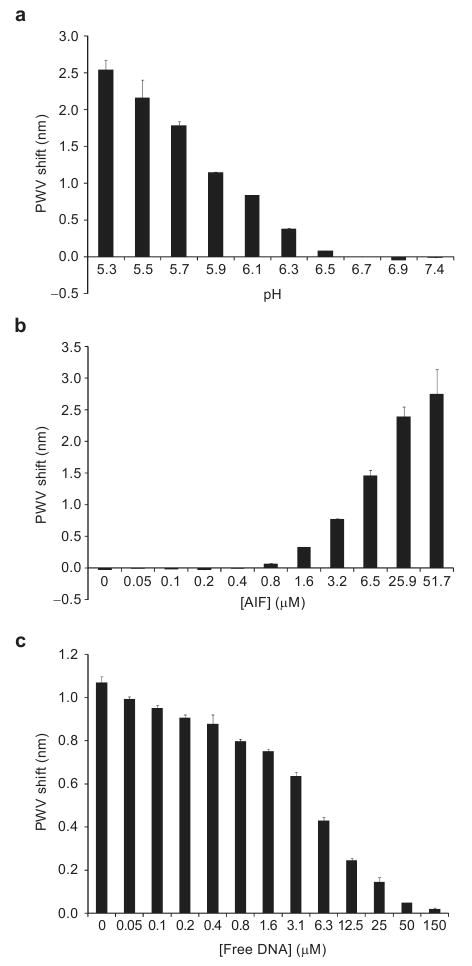
a) AIF associates with a randomized DNA sequence bound to the biosensor surface in a pH dependent fashion. The pH chosen for further assays was 6.3, the pH at which AIF exhibits moderate PWV shifts and is stable over the course of the assay. b) Increasing AIF concentrations (0–51.7 μM) causes a dose-dependent shift increase in the PWV shift. c) Preincubation of AIF (7.02 μM) with a nonbiotinylated randomized DNA sequence inhibits the interaction of AIF with the DNA bound sensor surface. All error bars represent the calculated standard error (n = 3).
Demonstration of HTS Potential: Screening for Inhibitors of the AIF–DNA Interaction
The data in Figures 2 and 3 demonstrate that the PC biosensor can be successfully used to detect protein–DNA interactions. With these experiments in place, we moved to develop a high-throughput screen that could be used to identify compounds that prevent the AIF–DNA interaction. As with previous experiments, a 1 μM solution of biotinylated DNA was immobilized on streptavidin-coated PC biosensors, and Starting Block was then added to reduce nonspecific interactions between AIF and the biosensor surface. AIF (3.51 μM) and putative small molecule inhibitors (25 μM) were incubated together for 15 min at 25 °C in a clear 384-well plate (Falcon); reference wells for each compound were also prepared in the same 384-well plate. These solutions were then transferred to the DNA-containing 384-well biosensor plate. Compounds that inhibit the AIF–DNA interaction would prevent the PWV shift observed in the AIF–DNA binding event. In this fashion, approximately 1000 compounds (obtained from an in-house compound collection (66)) were screened in duplicate at a concentration of 25 μM. All experimental wells were normalized against the following two reference wells: AIF with no biotinylated DNA (to account for the nonspecific interactions of AIF with the streptavidin coated biosensor), and biotinylated DNA with compounds (to account for nonspecific interactions with the DNA or biosensor surface). The quality of the screen was assessed via the Z′-factor (see eq 2 in Methods), a unitless coefficient reflective of the assay's signal dynamic range and data variability. This particular assay attained a median score of 0.65, regarding this as an “excellent” assay (67). Most wells showed very little variation in the PWV shift, implying no prevention of the AIF–DNA interaction (Figure 4, panels a–c). However, one compound in this collection, aurin tricarboxylic acid (ATA, Figure 4, panel d), was found to inhibit the AIF–DNA interaction (Figure 4, panels b and c). In the screen ATA displayed ∼80% inhibition of AIF–DNA binding and was the only compound to exhibit significant inhibition out of the ∼1000 compounds screened. Representative PWV values are shown for a group of compounds not containing ATA (Figure 4, panel a) and the group of compounds that contains ATA (Figure 4, panel b). The PWV shifts were then converted to a percent inhibition of AIF, and these data are graphed for all ∼1000 compounds (Figure 4, panel c). The PC biosensor was then used to assess the effect of a range of concentrations of ATA; this analysis revealed that ATA inhibits AIF–DNA binding with an IC50 of 23 μM (Figure 5, panel a).
Figure 4.
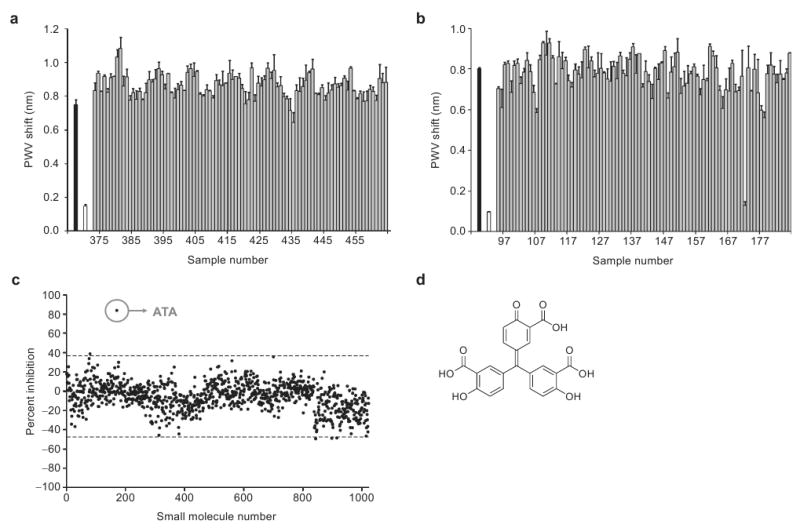
a) A representative group of ∼1000 compounds screened for their ability to inhibit the AIF–DNA interaction. The black bar represents a control in which there is no compound present; that is, only AIF (3.51 μM) and 1% DMSO are incubated with the blocked DNA-bound biosensor. The white bar represents a control in which AIF was preincubated with 6.25 μM of the nonbiotinylated DNA oligomer prior to addition to the DNA-bound biosensor. The gray bars represent all other wells which contain AIF and 25 μM compounds, none of which show inhibition of AIF–DNA binding. All compounds were referenced to control wells for DMSO, AIF, and small molecule nonspecific binding. b) A group of compounds where ATA was present (sample 172). c) Inhibition data for all compounds screened, where ATA is the only compound out of the ∼1000 screened to show significantly higher inhibition (∼80%). Dotted lines above and below the x-axis represent three standard deviations away from the mean. d) The structure of ATA. All error bars represent the calculated standard error (n = 2).
Figure 5.
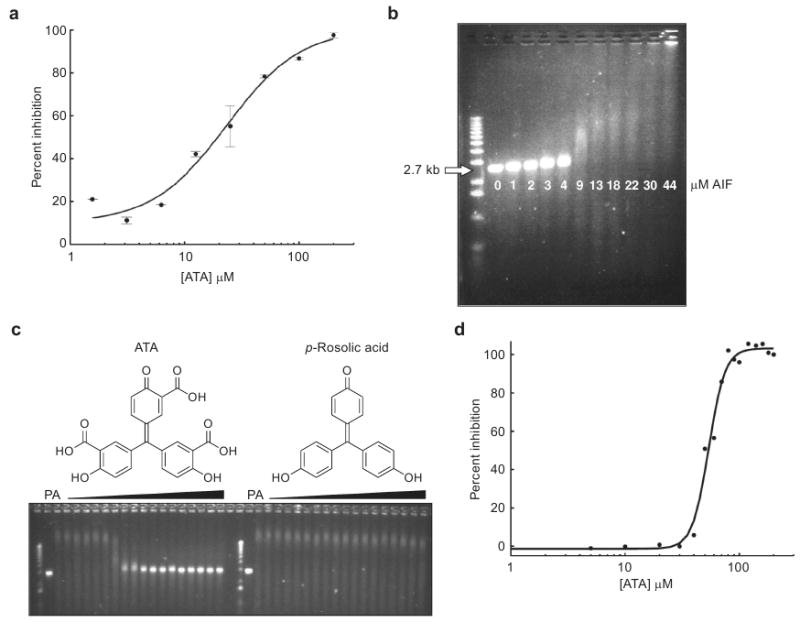
a) Dose–response curve of the inhibition of AIF–DNA binding by ATA as measured by PC biosensor technology. ATA inhibits AIF in this assay with an IC50 of ∼23 μM. b) AIF retards the migration of linearized pUC19 plasmid DNA (2.7 kb) through a 1% agarose gel. The pH dependence is lessened in this assay due to the greater affinity of AIF for larger pieces of DNA (48). c) ATA inhibits AIF in the gel assay while its analogue, p-rosolic acid, does not. “P” represents pUC19 plasmid DNA without any AIF added, while “A” represents pUC19 plasmid DNA incubated with 15 μM AIF. All other wells contain increasing concentrations of ATA or p-rosolic acid (1–200 μM) in addition to pUC19 and AIF. d) Analysis of the ATA–AIF gel in panel c by densitometry reveals that ATA inhibits AIF in this assay with an IC50 of ∼50 μM. Percent inhibition was calculated by using densitometry software (Image J). All error bars represent the calculated standard error (n = 2).
As there are no known small molecule inhibitors of AIF, we sought to confirm the results of the high-throughput PC biosensor screen. Thus, EMSA was used to probe the ability of ATA to inhibit the AIF–DNA interaction. The migration of linearized pUC19 plasmid DNA was retarded by increasing concentrations of AIF (Figure 5, panel b). Holding the concentration of AIF constant and increasing the amount of ATA prevented the association of AIF with the plasmid DNA, as measured by this gel-shift assay (Figure 5, panel c). ATA inhibited AIF–DNA binding with an IC50 of approximately 50 μM in this assay, as determined by densitometry (Figure 5, panel d). A structurally related analogue of ATA, p-rosolic acid, was unable to inhibit AIF–DNA binding in the gel assay (Figure 5, panel c). The binding of ATA to AIF was then confirmed by ITC. ATA was shown to bind to AIF with a Kd = 19 ± 5 μM (Figure 6, panel a), while p-rosolic acid showed little affinity for AIF (Figure 6, panel b). ATA is the first small molecule known to bind to AIF and to prevent the AIF–DNA interaction.
Figure 6.
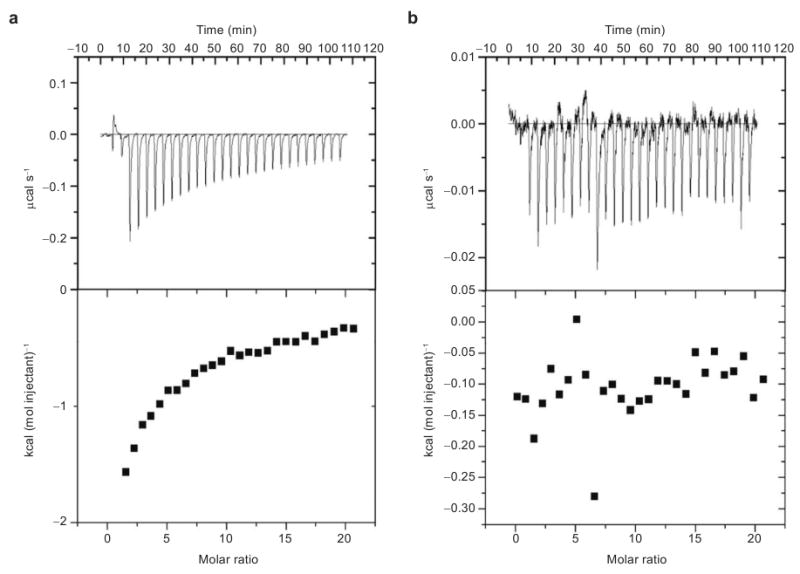
ITC measurements of AIF binding to either ATA or p-rosolic acid. a) ATA binds to AIF with a Kd = 19 ± 5 μM, while b) p-rosolic acid shows little affinity for AIF. The affinity of AIF for ATA was calculated using a single-site model using Origin software.
Given the difficulty in identifying inhibitors of protein–nucleic acid interactions, a facile, general, method for identifying them would be of great value to the chemical biology and medicinal chemistry community. The data presented herein indicate that the photonic crystal biosensor assay is suitable for the rapid identification of inhibitors of protein–nucleic acid interactions. Photonic crystal technology is analogous to SPR-based methods of detecting binding events, with the key advantage of full compatibility with the standard 384-well format, allowing for high-throughput screening of large compound libraries. In its current incarnation, the biosensor readout instrument allows for the screening of >120 plates per 8 h, translating to a maximum of ∼22,000 individual wells per day. Notably, the PC biosensor was able to identify a relatively weak AIF ligand (Kd = 19 μM) that inhibits the AIF–DNA interaction. As with other optical biosensors, detection of binding is ultimately based on differences in molecular weight; thus a decreased signal will be obtained if the ligand is much smaller than its protein or nucleic acid binding partner. While only demonstrated herein for protein–DNA interactions, analogous experiments with protein–RNA and protein–protein interactions can easily be envisioned. In addition to applications in protein–DNA disruption, screens for compounds that enhance protein–DNA interactions would also be feasible with this technology.
We have utilized the PC biosensor technology to discover the first inhibitor of AIF–DNA binding, although the relatively weak potency of ATA and its documented promiscuity (ATA has been found to inhibit targets including von Willebrand factor (68) gp120 and interferon-α (69), and other DNA binding proteins (70–72)) will likely preclude its use as a cytoprotectant. In addition, the proposed polymeric nature of ATA (73) correlates well with the mechanism of AIF binding, as AIF also binds to a negatively charged polymer. This is further shown by the fact that AIF is not inhibited by carboxylic acid containing compounds that are not known to polymerize (see Supplementary Figure 2). However, there are very few disruptors of protein–nucleic acid interactions, and cases that are well described typically involve nucleic acid binding, not protein binding, as the mechanism of inhibition (4, 74, 75).
Interestingly, our data indicate that ATA inhibits the AIF–DNA interaction by binding directly to AIF. Although in this particular case ATA inhibits the AIF–DNA interaction by binding to the protein, PC technology would also be able to detect compounds that inhibit protein–DNA interactions through DNA binding, as small molecule binding to macromolecular targets induces a much smaller shift in PWV (∼0.1 nm) (50) than the PWV shift upon protein binding to DNA (∼1.0–3.0 nm, see Figures 3 and 4).
In summary, a PC biosensor assay was developed for the purpose of detecting protein–nucleic acid interactions, and this assay was utilized in HTS mode to discover a novel inhibitor of the AIF–DNA interaction. Photonic crystal technology is able to detect both low- and high-affinity protein–DNA interactions, as demonstrated for AIF and MazEF, respectively. In the case of AIF, the photonic crystal biosensor technology avoids problems due to the intrinsic fluorescence of the protein itself, which complicate analogous fluorescence polarization experiments. PC biosensors in the microplate format retain all the advantages of SPR biosensors in the flow cell format except for determination of kinetic on/off rate information, with the highly valuable addition of being readily compatible with high-throughput screening platforms. This technology should find general applicability in high-throughput screens for inhibitors of protein–nucleic acid and protein–protein interactions.
Methods
DNA Oligomers
Randomized dsDNA (5′Bio-CCGGTACGATACG ACGATCGATAGTAGGCC-3′, and its complement: 5′-GGCCTACTAT CGATCGTCGTATCGTACCGG-3′) and DNA containing the promoter binding site of MazEF (5′Bio-GCTCGTATCTACAATGTAGATTGATATA TACTGTATCTACATATGATAGC-3′ and its complement 5′-GCTATCA TATGTAGATACAGTATATATCAATCTACATTGTAGATACGAGC-3′) were purchased from Integrated DNA Technologies (IDT). Control alternating GC DNA (5′Bio-GCGCGCGCGCGCGCGCGCGCGCGCGCGCG CGCGCGCGCGCGCGCGCGCGC-3′ and 5′-CGCGCGCGCGCGCGCGC GCGCGCGCGCGCGCGCGCGCGCGCGCGCGCGCG-3′) and nonbiotinylated oligomers identical in sequence to those above were also purchased from IDT.
Purification of MazEF
MazEF was expressed and purified as described previously (76) with the specified modifications. A pET28a plasmid (Novagen) harboring the mazEF gene was transfected into E. coli BL21 (Invitrogen) and expressed by 1 mM IPTG (RPI) induction. MazEF was then purified by Ni-NTA affinity chromatography (Qiagen). In a deviation of the procedure of Wang et al. (76), Ni-NTA purified MazEF was additionally purified by Sepharose SP cation-exchange chromatography (GE Biosciences). MazEF was then dialyzed into PBS (7.8).
Purification of AIF and pUC19 Plasmid DNA
AIFΔ1-121 was cloned into pET28a (Novagen) and expressed in E. coli Rosetta 2 (Invitrogen). AIFΔ1-121 was purified by Ni-NTA affinity chromatography (Qiagen) and dialyzed into PBS (7.8). pUC19 plasmid DNA was propagated in E. coli DH5α (Invitrogen) and isolated using a plasmid miniprep kit (Qiagen). pUC19 plasmid DNA was then linearized using Nde I (NEB) and purified using a plasmid miniprep kit, pUC19 was stored in 10 mM Tris (pH 8.0).
Electrophoretic Mobility Shift Assays (EMSA)
AIF–DNA binding assays were performed in 50 mM Tris (pH 8.0) 100 mM NaCl with a final reaction volume of 25 μL. A 60 ng amount of linearized pUC19 was incubated with AIF for 15 min at 25 °C. A 5 μL volume of loading dye was then added, and 12.8 μL of the mixture was then loaded onto a 1% agarose gel and electrophoresed for 1 h at 120 V. Assays utilizing ATA were also performed in similar conditions with the addition of 4% DMSO. ATA was part of an in-house library; ATA and p-rosolic acid were purchased (Aldrich) for secondary analyses. Gels were post-stained with SYBR Green I (Cambrex) and visualized on a Bio-Rad gel imager. Densitometry was performed using Image J, and analysis by TableCurve2D v 5.01.
Isothermal Titration Calorimetry (ITC)
AIF and ATA were diluted in 50 mM Tris (pH 8.0) 100 mM NaCl to 5 and 500 μM, respectively. ITC data were collected on a VP-ITC Microcalorimeter (Microcal). Data were fitted using a single site binding model using Origin software provided with the calorimeter.
Protein–DNA Binding Assays and Screen
Biotinylated DNA oligomers were diluted to 1.0 μM in 50 mM HEPES and 150 mM NaCl (pH 7.0). MazEF and AIF were diluted to the appropriate concentrations in PBS, pH 7.8 and 6.3, respectively.
The 384-well microplate streptavidin-coated sensors (SRU Biosystems) were washed with HEPES buffer and stabilized at RT. A 1 μM solution of biotinylated DNA oligomers was added, the microplate was covered with a thermal seal (Fisher Scientific) and incubated overnight at 4 °C. All wells were blocked for 2 h at 4 °C with Starting Block (Pierce Biotechnology). Protein dilutions were transferred to the PC biosensor plate utilizing a Biomek NxP liquid handler (Beckman Coulter). Kinetic data were measured with the biosensor readout instrument (SRU Biosystems BIND Reader) every 3 min for 1 h. Data were fitted utilizing GraphPad Prism (Graphpad Software).
For measuring the inhibitory action of free promoter DNA, MazEF and AIF were diluted to 1.84 and 7.02 μM, respectively. Nonbiotinylated DNA oligomers were diluted to the appropriate concentration in PBS pH 7.8 or pH 6.3, depending on their binding partner. Nonbiotinylated DNA oligomers were incubated with MazEF or AIF for 15 min prior to addition to the DNA-containing sensor plate.
Screening conditions were similar to those described above, including buffer conditions (with the addition of 0.05% Tween 20 (Sigma) and biotinylated DNA concentrations. The final concentration of AIF was 3.51 μM, and the final concentration of the nonbiotinylated DNA used as a positive control was 6.25 μM. All compounds were stored at 4 °C in DMSO at 2.5 mM. Compounds were diluted to 50 μM in PBS (pH 6.3 0.05% Tween) and added to AIF giving a final concentration of 25 μM. After a 15 min RT incubation, AIF and compounds were added to the DNA-containing sensor plate read for 30 min.
Data Analysis
The PWV shift (shift in peak wavelength value of reflectance) of screening compounds at 30 min was normalized for every plate via percent inhibition
| (1) |
where NSBP (the nonspecific binding of the protein to a blocked surface without DNA) was measured on wells with a blocked surface. P represents the protein binding signal and PI is the signal from wells with protein preincubated with compounds. NSBI was the nonspecific binding of the test compounds to a blocked surface without DNA. The Z′ factor
| (2) |
was calculated to determine quality of the screening assay, with σ the standard deviation, and μ the mean, of positive and negative controls (67).
Supplementary Material
Acknowledgments
We are grateful to the National Institutes of Health (R01 CA118562) for funding this work. The authors thankfully acknowledge SRU Biosystems for providing the photonic crystal biosensor microplates and N. Wang (University of Illinois) for providing the MazEF gene. The authors also extend their gratitude to the support staff of the Micro and Nanotechnology Laboratory at the University of Illinois at Urbana–Champaign.
Footnotes
Supporting Information Available: This material is free of charge via the Internet.
References
- 1.Robertson JD, Orrenius S, Zhivotovsky B. Review: nuclear events in apoptosis. J Struct Biol. 2000;129:346–358. doi: 10.1006/jsbi.2000.4254. [DOI] [PubMed] [Google Scholar]
- 2.Wesche H, Xiao SH, Young SW. High throughput screening for protein kinase inhibitors. Comb Chem High Throughput Screening. 2005;8:181–195. doi: 10.2174/1386207053258514. [DOI] [PubMed] [Google Scholar]
- 3.Arkin MR, Wells JA. Small-molecule inhibitors of protein-protein interactions: progressing towards the dream. Nat Rev Drug Discovery. 2004;3:301–317. doi: 10.1038/nrd1343. [DOI] [PubMed] [Google Scholar]
- 4.Boger DL, Desharnais J, Capps K. Solution-phase combinatorial libraries: modulating cellular signaling by targeting protein-protein or protein-DNA interactions. Angew Chem Int Ed. 2003;42:4138–4176. doi: 10.1002/anie.200300574. [DOI] [PubMed] [Google Scholar]
- 5.Fry DC. Protein-protein interactions as targets for small molecule drug discovery. Biopolymers. 2006;84:535–552. doi: 10.1002/bip.20608. [DOI] [PubMed] [Google Scholar]
- 6.Redell MS, Tweardy DJ. Targeting transcription factors for cancer therapy. Curr Pharm Des. 2005;11:2873–2887. doi: 10.2174/1381612054546699. [DOI] [PubMed] [Google Scholar]
- 7.Chen L, Tilley J, Trilles RV, Yun W, Fry D, Cook C, Rowan K, Schwinge V, Campbell R. N-acyl-L-phenylalanine derivatives as potent VLA-4 antagonists that mimic a cyclic peptide conformation. Bioorg Med Chem Lett. 2002;12:137–140. doi: 10.1016/s0960-894x(01)00711-9. [DOI] [PubMed] [Google Scholar]
- 8.Hartman GD, Egbertson MS, Halczenko W, Laswell WL, Duggan ME, Smith RL, Naylor AM, Manno PD, Lynch RJ, Zhang G, Chang CTC, Gould RJ. Non-peptide fibrinogen receptor antagonists. 1 Discovery and design of exosite inhibitors. J Med Chem. 1992;35:4640–4642. doi: 10.1021/jm00102a020. [DOI] [PubMed] [Google Scholar]
- 9.Kallen J, Welzenbach K, Ramage P, Geyl D, Kriwacki R, Legge G, Cottens S, Weitz-Schmidt G, Hommel U. Structural basis for LFA-1 inhibition upon lovastatin binding to the CD11a I-domain. J Mol Biol. 1999;292:1–9. doi: 10.1006/jmbi.1999.3047. [DOI] [PubMed] [Google Scholar]
- 10.Sarabu R, Cooper JP, Cook CM, Gillespie P, Perrotta AV, Olson GL. Design and synthesis of small molecule interleukin-1 receptor antagonists based on a benzene template. Drug Des Discovery. 1998;15:191–198. [PubMed] [Google Scholar]
- 11.Braisted AC, Oslob JD, Delano WL, Hyde J, McDowell RS, Waal N, Yu C, Arkin MR, Raimundo BC. Discovery of a potent small molecule IL-2 inhibitor through fragment assembly. J Am Chem Soc. 2003;125:3714–3715. doi: 10.1021/ja034247i. [DOI] [PubMed] [Google Scholar]
- 12.He MM, Smith AS, Oslob JD, Flanagan WM, Braisted AC, Whitty A, Cancilla MT, Wang J, Lugovskoy AA, Yoburn JC, Fung AD, Farrington G, Eldredge JK, Day ES, Cruz LA, Cachero TG, Miller SK, Friedman JE, Choong IC, Cunningham BC. Small-molecule inhibition of TNF-alpha. Science. 2005;310:1022–1025. doi: 10.1126/science.1116304. [DOI] [PubMed] [Google Scholar]
- 13.McMillan K, Adler M, Auld DS, Baldwin JJ, Blasko E, Browne LJ, Chelsky D, Davey D, Dolle RE, Eagen KA, Erickson S, Feldman RI, Glaser CB, Mallari C, Morrissey MM, Ohlmeyer MH, Pan G, Parkinson JF, Phillips GB, Polokoff MA, Sigal NH, Vergona R, Whitlow M, Young TA, Devlin JJ. Allosteric inhibitors of inducible nitric oxide synthase dimerization discovered via combinatorial chemistry. Proc Natl Acad Sci USA. 2000;97:1506–1511. doi: 10.1073/pnas.97.4.1506. [DOI] [PMC free article] [PubMed] [Google Scholar]
- 14.Shultz MD, Bowman MJ, Ham YW, Zhao X, Tora G, Chmielewski J. Small-Molecule Inhibitors of HIV-1 Protease Dimerization Derived from Cross-Linked Interfacial Peptides. Angew Chem Int Ed. 2000;39:2710–2713. doi: 10.1002/1521-3773(20000804)39:15<2710::aid-anie2710>3.0.co;2-p. [DOI] [PubMed] [Google Scholar]
- 15.Oltersdorf T, Elmore SW, Shoemaker AR, Armstrong RC, Augeri DJ, Belli BA, Bruncko M, Deckwerth TL, Dinges J, Hajduk PJ, Joseph MK, Kitada S, Korsmeyer SJ, Kunzer AR, Letai A, Li C, Mitten MJ, Nettesheim DG, Ng S, Nimmer PM, O'Connor JM, Oleksijew A, Petros AM, Reed JC, Shen W, Tahir SK, Thompson CB, Tomaselli KJ, Wang B, Wendt MD, Zhang H, Fesik SW, Rosenberg SH. An inhibitor of Bcl-2 family proteins induces regression of solid tumours. Nature. 2005;435:677–681. doi: 10.1038/nature03579. [DOI] [PubMed] [Google Scholar]
- 16.Oost TK, Sun C, Armstrong RC, Al-Assaad AS, Betz SF, Deckwerth TL, Ding H, Elmore SW, Meadows RP, Olejniczak ET, Oleksijew A, Oltersdorf T, Rosenberg SH, Shoemaker AR, Tomaselli KJ, Zou H, Fesik SW. Discovery of potent antagonists of the antiapoptotic protein XIAP for the treatment of cancer. J Med Chem. 2004;47:4417–4426. doi: 10.1021/jm040037k. [DOI] [PubMed] [Google Scholar]
- 17.Darnell JE., Jr Transcription factors as targets for cancer therapy. Nat Rev Cancer. 2002;2:740–749. doi: 10.1038/nrc906. [DOI] [PubMed] [Google Scholar]
- 18.Rishi V, Potter T, Laudeman J, Reinhart R, Silvers T, Selby M, Stevenson T, Krosky P, Stephen AG, Acharya A, Moll J, Oh WJ, Scudiero D, Shoemaker RH, Vinson C. A high-throughput fluorescence-anisotropy screen that identifies small molecule inhibitors of the DNA binding of B-ZIP transcription factors. Anal Biochem. 2005;340:259–271. doi: 10.1016/j.ab.2005.02.012. [DOI] [PubMed] [Google Scholar]
- 19.Nguyen-Hackley DH, Ramm E, Taylor CM, Joung JK, Dervan PB, Pabo CO. Allosteric inhibition of zinc-finger binding in the major groove of DNA by minor-groove binding ligands. Biochemistry. 2004;43:3880–3890. doi: 10.1021/bi030223c. [DOI] [PubMed] [Google Scholar]
- 20.Song H, Wang R, Wang S, Lin J. A low-molecular-weight compound discovered through virtual database screening inhibits Stat3 function in breast cancer cells. Proc Natl Acad Sci USA. 2005;102:4700–4705. doi: 10.1073/pnas.0409894102. [DOI] [PMC free article] [PubMed] [Google Scholar]
- 21.Turkson J, Ryan D, Kim JS, Zhang Y, Chen Z, Haura E, Laudano A, Sebti S, Hamilton AD, Jove R. Phosphotyrosyl peptides block Stat3-mediated DNA binding activity, gene regulation, and cell transformation. J Biol Chem. 2001;276:45443–45455. doi: 10.1074/jbc.M107527200. [DOI] [PubMed] [Google Scholar]
- 22.Berg T, Cohen SB, Desharnais J, Sonderegger C, Maslyar DJ, Goldberg J, Boger DL, Vogt PK. Small-molecule antagonists of Myc/Max dimerization inhibit Myc-induced transformation of chicken embryo fibroblasts. Proc Natl Acad Sci USA. 2002;99:3830–3835. doi: 10.1073/pnas.062036999. [DOI] [PMC free article] [PubMed] [Google Scholar]
- 23.Kiessling A, Sperl B, Hollis A, Eick D, Berg T. Selective inhibition of c-Myc/Max dimerization and DNA binding by small molecules. Chem Biol. 2006;13:745–751. doi: 10.1016/j.chembiol.2006.05.011. [DOI] [PubMed] [Google Scholar]
- 24.Jones DT, Harris AL. Identification of novel small-molecule inhibitors of hypoxia-inducible factor-1 transactivation and DNA binding. Mol Cancer Ther. 2006;5:2193–2202. doi: 10.1158/1535-7163.MCT-05-0443. [DOI] [PubMed] [Google Scholar]
- 25.Lauth M, Bergstrom A, Shimokawa T, Toftgard R. Inhibition of GLI-mediated transcription and tumor cell growth by small-molecule antagonists. Proc Natl Acad Sci USA. 2007;104:8455–8460. doi: 10.1073/pnas.0609699104. [DOI] [PMC free article] [PubMed] [Google Scholar]
- 26.Vassilev LT, Vu BT, Graves B, Carvajal D, Podlaski F, Filipovic Z, Kong N, Kammlott U, Lukacs C, Klein C, Fotouhi N, Liu EA. In vivo activation of the p53 pathway by small-molecule antagonists of MDM2. Science. 2004;303:844–848. doi: 10.1126/science.1092472. [DOI] [PubMed] [Google Scholar]
- 27.Kwon Y, Arndt HD, Mao Q, Choi Y, Kawazoe Y, Dervan PB, Uesugi M. Small molecule transcription factor mimic. J Am Chem Soc. 2004;126:15940–15941. doi: 10.1021/ja0445140. [DOI] [PubMed] [Google Scholar]
- 28.Mapp AK, Ansari AZ, Ptashne M, Dervan PB. Activation of gene expression by small molecule transcription factors. Proc Natl Acad Sci USA. 2000;97:3930–3935. doi: 10.1073/pnas.97.8.3930. [DOI] [PMC free article] [PubMed] [Google Scholar]
- 29.Lin Q, Barbas CF, 3rd, Schultz PG. Small-molecule switches for zinc finger transcription factors. J Am Chem Soc. 2003;125:612–613. doi: 10.1021/ja028408e. [DOI] [PubMed] [Google Scholar]
- 30.Minter AR, Brennan BB, Mapp AK. A small molecule transcriptional activation domain. J Am Chem Soc. 2004;126:10504–10505. doi: 10.1021/ja0473889. [DOI] [PubMed] [Google Scholar]
- 31.Rowe SP, Casey RJ, Brennan BB, Buhrlage SJ, Mapp AK. Transcriptional up-regulation in cells mediated by a small molecule. J Am Chem Soc. 2007;129:10654–10655. doi: 10.1021/ja0736865. [DOI] [PubMed] [Google Scholar]
- 32.Bulyk ML. DNA microarray technologies for measuring protein-DNA interactions. Curr Opin Biotechnol. 2006;17:422–430. doi: 10.1016/j.copbio.2006.06.015. [DOI] [PMC free article] [PubMed] [Google Scholar]
- 33.Lundblad JR, Laurance M, Goodman RH. Fluorescence polarization analysis of protein-DNA and protein-protein interactions. Mol Endocrinol. 1996;10:607–612. doi: 10.1210/mend.10.6.8776720. [DOI] [PubMed] [Google Scholar]
- 34.Hellman LM, Fried MG. Electrophoretic mobility shift assay (EMSA) for detecting protein-nucleic acid interactions. Nat Protoc. 2007;2:1849–1861. doi: 10.1038/nprot.2007.249. [DOI] [PMC free article] [PubMed] [Google Scholar]
- 35.Galas DJ, Schmitz A. DNAse footprinting: a simple method for the detection of protein-DNA binding specificity. Nucleic Acids Res. 1978;5:3157–3170. doi: 10.1093/nar/5.9.3157. [DOI] [PMC free article] [PubMed] [Google Scholar]
- 36.Petri V, Brenowitz M. Quantitative nucleic acids footprinting: thermodynamic and kinetic approaches. Curr Opin Biotechnol. 1997;8:36–44. doi: 10.1016/s0958-1669(97)80155-3. [DOI] [PubMed] [Google Scholar]
- 37.Kim TH, Ren B. Genome-wide analysis of protein-DNA interactions. Annu Rev Genomics Hum Genet. 2006;7:81–102. doi: 10.1146/annurev.genom.7.080505.115634. [DOI] [PubMed] [Google Scholar]
- 38.Oda M, Nakamura H. Thermodynamic and kinetic analyses for understanding sequence-specific DNA recognition. Genes Cells. 2000;5:319–326. doi: 10.1046/j.1365-2443.2000.00335.x. [DOI] [PubMed] [Google Scholar]
- 39.Majka J, Speck C. Analysis of protein-DNA interactions using surface plasmon resonance. Adv Biochem Eng Biotechnol. 2007;104:13–36. [PubMed] [Google Scholar]
- 40.Boozer C, Kim G, Cong S, Guan H, Londergan T. Looking towards label-free biomolecular interaction analysis in a high-throughput format: a review of new surface plasmon resonance technologies. Curr Opin Biotechnol. 2006;17:400–405. doi: 10.1016/j.copbio.2006.06.012. [DOI] [PubMed] [Google Scholar]
- 41.Shumaker-Parry JS, Aebersold R, Campbell CT. Parallel, quantitative measurement of protein binding to a 120-element double-stranded DNA array in real time using surface plasmon resonance microscopy. Anal Chem. 2004;76:2071–2082. doi: 10.1021/ac035159j. [DOI] [PubMed] [Google Scholar]
- 42.Sakanyan V. High-throughput and multiplexed protein array technology: protein-DNA and protein-protein interactions. J Chromatogr B Anal Technol Biomed Life Sci. 2005;815:77–95. doi: 10.1016/j.jchromb.2004.08.045. [DOI] [PubMed] [Google Scholar]
- 43.Degterev A, Lugovskoy A, Cardone M, Mulley B, Wagner G, Mitchison T, Yuan J. Identification of small-molecule inhibitors of interaction between the BH3 domain and Bcl-xL. Nat Cell Biol. 2001;3:173–182. doi: 10.1038/35055085. [DOI] [PubMed] [Google Scholar]
- 44.Pope AJ, Haupts UM, Moore KJ. Homogeneous fluorescence readouts for miniaturized high-throughput screening: theory and practice. Drug Discovery Today. 1999;4:350–362. doi: 10.1016/s1359-6446(99)01340-9. [DOI] [PubMed] [Google Scholar]
- 45.Trinquet E, Mathis G. Fluorescence technologies for the investigation of chemical libraries. Mol BioSyst. 2006;2:380–387. doi: 10.1039/b607152j. [DOI] [PubMed] [Google Scholar]
- 46.Gribbon P, Sewing A. Fluorescence readouts in HTS: no gain without pain? Drug Discovery Today. 2003;8:1035–1043. doi: 10.1016/s1359-6446(03)02895-2. [DOI] [PubMed] [Google Scholar]
- 47.Ng PY, Tang Y, Knosp WM, Stadler HS, Shaw JT. Synthesis of diverse lactam carboxamides leading to the discovery of a new transcription-factor inhibitor. Angew Chem Int Ed. 2007;46:5352–5355. doi: 10.1002/anie.200700762. [DOI] [PubMed] [Google Scholar]
- 48.Vahsen N, Cande C, Dupaigne P, Giordanetto F, Kroemer RT, Herker E, Scholz S, Modjtahedi N, Madeo F, Le Cam E, Kroemer G. Physical interaction of apoptosis-inducing factor with DNA and RNA. Oncogene. 2006;25:1763–1774. doi: 10.1038/sj.onc.1209206. [DOI] [PubMed] [Google Scholar]
- 49.Ye H, Cande C, Stephanou NC, Jiang S, Gurbuxani S, Larochette N, Daugas E, Garrido C, Kroemer G, Wu H. DNA binding is required for the apoptogenic action of apoptosis inducing factor. Nat Struct Biol. 2002;9:680–684. doi: 10.1038/nsb836. [DOI] [PubMed] [Google Scholar]
- 50.Cunningham BT, Li P, Schulz S, Lin B, Baird C, Gerstenmaier J, Genick C, Wang F, Fine E, Laing L. Label-free assays on the BIND system. J Biomol Screening. 2004;9:481–490. doi: 10.1177/1087057104267604. [DOI] [PubMed] [Google Scholar]
- 51.Hayes F. Toxins-antitoxins: plasmid maintenance, programmed cell death, and cell cycle arrest. Science. 2003;301:1496–1499. doi: 10.1126/science.1088157. [DOI] [PubMed] [Google Scholar]
- 52.Mittenhuber G. Occurrence of mazEF-like antitoxin/toxin systems in bacteria. J Mol Microbiol Biotechnol. 1999;1:295–302. [PubMed] [Google Scholar]
- 53.Moritz EM, Hergenrother PJ. Toxin-antitoxin systems are ubiquitous and plasmid-encoded in vancomycin-resistant enterococci. Proc Natl Acad Sci USA. 2007;104:311–316. doi: 10.1073/pnas.0601168104. [DOI] [PMC free article] [PubMed] [Google Scholar]
- 54.Kamada K, Hanaoka F, Burley SK. Crystal structure of the MazE/MazF complex: molecular bases of antidote-toxin recognition. Mol Cell. 2003;11:875–884. doi: 10.1016/s1097-2765(03)00097-2. [DOI] [PubMed] [Google Scholar]
- 55.Zhang J, Zhang Y, Inouye M. Characterization of the interactions within the mazEF addiction module of Escherichia coli. J Biol Chem. 2003;278:32300–32306. doi: 10.1074/jbc.M304767200. [DOI] [PubMed] [Google Scholar]
- 56.Modjtahedi N, Giordanetto F, Madeo F, Kroemer G. Apoptosis-inducing factor: vital and lethal. Trends Cell Biol. 2006;16:264–272. doi: 10.1016/j.tcb.2006.03.008. [DOI] [PubMed] [Google Scholar]
- 57.Heeres JT, Hergenrother PJ. Poly(ADP-ribose) makes a date with death. Curr Opin Chem Biol. 2007;11:644–653. doi: 10.1016/j.cbpa.2007.08.038. [DOI] [PubMed] [Google Scholar]
- 58.Miramar MD, Costantini P, Ravagnan L, Saraiva LM, Haouzi D, Brothers G, Penninger JM, Peleato ML, Kroemer G, Susin SA. NADH oxidase activity of mitochondrial apoptosis-inducing factor. J Biol Chem. 2001;276:16391–16398. doi: 10.1074/jbc.M010498200. [DOI] [PubMed] [Google Scholar]
- 59.Mate MJ, Ortiz-Lombardia M, Boitel B, Haouz A, Tello D, Susin SA, Penninger J, Kroemer G, Alzari PM. The crystal structure of the mouse apoptosis-inducing factor AIF. Nat Struct Biol. 2002;9:442–446. doi: 10.1038/nsb793. [DOI] [PubMed] [Google Scholar]
- 60.Chu CT, Zhu JH, Cao G, Signore A, Wang S, Chen J. Apoptosis inducing factor mediates caspase-independent 1-methyl-4-phenylpyridinium toxicity in dopaminergic cells. J Neurochem. 2005;94:1685–1695. doi: 10.1111/j.1471-4159.2005.03329.x. [DOI] [PMC free article] [PubMed] [Google Scholar]
- 61.Culmsee C, Zhu C, Landshamer S, Becattini B, Wagner E, Pellecchia M, Blomgren K, Plesnila N. Apoptosis-inducing factor triggered by poly(ADP-ribose) polymerase and Bid mediates neuronal cell death after oxygen-glucose deprivation and focal cerebral ischemia. J Neurosci. 2005;25:10262–10272. doi: 10.1523/JNEUROSCI.2818-05.2005. [DOI] [PMC free article] [PubMed] [Google Scholar]
- 62.Oh YK, Shin KS, Kang SJ. AIF translocates to the nucleus in the spinal motor neurons in a mouse model of ALS. Neurosci Lett. 2006;406:205–210. doi: 10.1016/j.neulet.2006.07.044. [DOI] [PubMed] [Google Scholar]
- 63.Almeida S, Brett AC, Gois IN, Oliveira CR, Rego AC. Caspase-dependent and -independent cell death induced by 3-nitropropionic acid in rat cortical neurons. J Cell Biochem. 2006;98:93–101. doi: 10.1002/jcb.20748. [DOI] [PubMed] [Google Scholar]
- 64.Lin B, Qiu J, Gerstenmeier J, Li P, Pien H, Pepper J, Cunningham B. A label-free optical technique for detecting small molecule interactions. Biosens Bioelectron. 2002;17:827–834. doi: 10.1016/s0956-5663(02)00077-5. [DOI] [PubMed] [Google Scholar]
- 65.Cunningham BT, Laing L. Microplate-based, label-free detection of biomolecular interactions: applications in proteomics. Expert Rev Proteomics. 2006;3:271–281. doi: 10.1586/14789450.3.3.271. [DOI] [PubMed] [Google Scholar]
- 66.Hergenrother PJ. Obtaining and screening compound collections: a user's guide and a call to chemists. Curr Opin Chem Biol. 2006;10:213–218. doi: 10.1016/j.cbpa.2006.04.005. [DOI] [PubMed] [Google Scholar]
- 67.Zhang JH, Chung TD, Oldenburg KR. A Simple Statistical Parameter for Use in Evaluation and Validation of High Throughput Screening Assays. J Biomol Screening. 1999;4:67–73. doi: 10.1177/108705719900400206. [DOI] [PubMed] [Google Scholar]
- 68.Phillips MD, Moake JL, Nolasco L, Turner N. Aurin tricarboxylic acid: a novel inhibitor of the association of von Willebrand factor and platelets. Blood. 1988;72:1898–1903. [PubMed] [Google Scholar]
- 69.Gan YX, Weaver JL, Pine PS, Zoon KC, Aszalos A. Aurin tricarboxylic acid, the anti-AIDS compound, prevents the binding of interferon-alpha to its receptor. Biochem Biophys Res Commun. 1990;172:1298–1303. doi: 10.1016/0006-291x(90)91590-o. [DOI] [PubMed] [Google Scholar]
- 70.Hallick RB, Chelm BK, Gray PW, Orozco EM., Jr Use of aurintricarboxylic acid as an inhibitor of nucleases during nucleic acid isolation. Nucleic Acids Res. 1977;4:3055–3064. doi: 10.1093/nar/4.9.3055. [DOI] [PMC free article] [PubMed] [Google Scholar]
- 71.Catchpoole DR, Stewart BW. Inhibition of topoisomerase II by aurintricarboxylic acid: implications for mechanisms of apoptosis. Anticancer Res. 1994;14:853–856. [PubMed] [Google Scholar]
- 72.Benchokroun Y, Couprie J, Larsen AK. Aurintricarboxylic acid, a putative inhibitor of apoptosis, is a potent inhibitor of DNA topoisomerase II in vitro and in Chinese hamster fibrosarcoma cells. Biochem Pharmacol. 1995;49:305–313. doi: 10.1016/0006-2952(94)00465-x. [DOI] [PubMed] [Google Scholar]
- 73.Gonzalez RG, Haxo RS, Schleich T. Mechanism of action of polymeric aurintricarboxylic acid, a potent inhibitor of protein-nucleic acid interactions. Biochemistry. 1980;19:4299–4303. doi: 10.1021/bi00559a023. [DOI] [PubMed] [Google Scholar]
- 74.Pommier Y, Marchand C. Interfacial inhibitors of protein-nucleic acid interactions. Curr Med Chem Anticancer Agents. 2005;5:421–429. doi: 10.2174/1568011054222337. [DOI] [PubMed] [Google Scholar]
- 75.Dervan PB, Edelson BS. Recognition of the DNA minor groove by pyrrole-imidazole polyamides. Curr Opin Struct Biol. 2003;13:284–299. doi: 10.1016/s0959-440x(03)00081-2. [DOI] [PubMed] [Google Scholar]
- 76.Wang NR, Hergenrother PJ. A continuous fluorometric assay for the assessment of MazF ribonuclease activity. Anal Biochem. 2007;371:173–183. doi: 10.1016/j.ab.2007.07.017. [DOI] [PMC free article] [PubMed] [Google Scholar]
Associated Data
This section collects any data citations, data availability statements, or supplementary materials included in this article.