

Abstract
Recently, macrophages have been characterized as having an M1 or M2 phenotype based on receptor expression, cytokine and effector molecule production, and function. The effects of macrophage phenotype upon tissue remodeling following the implantation of a biomaterial are largely unknown. The objectives of this study were to determine the effects of a cellular component within an implanted extracellular matrix (ECM) scaffold upon macrophage phenotype, and to determine the relationship between macrophage phenotype and tissue remodeling. Partial-thickness defects in the abdominal wall musculature of Sprague–Dawley rats were repaired with autologous body wall tissue, acellular allogeneic rat body wall ECM, xenogeneic pig urinary bladder tissue, or acellular xenogeneic pig urinary bladder ECM. At 3, 7, 14, and 28 days the host tissue response was characterized using histologic, immunohistochemical, and RT-PCR methods. The acellular test articles were shown to elicit a predominantly M2 type response and resulted in constructive remodeling, while those containing a cellular component, even an autologous cellular component, elicited a predominantly M1 type response and resulted in deposition of dense connective tissue and/or scarring. We conclude that the presence of cellular material within an ECM scaffold modulates the phenotype of the macrophages participating in the host response following implantation, and that the phenotype of the macrophages participating in the host response appears to be related to tissue remodeling outcome.
Keywords: ECM (extracellular matrix), Biocompatibility, Macrophage, Monocyte, Wound healing
1. Introduction
The extracellular matrix (ECM) represents the secreted products, both structural and functional, of the resident cells of each tissue and organ. The composition and ultrastructure of the ECM is determined by factors that influence the phenotype of its resident cells including mechanical forces, biochemical milieu, oxygen requirements, pH and inherent gene expression patterns, among others. In turn, the ECM influences cell attachment, migration, proliferation and three-dimensional organization, serving as an “information highway” between cells [1–3]. For these reasons, multiple forms of allogeneic and xenogeneic ECM from sources such as small intestine, urinary bladder, and skin have been investigated as biologic scaffolds for tissue reconstruction in both preclinical studies and human clinical applications [4,5]. Some studies have shown improved tissue remodeling outcomes when site appropriate autologous cells are either seeded onto the ECM scaffold prior to implantation or placed in contact with the scaffold in-situ [6–8]. However, the survival and fate of such a cellular component during the remodeling process following in vivo implantation is largely unknown, and the effect of the presence of these cells upon the host macrophage response has not been investigated.
Macrophages are a heterogeneous subset of the mononuclear cell population [9–11] involved in the host response to implanted materials. Macrophages are activated in response to tissue damage or infection, causing an increase in the production of cytokines, chemokines, and other inflammatory molecules to which they are exposed [9,12–14]. Recently, macrophage phenotype has been characterized based on distinct functional properties, surface markers, and the cytokine profile of the microenvironment [9,14,15]. Polarized macrophages are referred to as either M1 or M2 cells, mimicking the Th1/Th2 nomenclature [9]. However, M1 and M2 represent extremes along a continuum that includes multiple macrophage phenotypes (M1, M2a, M2b and M2c) [14]. M1, classically activated proinflammatory, macrophages are known to be induced by IFN-γ alone or in combination with LPS, TNF and GM-CSF. In general, M1 activated macrophages express IL-12high, IL-23high, IL-10low; metabolize arginine; produce high levels of inducible nitric oxide synthetase (iNOS); secrete toxic reactive oxygen and nitric oxygen intermediates and inflammatory cytokines such as IL-1β, IL-6, and TNF; and are inducer and effector cells in Th1 type inflammatory responses [15]. In contrast, M2, alternatively activated, macrophages are induced by exposure to a variety of signals including the cytokines IL-4, IL-13, and IL-10, immune complexes, and glucocorticoid or secosteroid (vitamin D3) hormones. M2 activated macrophages express IL-12low, IL-23low, and IL-10high; have high levels of scavenger, mannose, and galactose receptors; produce arginase in the place of arginine, subsequently producing ornithine and polyamines; are involved in polarized Th2 reactions; and possess the ability to facilitate tissue repair and regeneration [10,12,13,15].
Macrophages are a plastic cell population capable of sequentially changing their polarization in response to local stimuli during the process of wound healing [16–18]. The macrophages participating in the host response to an implanted material are exposed to multiple stimuli including cytokines and effector molecules secreted by cells including other macrophages that are participating in the host response, microbial agents, epitopes associated with the implanted biomaterial, and the degradation products of the biomaterial, among others. Therefore, it is logical to assume that the host macrophage response after implantation of a biomaterial is modulated via “cross-talk” between macrophages and the other cells involved in the host response as well as factors within the local microenvironment. The effects of macrophage phenotype upon the tissue remodeling outcome following the implantation of a biomaterial are largely unknown, but recognition of the predominant phenotypic profile may provide a tool by which a constructive and functional tissue remodeling outcome can be predicted and/or promoted.
The objectives of the present study were twofold: (1) to determine the effects of the presence of cells, either autologous or xenogeneic, within an implanted ECM scaffold material upon the phenotype of the macrophages participating in the host response, and (2) to determine the relationship between the M1/M2 profile of the macrophages participating in the host response and the downstream tissue remodeling outcome.
2. Materials and methods
2.1. Overview
Sixty-four Sprague–Dawley rats were randomly divided into four separate groups of sixteen each. 1 cm × 1 cm defects were created in the ventrolateral abdominal wall musculature, and repaired using one of the following materials: (1) cellular autograft (autologous body wall tissue), (2) acellular allograft (allogeneic rat body wall ECM), (3) cellular xenograft (xenogeneic pig urinary bladder tissue), or (4) acellular xenograft (xenogeneic pig urinary bladder ECM). See Table 1. The treatment groups were further subdivided into four groups of four each that were sacrificed at 3, 7, 14, or 28 days post surgery. At the designated time of sacrifice, the operative site plus the surrounding native tissue was explanted and the host tissue response was characterized by histologic methods, immunohistochemical evaluation of macrophage phenotype, and gene expression analysis. All procedures were performed in accordance with NIH guidelines and with the approval of the Institutional Animal Care and Use Committee at the University of Pittsburgh.
Table 1.
Test article composition and origin.
| Graft Composition | Graft Origin |
|---|---|
| Autologous ECM + Autologous Cells | Rat Body Wall (Cellular Autograft) |
| Allogenic ECM without Cells | Rat Body Wall (Acellular Allograft) |
| Xenogeneic ECM + Xenogeneic Cells | Porcine Urinary Bladder (Cellular Xenograft) |
| Xenogeneic ECM without Cells | Porcine Urinary Bladder (Acellular Xenograft) |
2.2. Biologic scaffold device preparation
2.2.1. Harvest and preparation of acellular allograft
The rat body wall tissue for this study was harvested from Sprague–Dawley rats of approximately 200–500 g immediately following sacrifice and then frozen at −80 °C. The tissue consisted of all three muscle layers of the ventral abdominal wall without the overlying skin. The body wall tissue was thawed in phosphate buffered saline (PBS, pH 7.4) at room temperature before being placed in 0.02% trypsin/0.05% EDTA (Trypsin, Sigma, St. Louis, MO; EDTA, Fisher Scientific, Pittsburgh, PA) at room temperature for 2 h on a shaker. Following soaking in trypsin/EDTA, the body wall tissue was washed in PBS on a shaker for 1 h. The body wall tissue was then placed in 3% (v/v) Triton X-100 (Spectrum Chemicals, New Brunswick, NJ) at room temperature on an orbital shaker for 2 h. The Triton X-100 treated samples were then washed in water. Following the water wash, the body wall tissue was placed in 4% (w/v) deoxycholic acid (Spectrum) for 2 h at room temperature on an orbital shaker and then washed in water. The tissue was then treated with a 0.1% peracetic acid/4% ethanol solution for 2 h at room temperature on a shaker to further decellularize and disinfect the tissue. The peracetic acid solution was decanted and the pH of the material was returned to approximately 7.4 by rinsing in PBS at room temperature, with shaking, then in water twice, and then again in PBS. Each rinse lasted 15 min. The remaining tissue consisted of acellular rat body wall ECM (acellular allograft). The absence of cell nuclei in this test article was confirmed by DAPI staining (Fig. 1A).
Fig. 1.
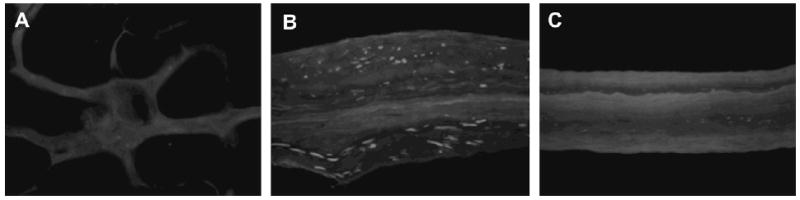
DAPI staining confirms removal of cell nuclei in the acellular allograft (A), maintenance of cell nuclei in the cellular xenograft (B), and removal of cell nuclei in the acellular xenograft (C). The cellular autograft test article is not shown as it was replaced immediately following defect creation in the sterile setting of the operating room (200×).
The rats used in this study were an outbred strain. As the tissue for the acellular allograft was both harvested and implanted into the same outbred rat strain, the intra-strain transplants performed in this study were indeed allografts and cannot be considered isografts.
2.2.2. Harvest and preparation of cellular and acellular xenograft
The porcine bladders for this study were harvested and prepared using methods previously described [19]. The urinary bladders were harvested from market weight pigs of approximately 260 pounds immediately following sacrifice. Two different constructs were prepared from the urinary bladder: 1) cellular xenogeneic bladder tissue, and 2) and acellular xenogeneic bladder ECM.
Excess adipose tissue and collagenous connective tissue were removed from the exterior of the bladder using scissors and the urothelial cells were removed by soaking the bladder tissue in water. The apex of the bladder was then removed and a full thickness cut from the neck of the bladder to the apical opening was made to create a rectangular-shaped sheet. The tunica serosa, tunica muscularis externa, tunica submucosa, and the majority of the muscularis mucosa were removed by mechanical delamination of the abluminal side of the bladder, leaving the basement membrane, tunica propria, and the resident cells intact. The remaining tissue was soaked in PBS and represented cellular xenogeneic pig urinary bladder tissue (cellular xenograft).
A portion of the cellular xenogeneic pig urinary bladder tissue prepared as described above was subjected to the 0.1% peracetic acid/4% ethanol treatment as described for the acellular allograft. The peracetic acid treated material consisted of only the basement membrane and tunica propria without the resident cells and represented acellular xenogeneic pig urinary bladder ECM (acellular xenograft). The presence or absence of cell nuclei in the cellular and acellular xenograft test articles was confirmed by DAPI staining (Fig. 1B and C).
2.2.3. Preparation of 4-layer constructs
Single sheets of the cellular xenograft and acellular xenograft tissue had insufficient strength to serve as a body wall replacement device in the rat model. Therefore, multilaminate (4-layer) sheets were constructed as previously described [20]. In brief, four hydrated sheets of either the cellular xenograft or the acellular xenograft were placed on top of one another, each at 90° orientations to the adjacent layers to create a device with isotropic mechanical properties. The constructs were then placed into plastic pouches and attached to a vacuum pump (Leybold, Export, PA) with a condensate trap inline. The constructs were subjected to a vacuum of 28 inches Hg until dried, leaving a multilaminate construct.
2.2.4. Terminal sterilization of the devices
The acellular allograft, cellular xenograft, and acellular xenograft were terminally sterilized using ethylene oxide gas (EO Gas Sterilizer, Anderson Products Inc., Haw River, NC). The cellular autografts required no terminal sterilization as they were harvested in sterile fashion and replaced during the surgical procedure.
2.3. Animal model
Female Sprague–Dawley rats, age 8–12 weeks, were purchased from Charles River Laboratories (Wilmington, MA). The rats were housed individually in shoebox cages. Room temperature was maintained at 68–76 °C and the rats were fed Purina Iso Pro throughout the study period. Cage bedding was changed at least once per week. All animals were examined by a veterinarian prior to surgery and were determined to be in good health.
2.4. Surgical procedure
A previously described abdominal wall defect model was used [21,22]. Each rat was anesthetized and maintained at a surgical plane of anesthesia with 2% isoflurane in oxygen. The surgical site was prepared in sterile fashion using a betadine (providone-iodine) solution followed by placement of sterile drapes. A ventral midline incision was made and the adjacent subcutis bluntly dissected to expose the ventral lateral abdominal wall including the musculotendinous junction of the oblique musculature.
A 1 cm × 1 cm defect was created in the exposed musculature, leaving the underlying peritoneum and transversalus fascia and the overlying skin intact. The defects were then repaired with one of the test articles (Table 1). The autologous tissue test article was harvested from the defect site and then replaced immediately thereafter in the sterile setting of the operating room. Each implant was sutured to the adjacent abdominal wall with 4-0 Prolene non-absorbable suture at each corner to secure the test article and to allow for identification of the device boundaries at the time of euthanasia and explantation. A minimal amount of suture material was used to avoid eliciting a host response to the suture that would obscure the host response to the test article. The skin was closed using absorbable 4-0 Vicryl suture. The animals were recovered from anesthesia on a heating pad and allowed normal activity and diet for the remainder of the study period.
Each rat received Buprinex (buprenorphine hydrochloride, 0.02 mg) postoperatively as needed for discomfort as evidenced by failure to eat, drink, or resume normal activity. Gentamicin was given subcutaneously (2 mg) postoperatively and once daily for an additional three days. The animals were monitored daily for signs of infection or inflammation at the surgical site. All animals survived the surgical procedure and their predetermined study period without complications.
2.5. Euthanasia and sample harvest
On the predetermined sacrifice date, each animal was anesthetized using isoflurane (5% in oxygen) and then euthanized by intracardiac injection of potassium chloride to induce cardiac arrest. The grafts were explanted with a small amount (approximately 2 mm) of the surrounding native tissue. One half of the tissue was fixed in 10% neutral buffered formalin and then embedded in paraffin. The other half of each specimen was preserved in RNAlater (Ambion, Austin, TX) for RNA extraction.
2.6. Histologic and immunohistochemical staining
Prior to implantation, portions of the acellular allograft, cellular xenograft, and the acellular xenograft test articles were fixed in formalin and embedded in paraffin. These specimens were cut into 6 μm thick sections and mounted on glass slides. The specimens were deparaffinized by treatment with xylene followed by exposure to a graded series of ethanol solutions (100–70%) prior to being coverslipped with Vectastain containing DAPI (Vector, Burlingham, CA) to confirm the presence or absence of cell nuclei (Fig. 1). The cellular autografts were not stained as they were harvested and replaced immediately during the surgical procedure.
The explanted wound site specimens were also fixed in formalin and embedded in paraffin prior to being cut into 6 μm thick sections and mounted on glass slides. The specimens were deparaffinized with xylene followed by exposure to a graded series of ethanol solutions (100–70%). Sections were stained with Masson's trichrome for morphological assessment. The slides were then dehydrated using the reverse of the deparaffinization treatment described above prior to coverslipping.
Immunohistochemistry was performed on consecutive 6 μm sections of each specimen in order to assess the macrophage phenotype within and surrounding the implant wound site. Following deparaffinization, the slides were placed in citrate antigen retrieval buffer (10 mm citric acid monohydrate, pH 6.0, Spectrum) which was then brought to a boil (95–100 °C) for 20 min. The buffer was allowed to cool and the slides were then washed twice in TRIS buffered saline/Tween 20 (Trizma Base, Sigma; Tween 20, Sigma) solution (pH 7.4) and twice in PBS. The sections were incubated in 1.5% normal horse serum (Vector) for 1 h at room temperature in a humidified chamber to inhibit non-specific binding of the primary antibody. Following incubation in blocking serum, the sections were incubated in primary antibody in a humidified chamber at 4 °C overnight. Each tissue specimen was exposed to antibodies to a pan-macrophage marker (CD68), an M1 phenotype marker (CCR7), and an M2 phenotype marker (CD163). Following the overnight incubation, the slides were washed three times in PBS. Sections were then incubated in a solution of 3% H2O2 in methanol for 30 min at room temperature to quench endogenous peroxidase activity. Following H2O2 treatment, the slides were washed three times in PBS prior to incubation in secondary antibody for 30 min in a humidified chamber, at either room temperature (CD68) or 37 °C (CD163, CCR7), and then subjected to three more washes in PBS. The sections were then incubated in Vectastain ABC (Elite ABC kit, Vector) reagent for 30 min in a humidified 37 °C chamber, rinsed 3 times in PBS, and incubated in 4% diaminobenzadine substrate solution (Vector) at room temperature. The slides were rinsed in water to stop the development of the diaminobenzadine substrate and counterstained using Harris hematoxylin stain (Thermo Electron Corporation-Shandon, Pittsburgh, PA). The slides were then dehydrated using the reverse of the deparaffinization treatment described above prior to coverslipping. Each PBS rinse in the protocol was for 3 min at room temperature, with occasional agitation.
The primary antibodies used were mouse anti-rat CD68 (Serotec, Raleigh, NC) at a dilution of 1:50, rabbit anti-CCR7 (Cell Applications, San Diego, CA) at a dilution of 1:100, and mouse anti-rat CD163 (Serotec) at a dilution of 1:50. The secondary antibodies used were biotinylated horse anti-mouse IgG (Vector, CD68 and CD163) at a dilution of 1:50 and goat anti-rabbit IgG (Vector, CCR7) at a dilution of 1:100. All antibodies were diluted in filtered PBS (pH 7.4).
Representative images of the immunohistochemical staining for each surface marker at 7 days post implantation are shown in Fig. 2.
Fig. 2.
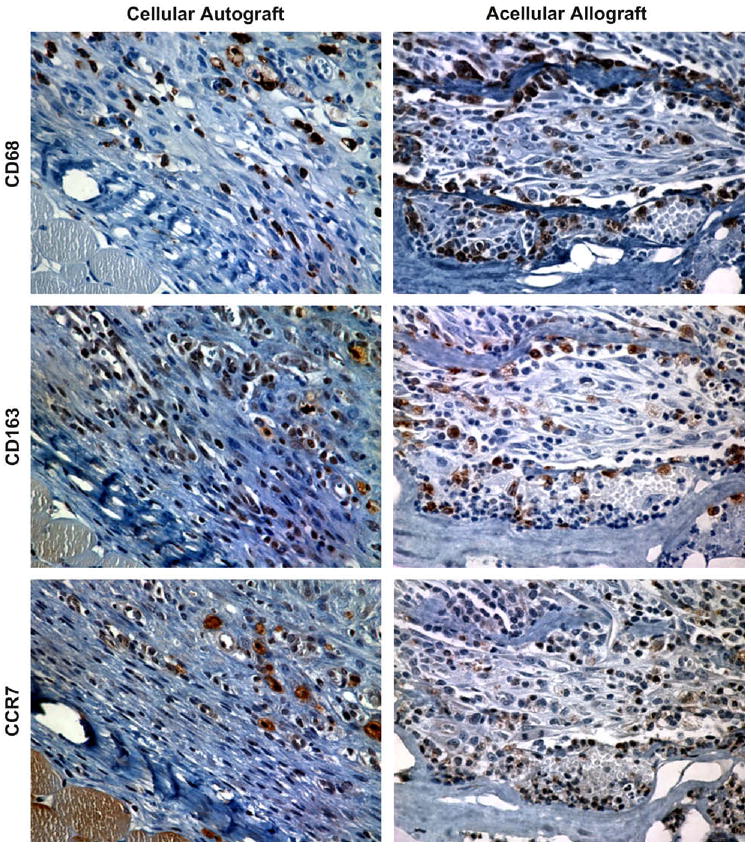
Representative images of immunohistochemical staining for CD68, CD163, and CCR7 in the cellular autograft and acellular allograft test articles at 7 days post surgery (400×).
2.6.1. Histologic and immunohistochemical analysis
A qualitative analysis of the histological morphology of each specimen was performed by a pathologist (SFB) and a trained investigator (BNB). The analysis included an assessment of the intensity and type of cellular infiltration, the presence and extent of vascularity, and the organization of host tissue within and around the wound site. The suture sites were avoided in the morphologic evaluation.
The immunostained slides were examined and imaged by a blinded investigator (BNB) using a Nikon e600 microscope. The images were then evaluated quantitatively in a blinded fashion by two independent investigators (AMSA and JEV). Quantitative analysis was performed by counting the number of immunopositive cells in six matched microscope fields at 400× magnification. Cell counts from negative controls (no primary antibody) were subtracted from the cell counts of the test articles and the percentage of M1 and M2 macrophages was determined by dividing the number of CCR7+ (M1) and CD163+ (M2) cells by the number of CD68+ (pan-macrophage) cells in each field. A ratio of the percentage of M1 cells to M2 cells was also calculated for each field as follows:
M1:M2 = percent M1 cells/percent M2 cells
Values were plotted on a log scale such that values greater than 1.0 were representative of the predominance of M1 cells among those cells staining positive for either M1 or M2 surface markers. Conversely, a value of less than 1.0 was representative of a predominance of M2 cells.
2.7. Gene expression analysis
Total RNA was isolated from the explanted tissues using TRI-Reagent (Molecular Research Center Inc., Cincinnati, OH) according to the manufacturer's instructions. The isolated RNA was then purified using an RNAeasy Mini Kit (Qiagen, Valencia, CA) and a vacuum system (Qiagen). cDNA was synthesized from 1 μg of total RNA in a volume of 20 μL using a Superscript RT III kit (Invitrogen, Carlsbad, CA) according to the manufacturer's instructions.
Quantitative real-time PCR was then performed using primers specific for genes known to be strong indicators of either an M1 (inducible nitric oxide synthase, iNOS) or an M2 (arginase, ARG) type macrophage response. Both primers were custom designed using Beacon Designer 7.2 primer design software (PREMIER Biosoft International, Palo Alto, CA) (Table 2). Primers for the housekeeping gene β glucurodinase (GUSB) were purchased as part of a housekeeping gene primer kit (Rat Housekeeping Gene Primer Set, Real Time Primers, LLC, Elkins Park, PA), and GUSB expression was used to normalize reactions. 1 μL of cDNA was mixed with the appropriate primers and 2× SYBR Green Master Mix (BioRad, Hercules, CA) in a total volume of 25 μL. All reactions were performed in triplicate and were monitored using an iQ5 Real-Time Detection System (BioRad).
Table 2.
Primers used for real-time PCR analysis.
| Gene | Primer |
|---|---|
| iNOS | Forward: 5′-GAGACGCACAGGCAGAGG-3′ |
| Reverse: 5′-CAGGCACACGCAATGATGG-3′ | |
| ARG | Forward: 5′-CATATCTGCCAAGGACATCG-3′ |
| Reverse: 5′-GGTCTCTTCCATCACTTTGC-3′ |
Relative expression of the M1 and M2 genes was calculated using the 2−(ΔCt) method [23,24]. The difference between the value of the threshold cycle for the gene of interest and the value of the threshold cycle for the housekeeping gene (ΔCt) was calculated for each specimen as follows:
ΔCtM1 = CtiNOS − CtGUSB and ΔCtM2 = CtARG − CtGUSB
Expression relative to the housekeeping gene was then expressed as 2−(ΔCt). The relative expression of M1 and M2 genes in each specimen was then compared using the following equation:
Values were plotted on a log scale such that values greater than 1.0 represented a predominance of iNOS gene expression and values less than 1.0 represented a predominance of ARG gene expression.
2.8. Statistical methods
A two-way analysis of variance was used to determine statistical significance of the factor type of scaffold (cellular autograft, acellular allograft, cellular xenograft, acellular xenograft), the factor days (3,7,14, and 28 days), and the interaction between these two factors. For the immunohistochemical analysis, the variables analyzed were percent of M1 cells and percent of M2 cells. For the gene expression analysis, the variables analyzed were iNOS expression and ARG expression. Because the distributions of these variables were strongly skewed, log transformed values were used for the statistical analysis. Results were transformed back to the original scale for presentation. This transformation corresponds to using geometric means in place of arithmetic means. The Tukey multiple comparison procedure was used to determine which pairs of levels of factors were significantly different when a main effect was statistically significant.
3. Results
All of the animals in this study survived the surgical procedure and post-operative period without complications.
3.1. Histopathologic findings
The host response to the cellular autologous body wall tissue test article showed necrosis of the skeletal muscle which was apparent as early as the 3 day post surgery time point. Neutrophils and mononuclear cells were present within the wound site at day 3 and showed a marked increase in number at 7 days post surgery (Fig. 3A). By day 14, the cell population was decreased in number, the necrotic muscle fibers were decreased in size, and there was deposition of neomatrix at the site of remodeling. By day 28, dense partially organized connective tissue consistent with scar tissue and a small population of randomly distributed mononuclear cells were present within the remodeled site (Fig. 3B).
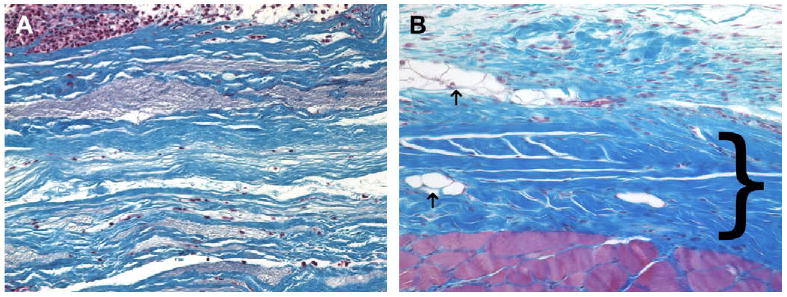
Fig. 3.
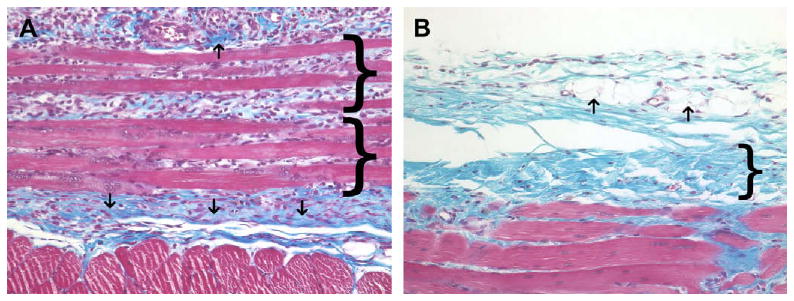
(A) Histologic appearance of the cellular autograft at 7 days post surgery. Necrotic skeletal muscle (brackets), early neomatrix deposition (arrows), neutrophils, and macrophages were present. (B) Histologic appearance of the cellular autograft at 28 days post surgery. Autograft muscle tissue has been completely resorbed and replaced by dense poorly organized connective tissue (bracket), adipose tissue (arrows), and a small number of randomly distributed macrophages. Red staining tissue bundles at the bottom of the images represent the underlying transversalis muscle (Masson's Trichrome, 200×).
The host response to the acellular allogeneic body wall tissue test article was characterized by a dense cellular infiltrate of equal numbers of neutrophils and mononuclear cells at day 3. Angiogenesis was also observed at 3 days post surgery and remained a feature of the remodeling wound site throughout the study period. The cellular infiltrate increased in number and was primarily composed of mononuclear cells on day 7 accompanied by a small amount of neomatrix deposition, especially at the periphery of the implant (Fig. 4A). By day 14, the acellular allograft material was still discernable, but was diffusely and uniformly infiltrated with host mononuclear cells that were embedded within new ECM. By day 28, the acellular allograft material was no longer visible and was replaced by moderately well organized collagenous and adipose tissue containing blood vessels, a small number of randomly dispersed mononuclear cells, and small islands of skeletal myoblasts (Fig. 4B).
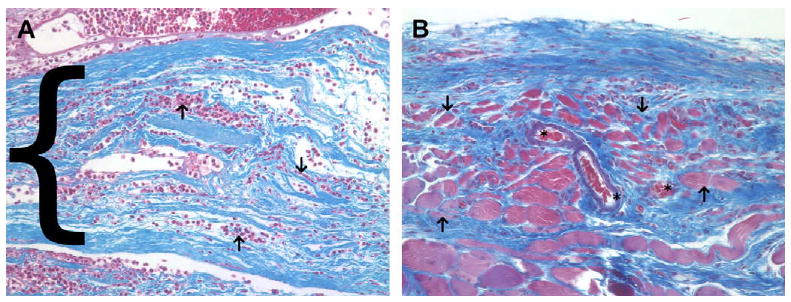
Fig. 4.
(A) Histologic appearance of the acellular allograft at 7 days post surgery. A dense cell population consisting primarily of macrophages was present. New blood vessels (asterisks) and neomatrix (blue staining) deposition were also present. (B) Histologic appearance of the acellular allograft at 28 days post surgery. The acellular allograft was no longer discernable and was replaced by moderately well organized collagenous tissue containing blood vessels (asterisks), islands of skeletal myoblasts (arrows) and a small number of randomly distributed mononuclear cells. Red staining tissue bundles at the bottom of the images represent the underlying transversalis muscle (Masson's Trichrome, 200×).
The host response to the cellular xenogeneic urinary bladder tissue test article was characterized by a dense accumulation of neutrophils with a lesser number of mononuclear cells at day 3. Maximum cellularity occurred at 7 days (Fig. 5A) with extension of the inflammatory response into the surrounding normal tissue. The multilaminate device was still visible at day 14 and neomatrix could be identified. The cellular infiltrate at day 14 was characterized by a mixture of mononuclear cells and a lesser number of neutrophils. By day 28, the implant was no longer visible, and there was an accumulation of dense, poorly organized collagenous connective tissue and a small amount of adipose tissue including a uniformly distributed population of mononuclear cells (Fig. 5B).
Fig. 5.
(A) Histologic appearance of the cellular xenograft at 7 days post surgery. The cellular xenograft (blue staining) appeared minimally degraded at 7 days post surgery. A dense population of both neutrophils and mononuclear cells were present in the operative site; however, there was minimal invasion of the cells into the cellular xenograft. (B) Histologic appearance of the cellular xenograft at 28 days post surgery. The cellular xenograft was no longer discernable at 28 days and was replaced with dense poorly organized collagenous connective tissue (dark blue staining, bracket), a small amount of adipose tissue (arrows), and a randomly distributed population of mononuclear cells. The red staining tissue bundles at the bottom of the image represent the underlying transversalis muscle (Masson's Trichrome, 200×).
The host response to the acellular xenogeneic urinary bladder ECM test article was characterized by a dense infiltration of both neutrophils and mononuclear cells that surrounded the implant and separated the individual layers of the multilaminate device at 3 days post surgery. Angiogenesis was prominent as early as 3 days post surgery and remained a prominent feature of the host response throughout the 28 day study period. Degradation of the acellular xenograft was most obvious at 7 and 14 days post surgery at which times there was a uniformly distributed population of mononuclear cells accompanied by neomatrix and a notable absence of neutrophils (Fig. 6A). By day 28, the implant was no longer visible and was replaced by organized host connective tissue. Fibroblasts, blood vessels, aligned collagen, and small islands of skeletal myoblasts were observed at the site of remodeling (Fig. 6B).
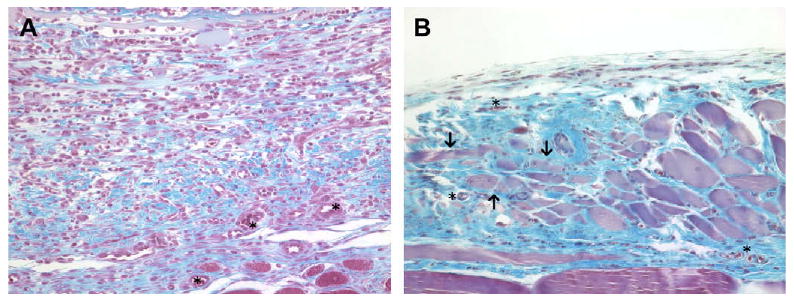
Fig. 6.
(A) Histologic appearance of the acellular xenograft at 7 days post surgery. A dense cellular infiltrate consisting of mostly mononuclear cells was seen surrounding and within (arrows) the layers of the acellular xenograft (blue staining, bracket) at 7 days post surgery. (B) Histologic appearance of the acellular xenograft at 28 days post surgery. The acellular xenograft was no longer discernable by 28 days post surgery and was replaced by fibroblasts, blood vessels (asterisks), aligned collagen and small islands of skeletal myoblasts (arrows). The red staining tissue bundles at the bottom of the image represent the underlying transversalis muscle (Masson's trichrome, 200×).
The temporal and spatial infiltration of host cells and the degradation of the scaffold material was very similar between the acellular allogeneic body wall ECM and the acellular xenogeneic urinary bladder ECM test groups.
3.2. Immunohistochemical findings
The results of the immunohistochemical evaluation showed that mononuclear macrophages (CD68+) were present in all four of the test article implantation sites at each of the time points investigated throughout the study period.
A quantitative analysis of the phenotype of the macrophages present in the remodeling cellular autograft showed that the polarized macrophages (those expressing either CCR7 or CD163) present in the remodeling cellular autograft were predominantly CCR7+ (M1) at 3, 7, 14, and 28 days post implantation (Fig. 7A). Conversely, the macrophages present in the remodeling acellular allograft were predominantly CD163+ (M2) at 3, 7, 14, and 28 days (Fig. 7B). The macrophages present in the remodeling cellular xenograft were observed to be predominantly CCR7+ at 3 and 7 days post implantation, with a mixed CCR7+/CD163+ population at 14 days, followed by a predominantly CCR7+ population thereafter (Fig. 7D). The macrophages present in the acellular xenograft were observed to be predominantly CD163+ at 3 days post surgery with a mixed CCR7+/CD163+ thereafter (Fig. 7E).
Fig. 7.
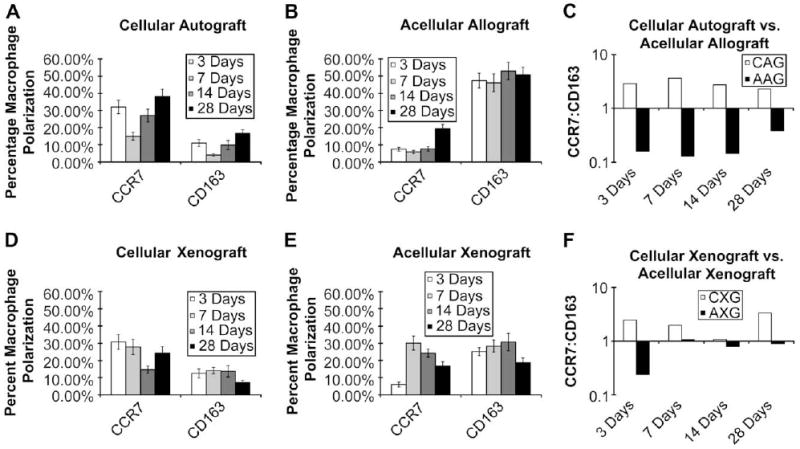
Percentage macrophage polarization at 3, 7, 14, and 28 days post implantation of cellular autograft (A), acellular allograft (B), cellular xenograft (D), or acellular xenograft (E). All values are presented as mean ± SEM. For percent of M1 cells, scaffold type and time were statistically significant (F = 2.93, P < 0.05 and F = 5.26, P < 0.003). For percent of M2 cells, scaffold type was statistically significant (F = 17.22, P < 0.0001). Ratio of the percentage of CCR7+:CD163+ macrophages present in the remodeling cellular autograft (CAG) and acellular allograft (AAG) (C) as well as the remodeling cellular xenograft (CXG) and acellular xenograft (AXG) (F) at 3, 7, 14, and 28 days post implantation. Values above 1.0 are indicative of an M1 type response while values less than 1.0 are indicative of an M2 type response.
It was observed that the patterns of macrophage polarization were similar for the cellular autograft and cellular xenograft test articles, which elicited a CCR7:CD163 ratio that was skewed towards the CCR7+ phenotype at most of the time points examined during the present study (Fig. 7C and F). In contrast, the acellular test articles elicited a CCR7:CD163 ratio that was skewed towards the CD163+ phenotype at most of the time points throughout the study period. Fig. 7 shows the phenotypic profile of the macrophages responding to each test article at each time point as well as the ratio of M1 to M2 cells in each test article.
No significant interactions between scaffold type and time point were found. For percent of M1 cells, both scaffold type and time were statistically significant (F = 2.93, P < 0.05 and F = 5.26, P < 0.003, respectively). For percent of M2 cells only scaffold type was found to be statistically significant (F = 17.22, P < 0.0001). For M1, there was a statistically significant difference between the mean at 7 and 14 days and the mean at 21 days; the mean for the acellular allogeneic body wall ECM was significantly different from the mean for autologous body wall tissue. For M2, all pairs of scaffold type means exhibited statistically significant differences with the exception of the cellular xenogeneic urinary bladder tissue versus the autologous body wall.
3.3. Gene expression analysis findings
Varying levels of iNOS (M1) and ARG (M2) gene expression were observed in all test articles throughout the course of the study. However, expression levels in the cellular test articles were higher than expression levels in the acellular test articles for both of the genes examined at all time points with the exception of the 3 day time point in the acellular allograft test article. The fold difference in gene expression between the cellular and acellular scaffolds ranged from 5.45 to 1904.91 depending on the time point and gene. Interestingly, it was observed that the fold increase in iNOS expression was larger than the fold increase in ARG expression in the cellular test articles at all time points. The fold difference in gene expression for the cellular and acellular test articles is presented in Table 3.
Table 3.
Fold increase in gene expression for cellular test articles compared to acellular test articles.
| Days | Cellular Autograft | Cellular Xenograft | ||
|---|---|---|---|---|
| iNOS | ARG | iNOS | ARG | |
| 3 | 0.790 | 0.430 | 17.876 | 12.383 |
| 7 | 18.210 | 4.867 | 36.577 | 12.177 |
| 14 | 1904.910 | 156.837 | 225.352 | 5.449 |
| 28 | 70.843 | 7.804 | 86.321 | 37.247 |
The expression of iNOS versus ARG was also compared in each individual sample. There was a mix of iNOS and ARG gene expression in the cellular autograft group, with a ratio of iNOS:ARG that was skewed towards iNOS expression at all time points with the exception of 14 days (Fig. 8A and C). A mix of iNOS and ARG gene expression was also observed in the acellular allograft group (Fig. 8B). However, in the acellular allograft group the ratio of iNOS:ARG was skewed towards ARG gene expression at all time points (Fig. 8C). Similarly, the cellular xenograft group exhibited mixed iNOS and ARG gene expression with a skewing of the iNOS:ARG ratio towards iNOS expression at 3, 7, and 14 days post surgery changing to ARG gene expression at day 28 while the acellular xenograft group exhibited a iNOS:ARG ratio that was skewed towards ARG gene expression at all of the time points investigated (Fig. 8D–F).
Fig. 8.
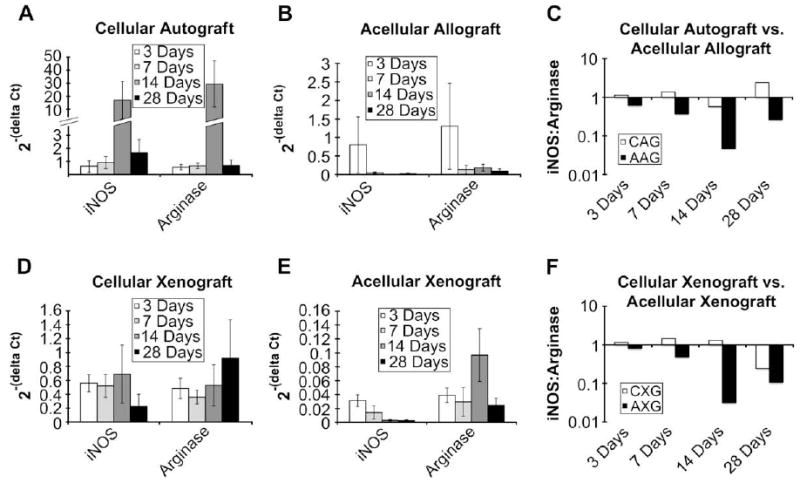
Gene expression relative to housekeeping gene at 3, 7, 14, and 28 days post implantation of cellular autograft (A), acellular allograft (B), cellular xenograft (D), acellular xenograft (E). All values are presented as mean ± SEM. For iNOS expression, scaffold type and time were statistically significant (F = 21.11, P < 0.0001 and F = 2.98, P < 0.05). For arginase expression, scaffold type was statistically significant (F = 44.33, P < 0.0001). Ratio of iNOS:arginase expression in the remodeling cellular autograft (CAG) and acellular allograft (AAG) (C) as well as the remodeling cellular xenograft (CXG) and acellular xenograft (AXG) (F) at 3, 7, 14, and 28 days post implantation. Values above 1.0 are indicative of a predominance of iNOS expression while values less than 1.0 are indicative of a predominance of arginase expression.
The gene expression profiles in both of the acellular test articles were similar with an increasing predominance of ARG expression from 3 to 14 days and a slight decrease at 28 days. Conversely, in the cellular test articles, the gene expression ratio was skewed towards the expression of iNOS at most of the time points investigated in this study. Fig. 8 shows the gene expression levels as well as the iNOS:ARG expression ratio in each of the test articles.
No significant interactions between scaffold type and time point were found. For M1 gene expression, both scaffold type and time were statistically significant (F = 2.98, P = <0.05 and F = 21.11, P = <0.0001, respectively). For M2 gene expression, only scaffold type was found to be statistically significant (F = 44.33, P < 0.0001). For M1, expression was found to be significantly higher at 28 days than at 3 days. For both iNOS and ARG, the expression in the cellular test articles was significantly higher than in the acellular test articles.
4. Discussion
The present study examined the effects of the presence of a cellular component within a scaffold derived from extracellular matrix upon the polarization of the macrophages participating in the host response following implantation. The study also examined the relationship between macrophage polarization and host tissue remodeling events until 28 days post implantation. The results of the study indicate that the presence of a cellular component within an ECM derived scaffold shifts the macrophage polarization profile to a predominantly M1, proinflammatory phenotype and is associated with a proinflammatory gene expression profile. Further, the results of this study show that macrophage polarization is indeed linked to tissue remodeling following implantation of a biologic scaffold.
The mechanisms by which mammals respond to whole organ transplantation are reasonably well understood. Immune recognition of xenogeneic and allogeneic cellular antigens occurs followed by the production of proinflammatory mediators, cytotoxicity and resultant organ rejection. The mechanisms of the host immune response to acellular biologic scaffolds composed of ECM, either allogeneic or xenogeneic, are neither as well studied nor as well understood. The preparation of an ECM scaffold for regenerative medicine applications involves decellularization of the tissue or organ from which the ECM is harvested [25]. The removal of cellular components produces a markedly different type of ‘tissue graft’ than is typically presented with autogenous, allogenous, or xenogeneic whole organ grafts.
An ECM scaffold consists primarily of the ECM constituent molecules, many of which are known to be highly conserved across species, thus mitigating many of the adverse components of the immune response [26,27]. Studies have, however, shown that both DNA fragments and, in the case of porcine derived ECM scaffolds, Galactosyl-a(1,3)galactose (Gal) epitope are present within ECM scaffolds following the decellularization process [28,29]. The amount of Gal epitope (a molecule known to cause hyper acute rejection in xenotransplants [30,31]) present within porcine derived ECM scaffolds was found to be insufficient to cause the activation of complement in human plasma [29]. Furthermore, despite the presence of these cellular components, many of which are well known for their ability to initiate a host inflammatory/immune response, ECM scaffolds have been shown to elicit constructive remodeling. The decellularization methods used to process ECM scaffolds may alter these molecules such that they can no longer negatively influence the host response or there may be a threshold amount required to alter the host response to an ECM scaffold [25].
In general, the host response following the implantation of an ECM scaffold that has not been chemically crosslinked or seeded with cells is characterized by an immediate and intense neutrophil and mononuclear cell infiltration followed by a shift to primarily mononuclear cells within 72 h [21,22]. Rapid degradation of the ECM scaffold is followed by replacement with organized, site appropriate functional host tissue [5,21,22,32]. Interestingly, although the host response involves a large infiltration of mononuclear cells [22], an event conventionally associated with inflammation, there is a lack of the usual cytotoxic mediators of inflammation and graft rejection, with resultant formation of a polarized type 2 T lymphocyte (Th2) response [26].
A number of studies have shown differences and, in some cases, improvements in tissue remodeling outcomes when a cellular component has been placed in contact with an ECM scaffold during or prior to implantation [6–8]. However, the effect of these cells upon the resultant host response remains an open question. A recent study investigated differences in the remodeling of ECM based bioscaffolds with and without cells in a primate model, finding that the presence of cellular content was associated with increased levels of proinflammatory cytokines, increased macrophage activation, and a poor remodeling outcome [33]. In the present study, it was observed that the presence of a cellular component, either xenogeneic or autologous, altered the host response towards an M1 phenotype compared to the predominantly M2 phenotype that was observed with an acellular ECM scaffold alone.
A recent study demonstrated that there were temporal and spatial distribution differences in the neutrophil and mononuclear cell populations that participate in the host response to an implanted ECM scaffold depending on the origin of the ECM as well as the methods used to process the scaffold, and that these differences were related to the downstream tissue remodeling outcome [22]. Further investigation of a subset of these same scaffold materials showed that test articles which were chemically crosslinked did not show any significant degradation during the study period following implantation, resulted in a predominantly M1 type macrophage response, and resulted in a host response that was characterized by chronic inflammation. Conversely, non-crosslinked test articles degraded rapidly following implantation, elicited an M2 type response, and resulted in constructive remodeling of the abdominal wall including organized collagenous connective tissue, islands of skeletal muscle, and blood vessels [34]. These results correlate well with the results of the present study in that a predominantly M1 macrophage response was associated with a more inflammatory type tissue remodeling outcome while a predominantly M2 macrophage response was associated with a more constructive tissue remodeling outcome. It is clear from these studies that the phenotype of mononuclear macrophages that participate in the host response to implanted biologic scaffold materials plays an important role in determining the extent of a constructive remodeling outcome versus destructive, scar tissue outcome.
There were several limitations in the present study. A limited number of surface markers were utilized for the characterization of the M1/M2 profile of the macrophages participating in the host response. The choice of markers was mainly due to the limited availability of antibodies specific for M1 and M2 markers in the rat model. It is also recognized that species variations do exist. The markers chosen for this study are known to be highly indicative of M1 or M2 polarization in multiple animal and human models. Multiple studies have shown that CCR7 is highly expressed on M1 polarized cells and that CD163 is highly indicative of M2 type anti-inflammatory polarization [14,35,36]. A limited number of gene expression markers were also used in this study. However, iNOS and arginase expression are widely viewed as markers of M1 and M2 polarization, respectively.
In the present study, a population of CD68+ macrophages was observed within the wound site, some of which did not stain positive for either M1 or M2 surface markers. These cells may have only just arrived at the site of remodeling and, thus, might not yet have been stimulated to undergo activation or polarization towards an M1 or M2 phenotype. Macrophages that have not yet been polarized towards an M1 or M2 phenotype would not express markers indicative of polarization. Therefore, it is logical to expect that the percentages of CCR7+ and CD163+ cells would not sum to 100%. Perhaps more importantly, it is presently not known what percentage of M1 or M2 cells is required to influence the formation of a scar tissue or constructive remodeling response, respectively (i.e. a threshold effect). It is hypothesized that the ratio of M1:M2 cells may be more important than the absolute number of cells. There is clearly a correlation of the M1:M2 ratio to remodeling outcome in the present study.
5. Conclusion
The present study showed that the presence of a cellular component within an extracellular matrix scaffold modulates the phenotype of the macrophages participating in the host response following implantation. It was observed that those test articles that contained a cellular component, even an autologous cellular component, elicited a predominantly M1 type macrophage response and resulted in the deposition of dense connective tissue and/or scarring. Those test articles that did not contain a cellular component, however, were observed to elicit a predominantly M2 type macrophage response and resulted in a more constructive type remodeling response.
Appendix
Figures with essential colour discrimination. Certain figures in this article, in particular Figs. 2–6, are difficult to interpret in black and white. The full colour images can be found in the on-line version, at doi:10.1016/j.biomaterials.2008.11.040.
References
- 1.Bissell MJ, Hall HG, Parry G. How does the extracellular matrix direct gene expression? J Theor Bio. 1982;99(1):31–68. doi: 10.1016/0022-5193(82)90388-5. [DOI] [PubMed] [Google Scholar]
- 2.Boudreau N, Myers C, Bissell MJ. From laminin to lamin: regulation of tissue-specific gene expression by the ECM. Trends Cell Biol. 1995;5(1):1–4. doi: 10.1016/s0962-8924(00)88924-2. [DOI] [PubMed] [Google Scholar]
- 3.Ingber D. Extracellular matrix and cell shape: potential control points for inhibition of angiogenesis. J Cell Biochem. 1991;47(3):236–41. doi: 10.1002/jcb.240470309. [DOI] [PubMed] [Google Scholar]
- 4.Badylak SF. The extracellular matrix as a biologic scaffold material. Biomaterials. 2007;28(25):3587–93. doi: 10.1016/j.biomaterials.2007.04.043. [DOI] [PubMed] [Google Scholar]
- 5.Badylak SF. Xenogeneic extracellular matrix as a scaffold for tissue reconstruction. Transpl Immunol. 2004;12(3–4):367–77. doi: 10.1016/j.trim.2003.12.016. [DOI] [PubMed] [Google Scholar]
- 6.Badylak S, Meurling S, Chen M, Spievack A, Simmons-Byrd A. Resorbable bioscaffold for esophageal repair in a dog model. J Pediatr Surg. 2000;35(7):1097–103. doi: 10.1053/jpsu.2000.7834. [DOI] [PubMed] [Google Scholar]
- 7.Badylak SF, Vorp DA, Spievack AR, Simmons-Byrd A, Hanke J, Freytes DO, et al. Esophageal reconstruction with ECM and muscle tissue in a dog model. J Surg Res. 2005;128(1):87–97. doi: 10.1016/j.jss.2005.03.002. [DOI] [PubMed] [Google Scholar]
- 8.Yoo JJ, Meng J, Oberpenning F, Atala A. Bladder augmentation using allogenic bladder submucosa seeded with cells. Urology. 1998;51(2):221–5. doi: 10.1016/s0090-4295(97)00644-4. [DOI] [PubMed] [Google Scholar]
- 9.Mills CD, Kincaid K, Alt JM, Heilman MJ, Hill AM. M-1/M-2 macrophages and the Th1/Th2 paradigm. J Immunol. 2000;164(12):6166–73. doi: 10.4049/jimmunol.164.12.6166. [DOI] [PubMed] [Google Scholar]
- 10.Gordon S, Taylor PR. Monocyte and macrophage heterogeneity. Nat Rev Immunol. 2005;5(12):953–64. doi: 10.1038/nri1733. [DOI] [PubMed] [Google Scholar]
- 11.Mantovani A, Sozzani S, Locati M, Allavena P, Sica A. Macrophage polarization: tumor-associated macrophages as a paradigm for polarized M2 mononuclear phagocytes. Trends Immunol. 2002;23(11):549–55. doi: 10.1016/s1471-4906(02)02302-5. [DOI] [PubMed] [Google Scholar]
- 12.Mosser DM. The many faces of macrophage activation. J Leukoc Biol. 2003;73(2):209–12. doi: 10.1189/jlb.0602325. [DOI] [PubMed] [Google Scholar]
- 13.Verreck FA, de Boer T, Langenberg DM, van der Zanden L, Ottenhoff TH. Phenotypic and functional profiling of human proinflammatory type-1 and anti-inflammatory type-2 macrophages in response to microbial antigens and IFN-gamma- and CD40L-mediated costimulation. J Leukoc Biol. 2006;79(2):285–93. doi: 10.1189/jlb.0105015. [DOI] [PubMed] [Google Scholar]
- 14.Mantovani A, Sica A, Sozzani S, Allavena P, Vecchi A, Locati M. The chemokine system in diverse forms of macrophage activation and polarization. Trends Immunol. 2004;25(12):677–86. doi: 10.1016/j.it.2004.09.015. [DOI] [PubMed] [Google Scholar]
- 15.Mantovani A, Sica A, Locati M. Macrophage polarization comes of age. Immunity. 2005;23(4):344–6. doi: 10.1016/j.immuni.2005.10.001. [DOI] [PubMed] [Google Scholar]
- 16.Porcheray F, Viaud S, Rimaniol AC, Leone C, Samah B, Dereuddre-Bosquet N, et al. Macrophage activation switching: an asset for the resolution of inflammation. Clin Exp Immunol. 2005;142(3):481–9. doi: 10.1111/j.1365-2249.2005.02934.x. [DOI] [PMC free article] [PubMed] [Google Scholar]
- 17.Stout RD, Jiang C, Matta B, Tietzel I, Watkins SK, Suttles J. Macrophages sequentially change their functional phenotype in response to changes in microenvironmental influences. J Immunol. 2005;175(1):342–9. doi: 10.4049/jimmunol.175.1.342. [DOI] [PubMed] [Google Scholar]
- 18.Stout RD, Suttles J. Immunosenescence and macrophage functional plasticity: dysregulation of macrophage function by age-associated microenvironmental changes. Immunol Rev. 2005;205:60–71. doi: 10.1111/j.0105-2896.2005.00260.x. [DOI] [PMC free article] [PubMed] [Google Scholar]
- 19.Brown B, Lindberg K, Reing J, Stolz DB, Badylak SF. The basement membrane component of biologic scaffolds derived from extracellular matrix. Tissue Eng. 2006;12(3):519–26. doi: 10.1089/ten.2006.12.519. [DOI] [PubMed] [Google Scholar]
- 20.Freytes DO, Badylak SF, Webster TJ, Geddes LA, Rundell AE. Biaxial strength of multilaminated extracellular matrix scaffolds. Biomaterials. 2004;25(12):2353–61. doi: 10.1016/j.biomaterials.2003.09.015. [DOI] [PubMed] [Google Scholar]
- 21.Badylak S, Kokini K, Tullius B, Simmons-Byrd A, Morff R. Morphologic study of small intestinal submucosa as a body wall repair device. J Surg Res. 2002;103(2):190–202. doi: 10.1006/jsre.2001.6349. [DOI] [PubMed] [Google Scholar]
- 22.Valentin JE, Badylak JS, McCabe GP, Badylak SF. Extracellular matrix bioscaffolds for orthopaedic applications. A comparative histologic study. J Bone Joint Surg Am. 2006;88(12):2673–86. doi: 10.2106/JBJS.E.01008. [DOI] [PubMed] [Google Scholar]
- 23.Schmittgen TD, Livak KJ. Analyzing real-time PCR data by the comparative C(T) method. Nat Protoc. 2008;3(6):1101–8. doi: 10.1038/nprot.2008.73. [DOI] [PubMed] [Google Scholar]
- 24.Livak KJ, Schmittgen TD. Analysis of relative gene expression data using real-time quantitative PCR and the 2(-Delta Delta C(T)) Method. Methods. 2001;25(4):402–8. doi: 10.1006/meth.2001.1262. [DOI] [PubMed] [Google Scholar]
- 25.Gilbert TW, Sellaro TL, Badylak SF. Decellularization of tissues and organs. Biomaterials. 2006;27(19):3675–83. doi: 10.1016/j.biomaterials.2006.02.014. [DOI] [PubMed] [Google Scholar]
- 26.Allman AJ, McPherson TB, Badylak SF, Merrill LC, Kallakury B, Sheehan C, et al. Xenogeneic extracellular matrix grafts elicit a TH2-restricted immune response. Transplantation. 2001;71(11):1631–40. doi: 10.1097/00007890-200106150-00024. [DOI] [PubMed] [Google Scholar]
- 27.van der Rest M, Garrone R. Collagen family of proteins. FASEB J. 1991;5(13):2814–23. [PubMed] [Google Scholar]
- 28.Gilbert TW, Freund JM, Badylak SF. Quantification of DNA in biologic scaffold materials. Tissue Eng. 2007;13(6):1313–23. doi: 10.1016/j.jss.2008.02.013. [DOI] [PMC free article] [PubMed] [Google Scholar]
- 29.McPherson TB, Liang H, Record RD, Badylak SF. Galalpha(1,3)Gal epitope in porcine small intestinal submucosa. Tissue Eng. 2000;6(3):233–9. doi: 10.1089/10763270050044416. [DOI] [PubMed] [Google Scholar]
- 30.Galili U. The alpha-gal epitope (Gal alpha 1-3Gal beta 1-4GlcNAc-R) in xenotransplantation. Biochimie. 2001;83(7):557–63. doi: 10.1016/s0300-9084(01)01294-9. [DOI] [PubMed] [Google Scholar]
- 31.Parker W, Stitzenberg KB, Yu PB, Pratt VS, Nakamura YC, Farel LS, et al. Biophysical characteristics of anti-Gal(alpha)1-3Gal IgM binding to cell surfaces: implications for xenotransplantation. Transplantation. 2001;71(3):440–6. doi: 10.1097/00007890-200102150-00018. [DOI] [PubMed] [Google Scholar]
- 32.Gilbert TW, Stewart-Akers AM, Badylak SF. A quantitative method for evaluating the degradation of biologic scaffold materials. Biomaterials. 2007;28(2):147–50. doi: 10.1016/j.biomaterials.2006.08.022. [DOI] [PubMed] [Google Scholar]
- 33.Xu H, Wan H, Sandor M, Qi S, Ervin F, Harper JR, et al. Host response to human acellular dermal matrix transplantation in a primate model of abdominal wall repair. Tissue Eng Part A. 2008;14(12):2009–201. doi: 10.1089/ten.tea.2007.0316. [DOI] [PubMed] [Google Scholar]
- 34.Badylak SF, Valentin JE, Ravindra AK, McCabe GP, Stewart-Akers AM. Macrophage phenotype as a determinant of biologic scaffold remodeling. Tissue Eng Part A. 2008;14(11):1835–42. doi: 10.1089/ten.tea.2007.0264. [DOI] [PubMed] [Google Scholar]
- 35.Martinez FO, Gordon S, Locati M, Mantovani A. Transcriptional profiling of the human monocyte-to-macrophage differentiation and polarization: new molecules and patterns of gene expression. J Immunol. 2006;177(10):7303–11. doi: 10.4049/jimmunol.177.10.7303. [DOI] [PubMed] [Google Scholar]
- 36.Moestrup SK, Møller HJ. CD163: a regulated hemoglobin scavenger receptor with a role in the anti-inflammatory response. Ann Med. 2004;36(5):347–54. doi: 10.1080/07853890410033171. [DOI] [PubMed] [Google Scholar]