
Fig. 2.
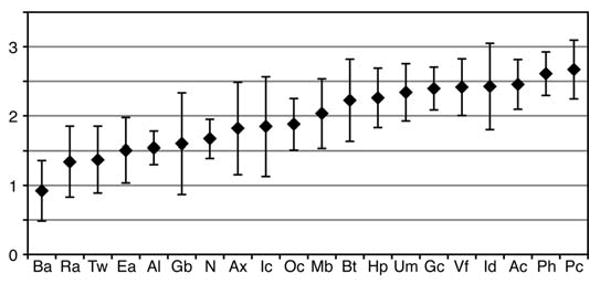
Median diversity of sites as measured by the Shannon Diversity Index. Error bars represent median absolute deviation. See fig. S1 for key to site codes displayed on the x axis.
Official websites use .gov
A
.gov website belongs to an official
government organization in the United States.
Secure .gov websites use HTTPS
A lock (
) or https:// means you've safely
connected to the .gov website. Share sensitive
information only on official, secure websites.
Median diversity of sites as measured by the Shannon Diversity Index. Error bars represent median absolute deviation. See fig. S1 for key to site codes displayed on the x axis.