Abstract
Background and Objective
In a recently completed pilot clinical study at Roswell Park Cancer Institute, patients with superficial basal cell carcinoma (sBCC) received topical application of 20% 5-aminolevulinic acid (ALA) and were irradiated with 633 nm light at 10–150 mW cm−2. Protoporphyrin IX (PpIX) photobleaching in the lesion and the adjacent perilesion normal margin was monitored by fluorescence spectroscopy. In most cases, the rate of bleaching slowed as treatment progressed, leaving a fraction of the PpIX unbleached despite sustained irradiation. To account for this feature, we hypothesized a decrease in blood flow during ALA-photodynamic therapy (PDT) that reduced the rate of oxygen transported to the tissue and therefore attenuated the photobleaching process. We have performed a detailed analysis of this hypothesis.
Study Design/Materials and Methods
We used a comprehensive, previously published mathematical model to simulate the effects of therapy-induced blood flow reduction on the measured PpIX photobleaching. This mathematical model of PDT in vivo incorporates a singlet-oxygen-mediated photobleaching mechanism, dynamic unloading of oxygen from hemoglobin, and provides for blood flow velocity changes. It permits simulation of the in vivo photobleaching of PpIX in this patient population over the full range of irradiances and fluences.
Results
The results suggest that the physiological equivalent of discrete blood flow reductions is necessary to simulate successfully the features of the bleaching data over the entire treatment fluence regime. Furthermore, the magnitude of the blood flow changes in the normal tissue margin and lesion for a wide range of irradiances is consistent with a nitric-oxide-mediated mechanism of vasoconstriction.
Conclusion
A detailed numerical study using a comprehensive PDT dosimetry model is consistent with the hypothesis that the observed trends in the in vivo PpIX photobleaching data from patients may be explained on the basis of therapy-induced blood flow reductions at specific fluences.
Keywords: photodynamic therapy, skin cancer, fluorescence spectroscopy, protoporphyrin IX
INTRODUCTION
Photodynamic therapy (PDT) combines photosensitizer, light, and oxygen (3O2) to produce singlet oxygen (1O2), which is understood to be the primary photochemical mediator of cell injury and death. In 5-aminolevulinic acid (ALA)-PDT, the pro-drug ALA is converted into the photosensitizer protoporphyrin IX (PpIX) through the heme biosynthetic pathway. Topically administered ALA-PDT is particularly effective in treating skin cancer because of its rapid clearance, tumor selectivity, and easy delivery. This therapy has received approval for the treatment of superficial basal cell carcinoma (sBCC) in the European Union and is undergoing clinical trials in the United States [1].
Acute pain during irradiation is the primary adverse side effect of clinical ALA-PDT [2,3]. A recently completed clinical trial of ALA-PDT for sBCC at Roswell Park Cancer Institute investigated the treatment-induced pain and PpIX photobleaching kinetics over a wide range (10–150 mW cm−2) of irradiances administered at 633 nm [4]. PpIX photobleaching in the lesion and the adjacent perilesion normal margin was monitored by fluorescence spectroscopy. In most cases, the rate of bleaching slowed as treatment progressed, leaving a fraction of the PpIX unbleached despite sustained irradiation.
To account for this observation, we hypothesized a possible decrease of blood flow during ALA-PDT, which reduces the rate of oxygen transported to the tissue and therefore slows down the photobleaching process. Although we are not aware of any experiments to date that have investigated blood flow during ALA-PDT in human subjects, several clinical and preclinical studies have demonstrated a decrease [5,6] or increase [7,8] in tumor blood flow following PDT. This therapy-induced blood flow change is likely due to the vascular effects mediated by the treatment, such as direct damage to the tumor vasculature [9] and/or vasoconstriction/vasodilatation induced by decrease/increase in the production of nitric oxide (NO) [10], other vasoactive substances, or by edema [8]. To test this hypothesis, we used a recently developed, comprehensive mathematical model of PDT in vivo [11] to simulate the measured irradiation-induced PpIX photobleaching. This model incorporates all of the relevant photophysical and physiological phenomena, including a 1O2-mediated photobleaching mechanism, blood flow, and dynamic unloading of oxygen from hemoglobin. Solutions to time-dependent oxygen transport-with-reaction equations that include these phenomena enable the rigorous simulation of macroscopic observable quantities, such as photobleaching, which can be directly compared to experiments. Using this model, we simulate the in vivo photobleaching of PpIX in this patient population over a wide range of irradiances with a narrow distribution of photophysical parameters related to a 1O2-mediated bleaching mechanism. Our numerical results indicate that the in vivo PpIX photobleaching data over the entire fluence regime may be successfully captured by introducing the physiological equivalent of discrete, therapy-induced blood flow reductions at specific fluences.
METHODS
Clinical Trial and Photobleaching Measurements
The details of the clinical trial at Roswell Park Cancer Institute and the PpIX fluorescence measurements from human sBCC have been reported elsewhere [4] and are described briefly here. Thirty-three sBCC in 26 patients were included in the trial. The lesion size ranged from 5–20 mm in diameter. Twenty percent ALA (DUSA Pharmaceuticals, Inc., Wilmington, MA) was applied to the entire treatment field. After a 4 h drug incubation, the skin was treated with 633 nm laser light at irradiances of 10, 20, 40, 50, 60, or 150 mW cm−2. A custom PDT treatment and spectroscopy probe was positioned 80 mm from the surface of the tissue using a tripod base [4,12]. PpIX fluorescence at each fluence rate was excited by the 633 nm treatment laser and measured without interruption of treatment repeatedly throughout PDT using a portable system that integrated PDT delivery and spectroscopy [12]. The treatment field diameter of 25 mm included the lesion and perilesion margin of normal tissue. Fluorescence within the range 665–770 nm was measured at two, 4 mm-diameter spots, one located in the lesion and the other in the perilesion margin, until the PpIX amplitude was bleached to ~10% of its pretreatment level. The fluorescence spectra were corrected for the instrument response and possible effects of tissue optical properties. The latter was done by dividing the measured fluorescence with broad band reflectance measurements acquired in the same geometry during brief, programmed interruptions in laser irradiation. A singular value decomposition (SVD) fitting algorithm was used to extract the contribution of PpIX fluorescence from the measured fluorescence spectra. Monte Carlo simulations of fluorescence photons reaching our detector showed that approximately half of the detected signal originated between the surface and a depth of 0.7 mm, and 80% of the fluorescence signal originated within 1.3 mm of the surface [13].
In Vivo PDT Oxygen Transport and Consumption Model
The PDT oxygen consumption and transport model has been described in detail previously [11]. Briefly, two finite-length cylindrical capillaries are separated by a specified intercapillary distance. Each capillary is the oxygen source to the surrounding tumor tissue. As blood flows along the capillary, 3O2 is transported within the capillary and into the adjacent tissue in both radial, r, and axial, z, directions. Sensitizer is distributed in the tissue region, and reacted 1O2 is accumulated. This model has the ability to incorporate initially non-uniform sensitizer distributions. However, because no data are available on the microscopic distribution of PpIX in human sBCC, the initial sensitizer concentration is assumed to be homogeneous throughout the tissue region. Based on the above transport considerations and the Hill equation,
| (1) |
where SO2 is the hemoglobin 3O2 saturation, Ccap the 3O2 concentration dissolved in the vessel, n the Hill coefficient, and C50 the 3O2 concentration dissolved in the vessel corresponding to an SO2 of 0.5, the time-dependent PDT-3O2 transport-with-reaction equations within the capillary and tissue can by derived from mass conservation. The equation in the capillary is written
| (2) |
where
| (3) |
and the equation in tissue is
| (4) |
Here, Ctiss is the 3O2 concentration in the tissue, t is time, V the blood flow velocity, Csat the maximum saturated concentration of 3O2 bound to hemoglobin, and Rc and b are the capillary radius and half the distance between two adjacent capillaries, respectively. Γ is the sum of the metabolic, Γmet, and photodynamic, ΓPDT, rates of 3O2 consumption. Michaelis–Menten kinetics [14] are used to describe the 3O2 dependence of metabolic 3O2 consumption. The specific form of ΓPDT used in this study incorporates the self-sensitized 1O2-mediated bleaching mechanism developed by Georgakoudi et al. [15] and a low photosensitizer concentration correction proposed by Finlay [16] and by Dysart et al. [17]. The photobleaching of PpIX has been shown to be consistent with this mechanism [18–20]. The expression for ΓPDT is written
| (5) |
where
| (6) |
and Γ0 = βPDTψ. Γ0 is the initial, maximal rate of photochemical 3O2 consumption prior to photobleaching under conditions where 3O2 is not rate limiting, [S0](0) is the initial ground-state photosensitizer concentration prior to irradiation, βPDT is the proportionality constant between Γ0 and fluence rate ψ. The time integration of Equation (5) for a given irradiation period yields the corresponding photodynamic dose, defined as the local amount of reacted 1O2 per unit volume of tissue.
The definitions of the parameters used in the model are given in the Nomenclature. The two diffusion equations for the capillary (Eq. 2) and the tissue regions (Eq. 4) are solved numerically using a finite difference method, subject to the previously described boundary and initial conditions [11]. Solutions to the coupled PDT oxygen consumption and transport equations (Eqs. 2 and 4) for a given treatment condition yield the time-evolved microscopic distributions of 3O2, 1O2, and PpIX concentration. The volume-averaged, experimentally observable quantities such as photobleaching can be calculated from the microscopic distribution of PpIX concentration in the tissue region. Tables 1 and 2 list the photophysical and physiological parameters specific to this study. The values and origins of other model parameters have been previously described [11].
TABLE 1.
Photophysical and Physiological Parameters Used in the Simulations
TABLE 2.
Calculated βPDT for Each Irradiance
| βPDT (μM second−1 mW−1 cm2)* |
||
|---|---|---|
| Irradiance (mW cm−2) | Lesion | Margin |
| 150 | 0.85 | 0.4 |
| 60 | 0.65 | 0.85 |
| 50 | 0.85 | 0.85 |
| 40 | 0.6 | 1 |
| 20 | 1.2 | 1.45 |
| 10 | 1.05 | 0.9 |
The value of βPDT used for generating the bleaching curves for each irradiance case for both lesion and normal tissue margin, respectively. The average value with SD of βPDT from all the cases is 0.89 ± 0.28.
Determination of βPDT and Fitting Procedures
With the exception of βPDT for PpIX in human sBCC, the other parameters required in the simulation can be found either in the literature or our previous report [11]. To determine the value of βPDT, we fit the computed volume-averaged PpIX bleaching to the measured initial bleaching data at each irradiance, with the assumption that the blood flow is not significantly perturbed at the earliest fluences. We then determine the βPDT which gives the minimum reduced Chi-square ( ) fit to the data, and use this value (Table 2) along with other experimentally determined parameters (Table 1) to simulate the rest of the bleaching data, which requires incorporation of treatment-induced blood flow reductions.
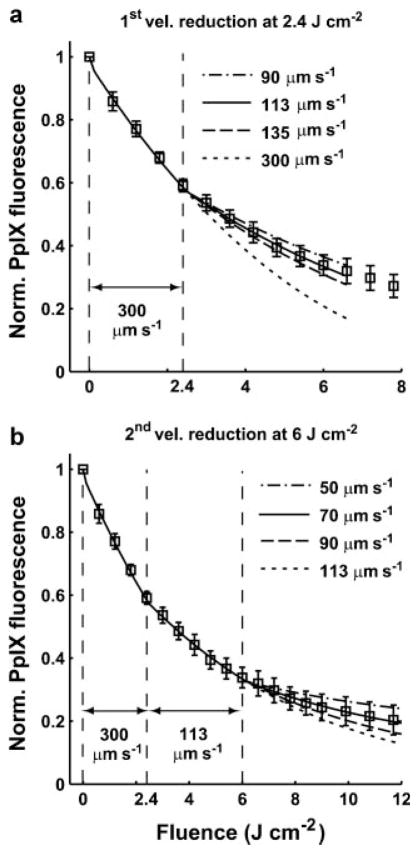
Blood flow is a product of vessel cross-section and blood velocity. For technical reasons originating in the details of the numerical method [11], in this study we fixed the vessel cross-section as a constant, so we can simulate treatment-induced blood flow changes by simply varying the value of the blood velocity. From the standpoint of oxygen transport to the tissue volume, reduction in flow velocity is equivalent to a smaller vessel diameter. To fit the experimentally determined bleaching curves over the entire range of treatment fluences, we use the mathematical model with a consistent set of parameters (Table 1) and the best-fit βPDT values for each irradiance case (Table 2) to simulate the bleaching curves by changing the blood velocity at specific fluences. Figure 1 shows the standard procedure of the fitting process; here the bleaching data were measured from lesion regions irradiated at 60 mW cm−2. Initially, a simulated bleaching curve with an initial blood velocity of 300 μm second−1 [5] is generated by the mathematical model, and this curve is used to determine the fluence at which a first velocity change is initiated (Fig. 1a). This fluence is determined visually at the point where the simulated bleaching curve deviates from the experimental data. Once this fluence is determined, we reduce the velocity systematically at this fluence and rerun the simulations, using the minimum in calculated within a proper fluence range, 0–6.6 J cm−2 in the case of Figure 1a, to identify the velocity value which provides the best-fit to the measured bleaching curve. After determining the value of the first velocity reduction at the appropriate fluence, we run the simulations with this new velocity until the simulated bleaching curve again deviates from the experimental data. We then reduce the velocity again and use the criterion as described above to obtain the best second reduced velocity (Fig. 1b). For the case of 60 mW cm−2 lesion (Fig. 1b), the second reduced velocity is also the last changed velocity for the entire data set optimally fit by the simulated bleaching curve. Therefore, the full range of fluences is used for the calculation.
Fig. 1.
Fitting process for an averaged ± SD, normalized PpIX photobleaching curve for an irradiance of 60 mW cm−2 and sBCC lesions. The data were measured from five lesions. a: The simulated bleaching curves with a constant initial velocity 300 μm second−1 and 1st blood velocity reduction at 2.4 J cm−2. b: Simulated bleaching curves with a single reduced velocity of 113 μm second−1 at 2.4 J cm−2 and a 2nd blood velocity reduction at 6 J cm−2. The best-fit parameters for this bleaching curve are 113 and 70 μm second−1 at 2.4 and 6 J cm−2, respectively.
RESULTS
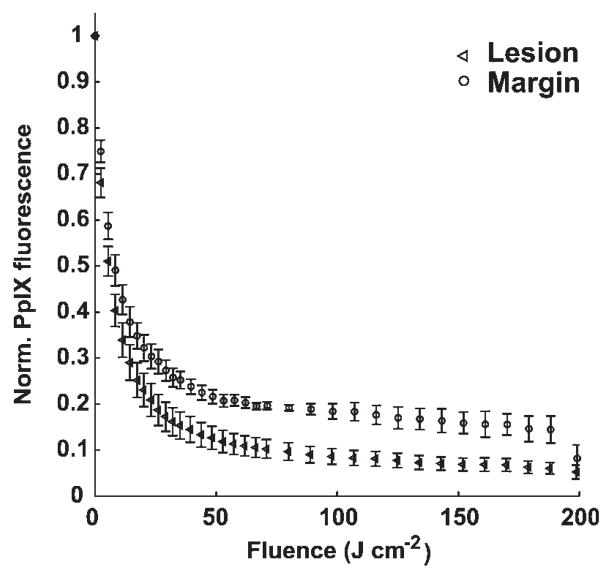
Figure 2 shows averaged ± standard deviation (SD), normalized PpIX fluorescence from seven lesions versus fluence for an irradiance of 150 mW cm−2, measured in the lesion and normal tissue margin. We observe that the sensitizer quickly degrades to 20% of its initial value after fluences of 23 and 53 J cm−2 delivered to the lesion and margin regions, respectively, and the bleaching curves flatten at high fluences. This phenomenon is not consistent with a continuously available supply of oxygen.
Fig. 2.
Averaged ± SD, normalized PpIX fluorescence from seven lesions versus fluence for an irradiance of 150 mW cm−2, measured in the lesion and normal tissue margin.
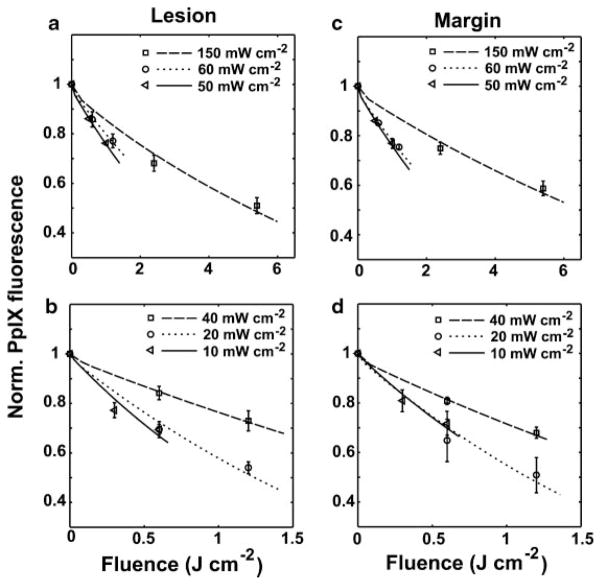
Figure 3 shows the best fits to PpIX photobleaching data at early fluences for lesion (a and b) and normal tissue margin (c and d). Results for irradiances in the range 50–150 mW cm−2 and 10–40 mW cm−2 are shown in Fig. 3(a and c) and (b and d), respectively. The averaged ± SD, normalized PpIX bleaching data for the different irradiances are represented by symbols. The various line styles are the simulated best-fit bleaching curves for these irradiances at these initial fluences. As described in the Methods Section, we extract the photophysical parameter βPDT (Table 2) for each case through these fits. The average best-fit value (+/−) SD of βPDT from all the cases is 0.89 ± 0.28. Figure 3a–d also demonstrates that the mathematical model incorporating a 1O2-mediated bleaching mechanism is able to simulate the clinical bleaching data at early fluences over a wide irradiance range.
Fig. 3.
Simulations of PpIX photobleaching compared to experimental data at early fluences for lesion and normal tissue margin. a,b: Cases of 50–150 and 10–40 mW cm−2 for lesion, respectively, and (c) and (d) are the cases for normal tissue margin. The averaged ± SD, normalized PpIX bleaching data for different irradiances are represented by symbols. The various line styles are the simulated best-fit bleaching curves for these irradiances at these initial fluences. All of the simulated curves are produced using a set of photophysical parameters related to a 1O2-mediated bleaching mechanism.
Returning to Figure 1, which was introduced in the Methods Section, we present a representative example of fitting PpIX bleaching data within the entire fluence range by introducing the blood velocity reductions at specific fluences into the mathematical model (Eq. 2). The bleaching data shown in Figure 1 were measured from five lesion regions irradiated at 60 mW cm−2. Figure 1a,b shows the simulated bleaching curves with the first and second blood flow velocity reduction at 2.4 and 6 J cm−2, respectively. Figure 1a shows that the simulated bleaching curve with a constant blood velocity of 300 μm second−1 does not reproduce the experimental data after 2.4 J cm−2. Simulation results generated with blood velocity reductions initiated at 2.4 J cm−2 over the range 90–135 μm second−1 are shown. A reduction to 113 μm second−1 gave the best fit using a criterion within the fluence range between 0 and 6.6 J cm−2. However, in order to obtain a reasonable fit to the entire bleaching curve, we need to introduce a second velocity reduction. Figure 1b shows that the simulated bleaching curve with a first velocity reduction to 113 μm second−1 at 2.4 J cm−2 starts to depart from the data after a fluence of 6 J cm−2. We then reduce the velocity again at 6 J cm−2 over the range 50–90 μm second−1 and identify the best-fit value as 70 μm second−1. By reducing the velocity twice in this way, we are able to obtain an excellent fit for the entire bleaching curve (Fig. 1b).
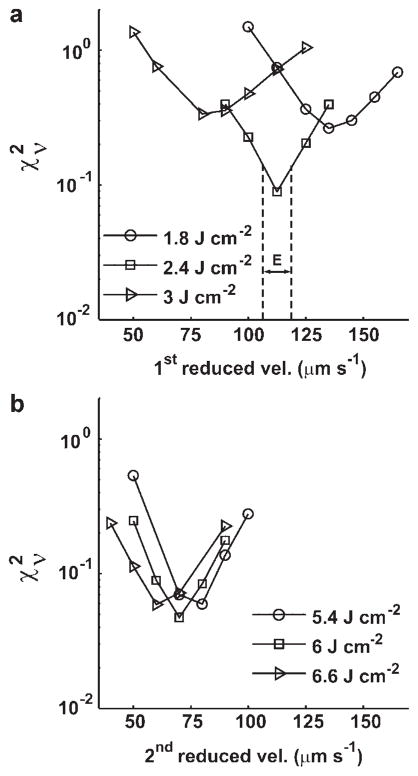
To rigorously evaluate our fitting methodology, we calculated the of the fit as a function of the reduced blood flow velocity and selected fluence, using the representative case of a lesion treated at 60 mW cm−2 as an example. Figure 4 shows the versus the first reduced velocity initiated at 1.8, 2.4, and 3 J cm−2 (Fig. 4a) and the second reduced velocity implemented at 5.4, 6, and 6.6 J cm−2 (Fig. 4b). The in Figure 4a is computed from fits to the measured PpIX fluorescence over the range of fluences from 0 to 6.6 J cm−2. We find the minimum in is located at 113 μm second−1 for the fluence of 2.4 J cm−2, and the goodness-of-fit is indeed quite sensitive to the choice of fluence at which the flow reduction is introduced (Fig. 4a). In contrast to the results of Figure 4a, for the second velocity reduction, the calculated over the entire fluence range is not as sensitive to the choice of fluence (Fig. 4b). We also notice that the minima of these three curves are all close to 70 μm second−1 (Fig. 4b). Therefore, for the case of the second velocity change, the value of the revised velocity is more important for the fit than is the fluence at which it is implemented. To estimate the uncertainties in these minima in we introduce a width E (μm second−1), illustrated in Figure 4a, which defines half the velocity range between the minimum in and the nearest, symmetrically positioned sampled velocities. Thus, for the case of 2.4 J cm−2 depicted in Figure 4a, the best-fit reduced velocity value with this measure of uncertainty is 113 ± 6 (μm second−1). This criterion was applied for all the cases modeled in this study.
Fig. 4.
a: The reduced Chi-square ( ) versus 1st reduced velocity at 1.8, 2.4, and 3 J cm−2 and (b) 2nd reduced velocity at 5.4, 6, and 6.6 J cm−2 for the case of a lesion treated at 60 mW cm−2. For the 1st blood velocity reduction (a), the goodness-of-fit is sensitive to fluence, but for the 2nd decrease (b), the goodness-of-fit is more sensitive to the choice of the value of the reduced velocity. The width E (μm second−1) is a measure of the uncertainty in the best fit reduced blood flow velocity and is defined as half the distance in velocity between the minimum in and the nearest, symmetrically positioned sampled velocities.
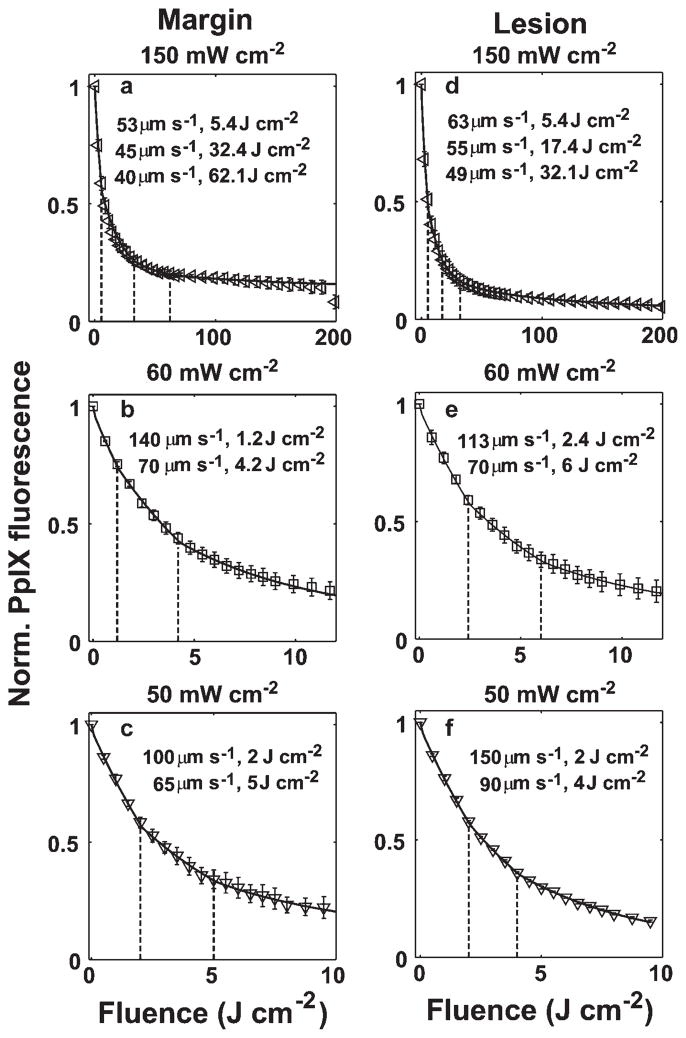
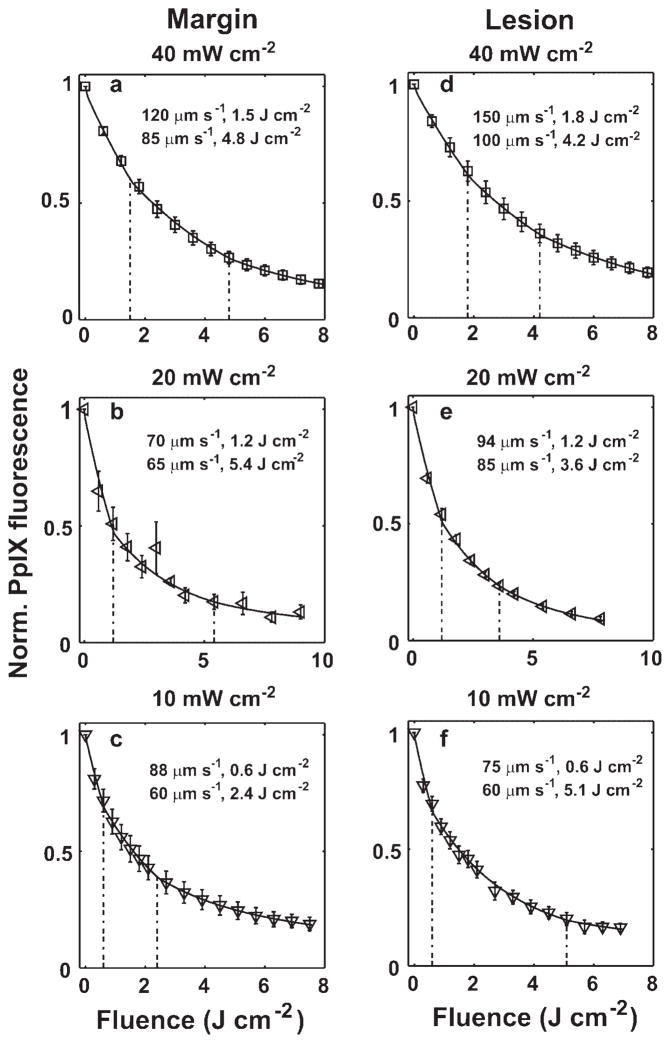
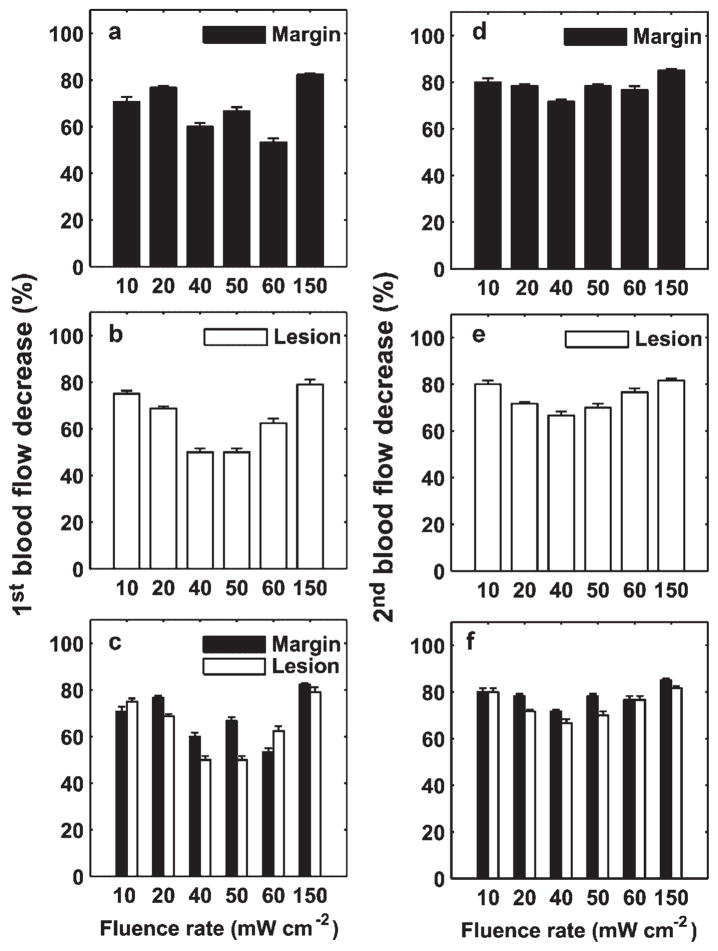
Figures 5 and 6 show the best fits of our simulations (solid lines) to the PpIX bleaching data measured in margin and lesion for irradiances of 50–150 and 10–40 mW cm−2, respectively. The dashed vertical lines indicate the fluences at which we initiated a velocity change. The figure legends report the reduced velocities and the specific fluences at which they were necessary. All the bleaching data are fit using a common set of photophysical parameters (Tables 1 and 2) related to a 1O2-mediated bleaching mechanism, and incorporating blood velocity reductions at specific fluences. Except for the 150 mW cm−2 lesion and margin cases, where three reductions in flow velocity were needed in order to optimize the fits, all the other bleaching data over the entire range of treatment fluences can be fit by invoking two velocity reductions. To more quantitatively explore the extent of the blood flow changes during ALA-PDT of human sBCC, we plot the percentage of first (Fig. 7a–c) and second (Fig. 7d–f) blood flow decrease with respect to the initial value versus fluence rate for the lesion and margin regions. The error bars indicate the uncertainties in the estimates of the percentage blood flow decrease, which were calculated using the criterion introduced in Figure 4a. Figure 7a,b,d,e shows that the extent of blood flow reduction decreases with increased irradiance from 10 to 40 or 60 mW cm−2, and then begins to increase up to 150 mW cm−2. The percentage of blood flow decrease is more than 50% and 65% for the 1st and 2nd change, respectively, for all the cases we considered (Fig. 7a,b,d,e). Figure 7c,f compares the percentage of blood flow decrease between margin and lesion for 1st and 2nd blood flow change, respectively. We find the flow reduction is greatest at 150 mW cm−2 for both margin and lesion, and for most irradiance cases, the percentage of blood flow decrease is higher at margin than lesion.
Fig. 5.
Simulations of bleaching curves measured in margin (a–c) and lesion (d–f) for irradiances of 50–150 mW cm−2. The dashed vertical lines indicate the fluences at which blood velocity changes were initiated. The figure legend shows the reduced velocity at selected fluences. The initial blood velocity was 300 μm second−1.
Fig. 6.
Simulations of bleaching curves measured in margin (a–c) and lesion (d–f) for irradiances of 10–40 mW cm−2. The dashed vertical lines indicate the fluences at which blood velocity changes were initiated. The figure legend shows the reduced velocity at selected fluences. The initial blood velocity was 300 μm second−1.
Fig. 7.
Percentage of 1st (a–c) and 2nd (d–f) blood flow decrease relative to the initial value versus fluence rate for lesion and margin regions. The error bars indicate the uncertainties in the estimate of the percentage blood flow decrease, calculated using the criterion introduced in Figure 4a. Generally, the blood flow reduction decreases with an increase of irradiance from 10 to 40 or 60 mW cm−2, and then begins to increase up to 150 mW cm−2 (a,b) and (d,e). In most cases, the percentage of flow decrease is larger in the margin than in the lesion (c,f).
DISCUSSION
Several other mathematical models have been proposed to describe oxygen transport and 1O2 dose deposition during PDT in vivo [21–23]. To the best of our knowledge, the model used in this study is the most comprehensive form developed so far in that it includes important dynamic photophysical and physiological phenomena, such as the 1O2-mediated bleaching mechanism, blood flow, and the unloading of oxygen from hemoglobin. The results presented here illustrate that our PDT model, in a form that incorporates a 1O2 photobleaching mechanism, has the ability to simulate the PpIX bleaching data measured in human subjects over a wide range of irradiances. These simulations introduced for the first time therapy-induced blood flow reductions, which enable the simulation of the measurements over the entire fluence range.
PpIX photobleaching kinetics have been shown to be consistent with a 1O2-mediated mechanism in preclinical animal models [18–20] and recently in human sBCC by Cottrell et al. [4]. In the current study, our mathematical simulations of those human data further support this interpretation of the PpIX photobleaching kinetics. The plots of Figure 3 demonstrate that this model incorporating the 1O2-mediated bleaching mechanism effectively simulates the experimentally measured photobleaching kinetics at early fluences over a wide range of irradiance, 10–150 mW cm−2.
The experimental measurements, shown in Figures 1 and 2, reveal a flattening of the bleaching kinetics beyond an initial steep loss of fluorescence. These phenomena are also observed in preclinical animal studies [24,25] and suggest a possible ALA-PDT-induced blood flow decrease during treatment. These observations motivated us to introduce PDT-induced blood flow reductions into our model in order to completely simulate the in vivo PpIX photobleaching data. The mathematical model we used here is able to implement a series of blood flow changes for any succession of fluences. In the specific cases considered here, the results of Figures 5 and 6 indicate that we need to include at least two blood flow reductions at specific fluences for the simulated bleaching curves to fully capture the PpIX bleaching data. For the case of a 150 mW cm−2 irradiance, three blood flow reductions were necessary.
As noted in the Methods Section, our measured fluorescence spectra were corrected for possible confounding effects of tissue optical properties by division with broad band reflectance measured over the same wavelength range and in the identical geometry. In practice, these corrections were very modest, and the reflectance did not exhibit the changes that might be expected given the blood flow reductions predicted by our simulations [4,13]. There are several possible reasons for this apparent discrepancy. The most likely explanation is that, unlike the fluorescence measurements which were performed during PDT irradiation, the reflectance measurements required an interruption in the irradiation. This break was kept as short as possible, but the sequential measurements at the two locations in the treatment field may have been long enough to allow reoxygenation of hemoglobin. A future modification to our optical system will enable reflectance measurements to be made during irradiation.
Although the therapy-induced blood flow effects simulated by our mathematical model may indeed be responsible for the slower photobleaching phase observed in human sBCC, this is not the only possible explanation for this phenomenon. Kruijt et al. [25] observed a similar two-phased PpIX bleaching kinetics in the rat esophagus, with an initial rapid PpIX bleaching followed by a second slower phase that persists for the rest of the irradiation. On the basis of their PpIX fluorescence measurements, those authors suggested that the phased bleaching is due to an initially inhomogeneous PpIX concentration in the different layers of the esophagus, which contributes the distinct bleaching rates during therapeutic illumination. Our results certainly do not exclude the possibility that a spatially inhomogeneous PpIX concentration is one of the factors producing the phased PpIX bleaching kinetics.
Our numerical results predict that the magnitude of the blood flow decrease with respect to the initial value is greatest in the highest and lowest irradiance cases and moderate at the fluence rates ranging from 40 to 60 mW cm−2 (Fig. 7). This observation may in part be due to a decrease of nitric oxide (NO) production during ALA-PDT. The endothelium of blood vessels uses NO to signal the surrounding smooth muscle to relax, thus inducing vasodilatation and a blood flow increase. Similarly, a decrease in NO may result in vasoconstriction and decreased flow. Because the biosynthesis of NO requires molecular oxygen, decreased tissue oxygen levels during PDT may attenuate the NO production [26]. Therefore, the significant blood flow reduction observed at 150 mW cm−2 is consistent with ALA-PDT consuming oxygen, thereby inducing a decrease of NO and vasoconstriction. In contrast, the strong blood flow reduction observed at the lowest irradiances, 10–20 mW cm−2, may be due to efficient PDT impairment of the NO production by the endothelial cells [27] under these treatment conditions. Generally, for a given fluence, low irradiance deposits more 1O2 dose than high irradiance because of more available oxygen. Interestingly, as shown in Figure 7c,f, for most cases the calculated percent blood flow decrease is greater in the margin than in the lesion. This may also be consistent with an NO mechanism in that the normal vessels in the margin have greater smooth muscle control that do vessels in the sBCC [10,28].
Although this simple capillary-based oxygen transport model is able to simulate the in vivo PpIX bleaching measured in human sBCC and suggests possible physiological responses during treatment, we conclude by noting that our mathematical model does not fully describe the complexity of oxygen transport. The volume of tissue interrogated by fluorescence spectroscopy is supplied by many vessels, which undoubtedly respond heterogeneously to the effects of PDT. Thus, our model of discrete blood flow changes should be interpreted as a first approximation to a complex situation. Further, within the upper skin layers, the tissue has oxygen support from both the outer atmosphere and from the blood vessels within the dermis [29]. Therefore, to more rigorously simulate the dose deposition and photosensitizer bleaching during topical PDT, we anticipate building a PDT-3O2 model specific for the skin, which integrates oxygen supply from the air and blood vessels. In addition to these theoretical approaches, it is clear that experimental studies of blood flow in sBCC during ALA-PDT are urgently needed. An attractive method for doing this may be diffuse correlation spectroscopy, which has been implemented in an off-surface geometry during PDT by Yu et al. [30]. Finally, although the consequences of these treatment-induced blood flow reductions are not yet clear, they may suggest a therapeutic role for topically or systemically administered vasodilators.
Acknowledgments
This work was supported by NIH grants CA68409 and CA55791 awarded by the National Cancer Institute.
Contract grant sponsor: NIH; Contract grant numbers: CA68409, CA55791.
Nomenclature
- n
Hill coefficient
- Dcap
3O2 diffusion constant within capillary (μm2 second−1)
- Dtiss
3O2 diffusion constant within tissue (μm2 second−1)
- Csat
maximum saturated concentration of 3O2 bound to hemoglobin (μM)
- C50
dissolved 3O2 concentration in the vessel corresponding to 50% SO2 (μM)
- kp
the rate of monomolecular decay of the sensitizer triplet state (second−1)
- kot
the bimolecular rate of triplet sensitizer quenching by 3O2 (μM−1 second−1)
- kos
the bimolecular rate for 1O2 reaction with ground-state sensitizer (μM−1 second−1)
- koa
the bimolecular rate of reaction of 1O2 with biological substrate [A] (μM−1 second−1)
- δ
a characteristic sensitizer concentration at and below which 1O2-mediated bleaching becomes independent of sensitizer concentration (μM)
- [S0]
sensitizer ground state (μM)
- [A]
cellular target (μM)
- Γmet
rate of metabolic oxygen consumption (μM second−1)
- ΓPDT
rate of photodynamic oxygen consumption (μM second−1)
- V
blood flow velocity (μm second−1)
- Rc
capillary radius (μm)
- b
half the distance between two adjacent capillaries (μm)
- ψ
fluence rate (mW cm−2)
- Γ0
the initial, maximal rate of photochemical 3O2 consumption prior to photobleaching under conditions where 3O2 is not rate limiting (μM second−1)
- βPDT
proportionality constant between Γ0 and fluence rate ψ (μM cm2 second−1 mW−1)
Footnotes
The authors have no conflict of interest to declare.
References
- 1.Brown SB, Brown EA, Walker I. The present and future role of photodynamic therapy in cancer treatment. Lancet Oncol. 2004;5:497–508. doi: 10.1016/S1470-2045(04)01529-3. [DOI] [PubMed] [Google Scholar]
- 2.Grapengiesser S, Ericson M, Gudmundsson F, Larko O, Rosen A, Wennberg AM. Pain caused by photodynamic therapy of skin cancer. Clin Exp Dermatol. 2002;27:493–497. doi: 10.1046/j.1365-2230.2002.01065.x. [DOI] [PubMed] [Google Scholar]
- 3.Holmes MV, Dawe RS, Ferguson J, Ibbotson SH. A randomized, double-blind, placebo-controlled study of the efficacy of tetracaine gel (Ametop) for pain relief during topical photodynamic therapy. Br J Dermatol. 2004;150:337–340. doi: 10.1111/j.1365-2133.2004.05652.x. [DOI] [PubMed] [Google Scholar]
- 4.Cottrell WJ, Paquette AD, Keymel KR, Foster TH, Oseroff AR. Irradiance-dependent photobleaching and pain in delta-aminolevulinic acid-photodynamic therapy of superficial basal cell carcinomas. Clin Cancer Res. 2008;14:4475–4483. doi: 10.1158/1078-0432.CCR-07-5199. [DOI] [PMC free article] [PubMed] [Google Scholar]
- 5.Schacht V, Szeimies RM, Abels C. Photodynamic therapy with 5-aminolevulinic acid induces distinct microcirculatory effects following systemic or topical application. Photochem Photobiol Sci. 2006;5:452–458. doi: 10.1039/b514128a. [DOI] [PubMed] [Google Scholar]
- 6.Herman MA, Fromm D, Kessel D. Tumor blood-flow changes following protoporphyrin IX-based photodynamic therapy in mice and humans. J Photochem Photobiol B. 1999;52:99–104. doi: 10.1016/s1011-1344(99)00109-8. [DOI] [PubMed] [Google Scholar]
- 7.Enejder AM, af Klinteberg C, Wang I, Andersson-Engels S, Bendsoe N, Svanberg S, Svanberg K. Blood perfusion studies on basal cell carcinomas in conjunction with photodynamic therapy and cryotherapy employing laser-Doppler perfusion imaging. Acta Derm Venereol. 2000;80:19–23. doi: 10.1080/000155500750012441. [DOI] [PubMed] [Google Scholar]
- 8.Palsson S, Gustafsson L, Bendsoe N, Soto TM, Andersson-Engels S, Svanberg K. Kinetics of the superficial perfusion and temperature in connection with photodynamic therapy of basal cell carcinomas using esterified and non-esterified 5-aminolaevulinic acid. Br J Dermatol. 2003;148:1179–1188. doi: 10.1046/j.1365-2133.2003.05268.x. [DOI] [PubMed] [Google Scholar]
- 9.Henderson BW, Waldow SM, Mang TS, Potter WR, Malone PB, Dougherty TJ. Tumor destruction and kinetics of tumor cell death in two experimental mouse tumors following photodynamic therapy. Cancer Res. 1985;45:572–576. [PubMed] [Google Scholar]
- 10.Fukumura D, Yuan F, Endo M, Jain RK. Role of nitric oxide in tumor microcirculation. Blood flow, vascular permeability, and leukocyte-endothelial interactions. Am J Pathol. 1997;150:713–725. [PMC free article] [PubMed] [Google Scholar]
- 11.Wang KK-H, Mitra S, Foster TH. A comprehensive mathematical model of microscopic dose deposition in photodynamic therapy. Med Phys. 2007;34:282–293. doi: 10.1118/1.2401041. [Erratum: Med Phys 2008; 35: 4278–4280] [DOI] [PubMed] [Google Scholar]
- 12.Cottrell WJ, Oseroff AR, Foster TH. A portable instrument that integrates irradiation with fluorescence and reflectance spectroscopies during clinical photodynamic therapy of cutaneous disease. Rev Sci Instrum. 2006;77:064302. [Google Scholar]
- 13.Cottrell WJ. Ph.D. Thesis. University of Rochester; 2008. Imaging, scattering, and spectroscopic systems for biomedical optics: Tools for bench top and clinical applications. https://urresearch.rochester.edu/handle/1802/6288. [Google Scholar]
- 14.Hudson JA, Cater DB. An analysis of factors affecting tissue oxygen tension. Proc R Soc Lond B Biol Sci. 1964;161:247–274. doi: 10.1098/rspb.1964.0092. [DOI] [PubMed] [Google Scholar]
- 15.Georgakoudi I, Nichols MG, Foster TH. The mechanism of photofrin photobleaching and its consequences for photodynamic dosimetry. Photochem Photobiol. 1997;65:135–144. doi: 10.1111/j.1751-1097.1997.tb01889.x. [DOI] [PubMed] [Google Scholar]
- 16.Finlay JC. Ph.D. Thesis. University of Rochester; 2003. Reflectance and fluorescence spectroscopies in photodynamic therapy. https://urresearch.rochester.edu/handle/1802/2805. [Google Scholar]
- 17.Dysart JS, Singh G, Patterson MS. Calculation of singlet oxygen dose from photosensitizer fluorescence and photobleaching during mTHPC photodynamic therapy of MLL cells. Photochem Photobiol. 2005;81:196–205. doi: 10.1562/2004-07-23-RA-244. [DOI] [PubMed] [Google Scholar]
- 18.Robinson DJ, de Bruijn HS, van der Veen N, Stringer MR, Brown SB, Star WM. Fluorescence photobleaching of ALA-induced protoporphyrin IX during photodynamic therapy of normal hairless mouse skin: The effect of light dose and irradiance and the resulting biological effect. Photochem Photobiol. 1998;67:140–149. [PubMed] [Google Scholar]
- 19.Robinson DJ, de Bruijn HS, van der Veen N, Stringer MR, Brown SB, Star WM. Protoporphyrin IX fluorescence photobleaching during ALA-mediated photodynamic therapy of UVB-induced tumors in hairless mouse skin. Photochem Photobiol. 1999;69:61–70. [PubMed] [Google Scholar]
- 20.Finlay JC, Conover DL, Hull EL, Foster TH. Porphyrin bleaching and PDT-induced spectral changes are irradiance dependent in ALA-sensitized normal rat skin in vivo. Photochem Photobiol. 2001;73:54–63. doi: 10.1562/0031-8655(2001)073<0054:pbapis>2.0.co;2. [DOI] [PubMed] [Google Scholar]
- 21.Foster TH, Murant RS, Bryant RG, Knox RS, Gibson SL, Hilf R. Oxygen-consumption and diffusion effects in photodynamic therapy. Radiat Res. 1991;126:296–303. doi: 10.2307/3577919. [DOI] [PubMed] [Google Scholar]
- 22.Henning JP, Fournier RL, Hampton JA. A transient mathematical-model of oxygen depletion during photodynamic therapy. Radiat Res. 1995;142:221–226. [PubMed] [Google Scholar]
- 23.Pogue BW, Hasan T. A theoretical study of light fractionation and dose-rate effects in photodynamic therapy. Radiat Res. 1997;147:551–559. doi: 10.2307/3579621. [DOI] [PubMed] [Google Scholar]
- 24.Sheng C, Hoopes PJ, Hasan T, Pogue BW. Photobleaching-based dosimetry predicts deposited dose in ALA-PpIX PDT of rodent esophagus. Photochem Photobiol. 2007;83:738–748. doi: 10.1562/2006-09-07-RA-1033. [DOI] [PubMed] [Google Scholar]
- 25.Kruijt B, de Bruijn HS, van der Ploeg-van den Heuvel A, de Bruin RWF, Sterenborg HJCM, Amelink A, Robinson DJ. Monitoring ALA-induced PpIX-photodynamic therapy in the rat esophaugus using fluorescence and reflectance spectroscopy. Photochem Photobiol. 2008;84:1515–1527. doi: 10.1111/j.1751-1097.2008.00379.x. [DOI] [PubMed] [Google Scholar]
- 26.Rengasamy A, Johns RA. Determination of Km for oxygen of nitric oxide synthase isoforms. J Pharmacol Exp Ther. 1996;276:30–33. [PubMed] [Google Scholar]
- 27.Gilissen MJ, van de Merbel-de Wit LE, Star WM, Koster JF, Sluiter W. Effect of photodynamic therapy on the endothelium-dependent relaxation of isolated rat aortas. Cancer Res. 1993;53:2548–2552. [PubMed] [Google Scholar]
- 28.Jain RK. Determinants of tumor blood flow: A review. Cancer Res. 1988;48:2641–2658. [PubMed] [Google Scholar]
- 29.Stucker M, Struk A, Altmeyer P, Herde M, Baumgartl H, Lubbers DW. The cutaneous uptake of atmospheric oxygen contributes significantly to the oxygen supply of human dermis and epidermis. J Physiol. 2002;538:985–994. doi: 10.1113/jphysiol.2001.013067. [DOI] [PMC free article] [PubMed] [Google Scholar]
- 30.Yu G, Durduran T, Zhou C, Wang HW, Putt ME, Saunders HM, Sehgal CM, Glatstein E, Yodh AG, Busch TM. Non-invasive monitoring of murine tumor blood flow during and after photodynamic therapy provides early assessment of therapeutic efficacy. Clin Cancer Res. 2005;11:3543–3552. doi: 10.1158/1078-0432.CCR-04-2582. [DOI] [PubMed] [Google Scholar]
- 31.Georgakoudi I, Foster TH. Singlet oxygen- versus nonsinglet oxygen-mediated mechanisms of sensitizer photobleaching and their effects on photodynamic dosimetry. Photochem Photobiol. 1998;67:612–625. [PubMed] [Google Scholar]
- 32.Star WM, Aalders MC, Sac A, Sterenborg HJ. Quantitative model calculation of the time-dependent protoporphyrin IX concentration in normal human epidermis after delivery of ALA by passive topical application or lontophoresis. Photochem Photobiol. 2002;75:424–432. doi: 10.1562/0031-8655(2002)075<0424:qmcott>2.0.co;2. [DOI] [PubMed] [Google Scholar]


