Abstract
Membrane and protein traffic to the cell surface is mediated by partially redundant pathways that are difficult to perturb in ways that yield a strong phenotype. Such robustness is expected in a fine-tuned process, regulated by environmental cues, that is required for controlled cell surface growth and cell proliferation. Synthetic genetic interaction screens are especially valuable for investigating complex processes involving partially redundant pathways or mechanisms. In a previous study, we used a triple-synthetic-lethal yeast mutant screen to identify a novel component of the late exocytic transport machinery, Avl9. In a chemical-genetic version of the successful mutant screen, we have now identified small molecules that cause a rapid (within 15 min) accumulation of secretory cargo and abnormal Golgi compartment-like membranes at low concentration (<2 μM), indicating that the compounds likely target the exocytic transport machinery at the Golgi. We screened for genes that, when overexpressed, suppress the drug effects, and found that the Ras-like small GTPase, Gtr2, but not its homolog and binding partner, Gtr1, efficiently suppresses the toxic effects of the compounds. Furthermore, assays for suppression of the secretory defect caused by the compounds suggest that Gtr proteins can regulate a pathway that is perturbed by the compounds. Because avl9Δ and gtr mutants share some phenotypes, our results indicate that the small molecules identified by our chemical-genetic strategy are promising tools for understanding Avl9 function and the mechanisms that control late exocytic transport.
Cell growth and proliferation, as well as the regulation of cell surface composition, are achieved by an intracellular transport machinery that delivers proteins and membrane to the cell surface. The transport machinery is regulated by environmental sensing and signaling pathways that are integrated for the fine-tuned control of transport to the cell surface. The mechanisms that regulate cell growth and proliferation are highly robust; therefore, they can function in a wide range of environmental conditions and even when some components of the transport or signaling machinery fail. In eukaryotic cells, this robustness is achieved in part by a complex network of membrane and protein traffic routes to the cell surface (17, 33). Defects in a transport pathway can result in cargo transport by an alternate route, making transport defects difficult to detect in mutant screens (17, 18). Therefore, relatively little is known about the mechanisms by which protein and membrane cargo is transported from late exocytic sorting compartments, the late Golgi compartments and endosomes, and we have yet to identify most of the components that mediate and regulate this process.
Complex processes are more readily understood in relatively simple organisms. For this reason, the budding yeast Saccharomyces cerevisiae has become one of the most powerful experimental models for understanding intracellular transport, and most of the conserved components of the exocytic traffic machinery were first discovered by using yeast genetic strategies (27). We used a yeast genetic screen to identify a novel component of the late exocytic transport machinery, Avl9, a member of an ancient eukaryotic protein superfamily (18). Avl9 is essential in a mutant strain lacking Vps1, a dynamin homolog that is thought to function in transport vesicle formation at a late Golgi compartment (26, 34), and also lacking Apl2, a large subunit of the adaptor protein 1 (AP-1) complex, which is required for forming certain classes of clathrin-coated vesicles at late Golgi compartments and endosomes (18, 19, 31, 42). The apl2Δ and vps1Δ mutants have defects in an exocytic pathway(s), but these mutants, as well as an apl2Δ vps1Δ double mutant, grow well because cargo is rerouted into a remaining pathway(s) (18). Mutations such as avl9Δ, which are lethal in an apl2Δ vps1Δ strain but not in a wild-type strain, are expected to cause defects in a branch of the exocytic pathway that remains functional in the apl2Δ vps1Δ strain. Analogous to using mutagenesis to screen for a secretory block in the apl2Δ vps1Δ mutant, we performed a high-throughput screen of a large library of small molecules to identify compounds that inhibit the growth of the vps1Δ apl2Δ mutant but which have relatively little effect on wild-type cells. The targets of these compounds are potential components of the secretory machinery, and some of the compounds may interfere with an Avl9-related function. The biochemical function of Avl9 and related proteins is still unknown, and the inhibitors identified by our screen strategy could be valuable tools in understanding the role of Avl9 in both yeast and mammalian cells.
Our high-throughput screen was successful in identifying novel exocytic transport inhibitors, and we describe the phenotypic effects of one structurally similar group of compounds in detail. Furthermore, we show that the toxic effects of this group of compounds are inhibited by highly expressing GTR2, which encodes a Ras-like small GTPase that plays a role in regulating nutrient-responsive TORC1 (target of rapamycin complex 1) kinase signaling, exocytic cargo sorting at endosomes, and epigenetic control of gene expression (7, 11, 14, 25, 37). Therefore, the small molecules identified by our chemical-genetic approach are promising tools for understanding how signaling pathways that respond to environmental conditions regulate the traffic pathways that mediate cell growth and proliferation.
MATERIALS AND METHODS
Reagents, plasmids, and yeast strains.
The minimal medium for growing plasmid-carrying yeast strains was complete synthetic medium (CSM) lacking a nutrient for plasmid selection, with amino acid mixes from Q-Biogene. All other growth media components were from Difco and were prepared following recipes described previously (39). The rich medium was YPD (yeast extract, peptone, 2% glucose) or YPGal (yeast extract, peptone, 2% galactose) unless otherwise stated. Culture growth was monitored by measuring the optical density at 600 nm (OD600) in a Genesys 5 spectrophotometer (Thermo-Fisher). Rapamycin was from Sigma-Aldrich and prepared as described earlier (6). Hit compounds from high-throughput screening were reordered from ChemBridge (KU#1-11) or ChemDiv (KU#12-15).
Our “wild-type” yeast strains were EHY46 and EHY47 (18). EHY361 is a vps1Δ mutant strain in the EHY47 background (18). EHY644 is an apl2Δ vps1Δ mutant strain (obtained from EHY361 crossed to GPY1783-10A [18]). EHY644 was transformed with (i) pEH227, which is pRS316 with VPS1 (18), to generate EHY658; (ii) pEH331, which is pRS316 with APL2 (18), to generate EHY1166; or (iii) an “empty” vector, pRS316, which is a URA3 CEN plasmid (40), to generate EHY707. EHY807 is an apl2Δ strain, generated from EHY47 by integrating a PCR product containing apl2Δ::KanMX4 (obtained from Y12725 by using the primers EH130 and EH131 [18]). EHY1325 is a wild-type diploid generated by crossing EHY47 to EHY46. GTR2 was deleted in this diploid to generate EHY1326 by integrating a PCR fragment containing gtr2Δ::LEU2 (by using the primers EH212 [GGAAAGGACCGTTTCCGGAC] and EH213 [CGACCCCCATCGTGAGTGCT]), obtained from strain NBW5Δgtr2 (kindly provided by Takeshi Sekiguchi [25]). EHY1326 was sporulated, and gtr2Δ progeny (LZY260) was crossed to EHY644 to obtain the following haploid progeny: gtr2Δ vps1Δ apl2Δ (LZY253), gtr2Δ apl2Δ (LZY256), and gtr2Δ vps1Δ (LZY257).
Plasmids containing mutant alleles of GTR1 and GTR2 that encode proteins restricted to the GDP- or GTP-bound conformations were a generous gift from Takeshi Sekiguchi (Kyushu University) and are pL146, pL148, pL264, and pL263 (for a description, see references 25 and 43). We switched the TRP1 auxotrophic marker in these plasmids to URA3 for use in our strains, using the pTU marker-swapper plasmid (9). Plasmid pLZ43 contains GTR2 (20 upstream base pairs and 61 downstream base pairs) under the control of the GAL1 promoter and was isolated from a cDNA library (22). Plasmid pLZ44 contains GTR1 under the control of the GAL1 promoter and was generated by cloning a genomic PCR fragment (by using the primers LZP48 [GTAATGTCGTCAAATAATAGGA] and LZP26 [AAACACTCAATTGCCGAATGT]) into pCR-BluntII-TOPO, using a Zero-Blunt TOPO kit (Invitrogen). The GTR1-containing insert was then subcloned into pRS316-GAL (22) by using the PstI and SacI restriction enzyme sites.
High-throughput screen.
Our high-throughput screen for compounds that selectively inhibit the growth of an apl2Δ vps1Δ yeast strain was performed at the University of Kansas High Throughput Screening Laboratory, which has a collection of over 100,000 compounds selected from the ChemBridge, ChemDiv, and Prestwick libraries. A total of 101,376 screening compounds were distributed in 384-well plates. Each plate had 352 wells for compounds and 32 wells for positive control (no cells) and negative control (dimethyl sulfoxide [DMSO] without screening compound). The plates were seeded with an overnight (18-h) culture of EHY644 (apl2Δ vps1Δ) grown at 24°C in YPD to OD600 0.05 (early log phase). An aliquot (80 μl) of culture was mixed with 20 μl of compound dissolved in 2.5% DMSO, for a final concentration of 5 μg of compound/ml and 0.5% DMSO, in 100 μl per well. The plates were then stacked (but not sealed) and incubated at room temperature for 15 to 17 h to a final average OD600 of 0.8 (close to late exponential growth under these conditions). Plates were read on an Envision multilabel plate reader (Perkin-Elmer, Wellesley, MA). We defined hits as those compounds that gave an OD600 that was 60% lower than that of the negative control. We identified 279 hits from screening with the apl2Δ vps1Δ mutant. These hits were then tested with both the apl2Δ vps1Δ mutant (EHY644) and the corresponding wild-type strain (EHY47), in a six-point dose-response assay (0.15 to 5 μg/ml) in 96-well plates. Of the 279 primary screen hits, 15 compounds inhibited the growth of the apl2Δ vps1Δ mutant strain but were significantly less toxic to the wild-type strain.
Assays for drug effects.
All liquid cultures for growth assays and secretion assays were grown at 24°C, with the exception of the pulse-chase assays, which were performed at 30°C. (Growth at 24 and 30°C was compared for the enzymatic invertase assay in selected samples, and no difference in results was observed for the two temperatures.) Yeast on agar plates were incubated at 30°C. For shaking-culture exponential-phase growth assays, the cells were grown overnight to early exponential phase in CSM (minus uracil) medium to maintain plasmids. They were then diluted to an OD600 of 0.07, and compounds dissolved in DMSO were added at the indicated concentrations, with final DMSO concentration of 0.25% in each case. Cultures were placed on a rotating platform for aeration, and OD600 readings were taken every 2 h at least five times to generate an exponential growth curve. Rates were calculated from an exponential curve fit equation using Kaleidagraph 3.6 (Synergy Software, Reading, PA). The correlation coefficient (Pearson r) was >0.9 in each case.
The invertase, Bgl2, and CPY transport assays were performed as described previously (18). For the invertase assay, we grew cells overnight to exponential phase in either YPD or CSM (to select for CEN plasmids) and then shifted them to fresh YPD with 5% glucose for 2 to 3 h. Compound or DMSO control was then added to this medium at the indicated concentration and cultures were grown for an additional 15 min, followed by shifting cells to YPD with 0.1% glucose (to derepress invertase expression) plus compound or DMSO control for 90 min prior to performing the invertase secretion assay as described previously (18). The results from at least three independent cultures grown on different days were averaged, and variability is indicated as the standard error of the mean (SEM). Statistical significance (using a Student t test) was calculated by using Kaleidagraph 3.6 software. Pulse-chase analysis of transport kinetics was performed as described previously (18). Briefly, exponential-phase cells were inoculated into CSM lacking cysteine and methionine at 4 OD600/ml and shaken at 30°C for 5 min, and compound or DMSO control was added for 20 min prior to a 4-min pulse with 25 μCi of labeling mix/OD600 cells. Chase for 2 to 20 min was with excess cold amino acids, and cells were processed for immunoprecipitation and detection of Bgl2, invertase, and CPY as described previously (18). Cells for thin-section electron microscopy were grown at 30°C in YPD and prepared as described previously (18).
Screen for gene overexpression suppressors of drug effects.
To screen for genes that, when overexpressed, can suppress the toxic effects of our drugs, we used both a 2μ (high-copy) genomic library (5) and a GAL-promoter-driven cDNA library (22). Only the cDNA library yielded a suppressor clone. For that library, we screened for suppressors in strain EHY644 (apl2Δ vps1Δ). The strain was transformed with library DNA by using the method of Schiestl and Gietz (36), and cells were plated on CSM (lacking uracil), 2% galactose, and compound (1 μM KU#7 or 2 μM KU#4). Plasmids were recovered from colonies that could grow on drug plates and retransformed and retested for suppression in EHY644. Plasmids that retested were sequenced at the insert junctions to identify the suppressing gene.
RESULTS
High-throughput screen for compounds that are selectively toxic to a vps1Δ apl2Δ mutant strain.
We performed a high-throughput screen of a library of drug-like molecules for compounds that inhibit the growth of a yeast strain with apl2Δ and vps1Δ mutations but which have relatively small effects on a corresponding background strain. Our goal was to identify compounds that generate an AVL phenotype (for apl2 vps1 lethal), analogous to the phenotype of an avl9Δ mutant (18). Of 101,376 compounds screened, 279 significantly inhibited the growth of a vps1Δ apl2Δ mutant (<40% of growth without drug). These compounds were then screened in dose-response growth assays to eliminate compounds that inhibited the growth of both wild-type and mutant strains. Of our 279 initial hits that inhibited the growth of a vps1Δ apl2Δ mutant, we identified 15 hit compounds that selectively inhibited the growth of the mutant strain.
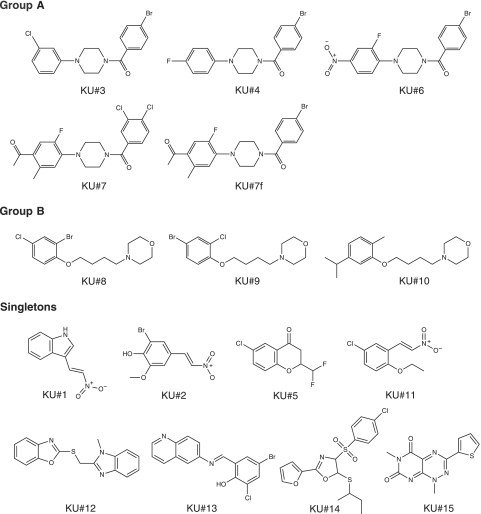
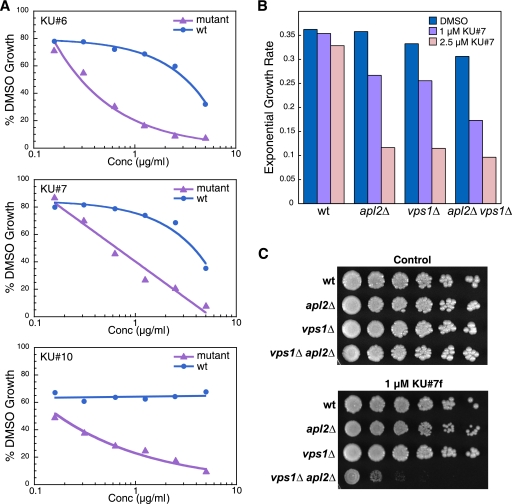
Seven of the fifteen hit compounds could be grouped into two groups based on similar structures, whereas the rest of the structures were unique (Fig. 1). We identified four similar compounds that we named group A, and three compounds that we named group B. A fifth group A compound, KU#7f, was not identified in our screen but was purchased as a substitute for KU#7 when that compound was no longer available from the supplier (KU#7f is somewhat more active than KU#7 in our assays). Dose-response growth assays in 96-well plates for representative group A compounds and a group B compound are shown in Fig. 2A. Piperazine rings are common in druglike molecules, but the published bioactive piperazine derivatives that most resembled our group A structures (12, 44) did not have growth-inhibiting activity for our mutant strains, when tested at up to 10 μM. In particular, we found that the N-benzoyl substituent was essential for the activity of our group A compounds, because similar piperazine compounds that did not have this substituent (12) had no effect in our assays (our unpublished observations). We did not find published examples of bioactive compounds that resembled our group B compounds.
FIG. 1.
Structures of all 15 hit compounds identified in a high-throughput phenotypic screen of a 101,376-compound library for small molecules that have an AVL (apl2Δ vps1Δ lethal) effect. Some of the confirmed hit compounds grouped into two structural groups, group A and group B, whereas other hits had unique structures (“singletons”).
FIG. 2.
Group A and group B compounds have mutant-specific effects on growth. (A) Dose-response growth assays for KU#6 (group A), KU#7 (group A), and KU#10 (group B) compounds. Wild-type and apl2Δ vps1Δ (“mutant”) cells were grown in the presence of compound or DMSO control in 96-well plates. Compounds were at the following concentrations, prepared by 2-fold serial dilutions: 5, 2.5, 1.25, 0.625, 0.31, and 0.15 μg/ml. The graphs show percent growth based on the calculation (OD600 in compound/OD600 in DMSO) × 100, after ∼18 h of growth. (B) Growth rates of exponential-phase cells in shaking cultures. Overnight exponential-phase cultures were diluted to an OD600 of 0.07, and compounds or DMSO control were added at the indicated concentrations with final DMSO concentrations of 0.25% in each case. Cultures were grown with aeration, and OD600 measurements were obtained over ∼9 h of growth to generate growth curves. Rates were determined from an exponential curve fit equation (correlation coefficients > 0.9 in each case). (C) Growth on solid medium in the presence of group A compounds. Cultures were grown to an OD600 of 1.0 and spotted on a YPD plate containing 1 μM KU#7f and on a control plate, after fourfold serial dilutions. In panels B and C, mutant strains have an EHY47 wild-type background and are identical except for the plasmids they contain: EHY658 (apl2Δ), EHY1166 (vps1Δ), and EH707 (apl2Δ vps1Δ).
Group A compounds selectively inhibit the growth of apl2Δ and vps1Δ mutants.
We tested all of our 15 hit compounds in exponentially growing shaking cultures for growth-inhibiting activity and found that the group A compounds had the most rapid (within 30 min), dramatic effect on the growth of either the apl2Δ or vps1Δ or apl2Δ vps1Δ mutant strains, with relatively much smaller effects on the growth of our wild-type strain (Fig. 2B). However, when grown on solid medium, the toxic effects of the compounds were specific to the apl2Δ vps1Δ strain; thus, the group A compounds have an AVL (for apl2Δ vps1Δ lethal) effect (Fig. 2C). It is possible that rapidly growing cells in shaking cultures, in which membrane trafficking occurs at a greater speed than it does in cells grown on plates, are more sensitive to group A compounds. Alternatively, our results could reflect the time scale of the assays, a few hours in shaking cultures at exponential growth, compared to several days on plates, in which time the vps1Δ and apl2Δ single mutants could possibly adapt to the effects of the compounds.
In contrast to group A compounds, most of our hit compounds initially did not appear to inhibit growth of exponentially growing shaking cultures. This included the group B compounds, which consistently strongly inhibited the growth of the apl2Δ vps1Δ strain but not the wild-type strain when the growth assay was performed in 96-well (nonshaking) liquid cultures (Fig. 2A) or agar plates (not shown). However, we found that after cells were grown for a longer time (>4 h), growth inhibition in shaking liquid cultures became apparent in group B compounds (results not shown). The delay in growth defect was not due to a need for buildup of compound in cells, because we noticed the same time delay in lower and higher concentrations of the drug. It is possible that these compounds affect gene expression or signaling pathways that regulate growth.
Group A compounds inhibit exocytic transport.
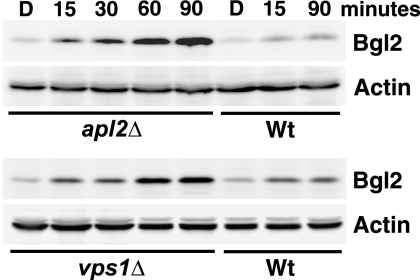
It is difficult to interpret results with slow-acting growth inhibitors, so we focused on analyzing the effects of group A compounds, which rapidly inhibited the growth of our mutant strains. To determine whether the toxicity of these compounds is due to a transport block, we assayed the effects of the compounds on exocytic cargo transport. In wild-type yeast, two pathways can transport exocytic cargo. One route transports the cell wall protein Bgl2, whereas another route transports the periplasmic enzyme invertase (16). These two cargoes are sorted into one pathway in a vps1Δ mutant, in which the normal invertase pathway appears to be blocked (17). Bgl2 transport can be conveniently assayed, because at steady state most of this protein is in the cell wall, which can be removed by enzymatic digestion (spheroplasting). Wild-type cells have very little Bgl2 after spheroplasting, which represents intracellular Bgl2 in transit to the cell surface. We found that 15 min after the compound was added, intracellular accumulation of Bgl2 was detected in the vps1Δ and apl2Δ mutants but not in the corresponding wild-type strain (Fig. 3). This accumulation was very dramatic after 90 min, indicating a significant defect in Bgl2 transport.
FIG. 3.
Group A compounds cause internal accumulation of the cell wall protein, Bgl2, in apl2Δ and vps1Δ mutant strains. Cells were grown to exponential phase, and compound KU#4 (group A) was added at 10 μM for the indicated times. DMSO controls (“D”) represent 60-min time point samples. The cell walls were digested to remove external Bgl2, and internal Bgl2 was assayed by Western blotting. Actin is shown as loading control. Strains are as described in Fig. 2.
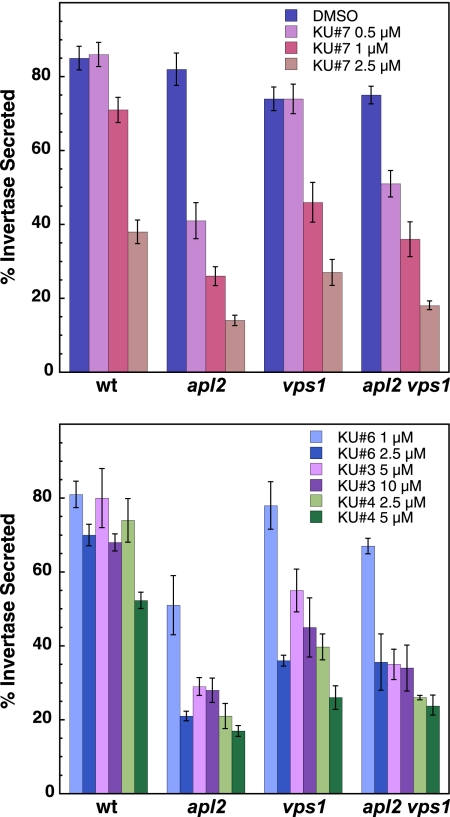
We also assayed the transport of a periplasmic enzyme, invertase, in the presence of group A compounds. Invertase expression is repressed when cells are grown in 2% glucose, and expression is derepressed when cells are shifted to 0.1% glucose (8). There is no detectable invertase secretion prior to derepressing expression. We added compounds to cells 15 min prior to derepression and then shifted cells into low glucose with compound for 90 min, followed by enzymatic assays for invertase secretion (Fig. 4). We observed a very significant secretory defect for the apl2Δ mutant in as low as 0.5 μM compound KU#7, the lowest concentration that we assayed. We found similar effects on secretion for all of our group A compounds, and the apl2Δ mutant was consistently the most sensitive to compound in this assay (Fig. 4). The mutant strains were identical except for the plasmids that they contained (double mutant with either empty vector or vector with VPS1 or APL2). It is possible that the double mutant adapts to the transport defect in some way that makes it less sensitive to compound in this assay. Interestingly, the relative invertase secretion defects in the different mutants did not correspond with the relative growth decrease in compounds (Fig. 2B and C).
FIG. 4.
Group A compounds cause a mutant-specific defect in invertase secretion. Cultures were grown to exponential phase in high-glucose medium, and the compound was added for 15 min before shifting to low glucose with the compound (to derepress invertase expression). Growth in the compound was continued for 90 min. External invertase was compared to total invertase by an enzymatic assay to calculate the percentage of invertase secreted. Strains are as in Fig. 2. The means of three experiments (from three independent cultures) are shown. Error bars, SEM.
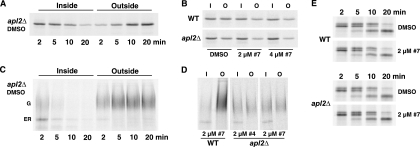
The secretory assays described above have the advantage of being very sensitive for detecting transport defects. However, the assays show cargo accumulation over time, rather than an immediate effect on transport kinetics. Therefore, we also performed metabolic labeling and pulse-chase analysis of secretory cargo to determine whether the compounds had observable effects on transport kinetics in this assay (Fig. 5). In the absence of inhibitors, about half of the Bgl2 is exported within 5 min, while transport of invertase is faster (Fig. 5A and C shows the results for apl2Δ [the results were similar for the wild type]). Both wild-type and apl2Δ cells show a defect in Bgl2 transport kinetics in compounds KU#4 and KU#7 (Fig. 5B), and the defect is more substantial in apl2Δ cells. The slower transport kinetics was most easily observed at early chase time points, but there was not a complete transport block, and most Bgl2 was secreted by 20 min (not shown). KU#4 and KU#7 also slowed invertase transport in the apl2Δ mutant, but not in wild-type cells (Fig. 5D). However, invertase transport is normally very fast, so it is difficult to detect a partial transport block by pulse-chase analysis. Wild-type cells did show a defect in the enzymatic invertase secretion assay (Fig. 4), but internal invertase in that assay represents accumulation over 90 min. Furthermore, the enzymatic assays also show an incomplete transport block for wild-type and even mutants, at the drug concentrations we tested (for comparison, the sec6-4 conditional secretory mutant secretes <5% invertase at a restrictive temperature in this enzymatic assay [27; our unpublished observations]). The transport defects caused by our compounds appear to be specific to the late exocytic pathway, because pulse-chase analysis of transport of a vacuolar protein, CPY, showed no detectable defect in ER-to-Golgi transport or transport from the Golgi to vacuole (Fig. 5E).
FIG. 5.
Pulse-chase analysis shows a kinetic lag of Bgl2 and invertase exocytic transport in the presence of group A compounds. Cells were preincubated with compound or DMSO control for 20 min and metabolically labeled with 35S cysteine and methionine for 4 min, followed by addition of excess unlabeled amino acids for 2- to 20-min chase times (A, C, and E) or for a 5-min chase (B and D). The inside (I) fraction was separated from the cell wall and medium fraction (O), and Bgl2 (A and B), invertase (C and D), and CPY (E) were immunoprecipitated and detected by phosphorimaging. Bgl2 is not visibly modified, whereas invertase has an ER form and a Golgi compartment-modified (G) heterogeneously glycosylated form. CPY has a 67-kDa ER form, a 69-kDa Golgi form, and a 61-kDa vacuole form. Group A compounds do not cause a defect in ER-to-Golgi compartment or Golgi compartment-to-vacuole transport of CPY.
Group A compounds cause accumulation of abnormal Golgi compartment-like membranes.
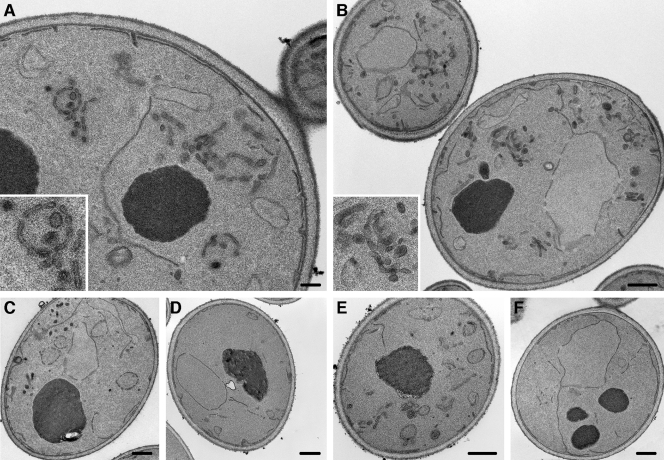
To further define the membrane traffic defects caused by our group A compounds, we examined the ultrastructure of cells grown in the presence of KU#7 or KU#3 by thin-section electron microscopy (Fig. 6). The apl2Δ strain showed dramatic accumulation of membranes when grown in KU#7 for just 30 min (Fig. 6A and B). Most of the membranes were clusters of vesicles and/or tubules (tubules and fenestrated membranes could appear as clustered vesicles in the plane of a thin section). Another common and striking structure was a ring of discontinuous membranes (enlarged inset in Fig. 6A; also seen in Fig. 6B, C, and E). Similar rings were observed in cells grown in the presence of KU#3 for 60 min (Fig. 6C; KU#3 is our least-effective group A compound). Because the rings were consistently circular, they likely represent fenestrated spheres, structures also observed in temperature-sensitive sec14 (sec14-ts) mutants after a short shift to a restrictive temperature (32) and in an arf1Δ mutant (15). Gaynor et al. (15) observed both very large and smaller rings in arf1Δ cells and, based on complementing immunolocalization studies by light microscopy, these researchers concluded that the large rings likely represent aberrant endosomes, whereas the smaller rings represent Golgi membranes. In our samples, we did not observe the very large rings seen in the arf1Δ mutant. However, the arf1Δ and sec14-ts mutants have defects in transport from both Golgi and endosomes (15, 23), and the invertase-transporting exocytic pathway likely transits endosomes (17), so our group A compounds could perturb exit from either or both the Golgi and endosomes. Wild-type cells had a similar but less abundant membrane-accumulation phenotype when grown in the presence of KU#7 (Fig. 6E). We did not observe these abnormal membranes in either apl2Δ cells or wild-type cells grown in DMSO control (Fig. 6D, F), although the apl2Δ cells had occasional small continuous rings which represent cup-shaped structures, similar to but much smaller than Berkeley bodies, thought to represent aberrant Golgi, in sec7-ts and sec14-ts mutants (27). We also observed small continuous rings in cells grown in KU#7, but these were likewise smaller and rarer than the structures accumulated by sec7 and sec14 mutants. Cells grown in KU#7 for 1 h had a similar phenotype (not shown), so the fenestrated spheres did not progress to Berkeley bodies at the drug concentrations we tested. It is possible that the fenestrated spheres and tubules represent an incomplete block in exit from the Golgi (as is the case with the arf1Δ mutant described in reference 15). Alternatively, the different abnormal membranes may represent different molecular defects.
FIG. 6.
Group A compounds cause accumulation of Golgi or endosome-like membranes. An apl2Δ strain (EHY807 [A and B]) or wild-type (EHY47 [E]) were grown in the presence of 2.5 μM compound KU#7 for 30 min. (C) Similar results were obtained for apl2Δ cells grown in 10 μM KU#3 (a less-potent group A compound) for 60 min. DMSO controls without compound are shown in panels D (apl2Δ) and F (wild type). Cells were prepared for thin-section electron microscopy as described previously (18). Scale bars: 200 nm (A), 500 nm (B to F).
The toxicity of group A compounds can be suppressed by overexpressed GTR2.
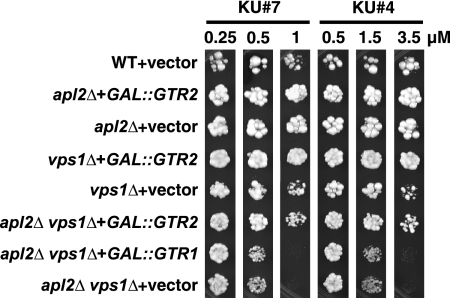
A relatively simple strategy for identifying potential drug targets, or genes that are relevant for the function of a drug target, is a screen for gene dosage suppression of the drug effects. We screened both a 2μ (multicopy) genomic library and a GAL-promoter-driven cDNA library (22) for genes that, when overexpressed, can suppress the toxicity of group A compounds. We obtained no suppressors from the 2μ library and only one strong suppressor gene from the cDNA library. We identified the suppressor gene as GTR2 (Fig. 7). Gtr1 and Gtr2 are homologous Ras-like GTP-binding proteins that form hetero- and homodimers (14, 25). They function as nutrient-responsive regulators of the TORC1 signaling pathway (7, 11), exocytic sorting of the Gap1 general amino acid permease at endosomes (14), and epigenetic control of gene expression (37). Although Gtr1 and Gtr2 are thought to function as obligate heterodimers, Gtr1 had no suppressing effect when highly expressed from the GAL promoter (Fig. 7). A 2μ (high-copy) plasmid containing GTR2 under its native promoter could not suppress toxicity either on glucose or galactose (our unpublished observations).
FIG. 7.
Overexpression of GTR2 on galactose-containing medium suppresses the toxic effect of group A compounds. The strains are described in Materials and Methods and are as follows: EHY47 with pRS316, EHY807 with pLZ43; EHY807 with pRS316, EHY361 with pLZ43, EHY361 with pRS316, EHY644 with pLZ43, EHY644 with pLZ44, and EHY644 with pRS316.
A dominant-negative form of the Gtr complex and decreased TORC1 signaling suppress the secretory defect caused by group A compounds.
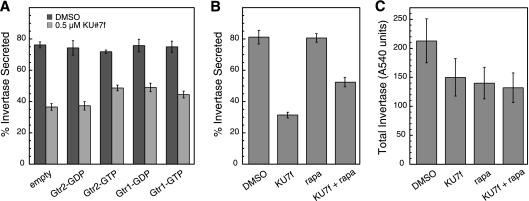
Our invertase secretion assay is not compatible with growth on galactose-containing medium, so we could not use our GAL-GTR2 construct to test whether overexpression of GTR2 can suppress the effects of group A compounds on invertase secretion. Instead, we used mutant alleles of the GTR genes expressed from their native promoters in CEN (low-copy) plasmids. The Gtr1/Gtr2 dimer, as well as the metazoan counterpart, RagAB/RagCD, are active in positively regulating TORC1 signaling when Gtr1 (or RagA or RagB) is GTP-bound and Gtr2 (or RagC or RagD) is GDP bound. Furthermore, in the opposite conformations (Gtr1/RagAB in a GDP-bound state and Gtr2/RagCD in a GTP-bound state) have a dominant-negative effect on TORC1 signaling (7, 11, 20, 35). Likewise, the Gap1 permease is sorted from a vacuolar pathway to the exocytic pathway when Gtr1 is GTP-bound and Gtr2 is GDP bound but not when the GTPases are restricted to the opposite conformations (14). We tested GTR alleles that express either GTP-restricted or GDP-restricted forms of the proteins for effect on invertase secretion in apl2Δ vps1Δ cells grown in the presence of KU#7f (Fig. 8A). We found that both Gtr1 and Gtr2 can partially suppress the effects of KU#7f on secretion, and only when the GTPases are restricted to the conformations that are expected to form a dominant-negative complex. Although the suppression of the secretory defect was not dramatic, the Gtr proteins were not overexpressed in these experiments, and the wild-type proteins were also present. Furthermore, the results were consistent in each repeat of the experiment and statistically significant (P = 0.001 for secretion with empty vector compared to secretion when Gtr2-GTP is expressed). In contrast, the alleles that are expected to form the TORC1-activating form of the Gtr complex (Gtr2-GDP and Gtr1-GTP) had less or no effect on invertase secretion (Fig. 8A).
FIG. 8.
Dominant-negative Gtr proteins and subinhibitory rapamycin suppress the invertase secretion defect caused by group A compounds. (A) An apl2Δ vps1Δ mutant strain (EHY644) was transformed with empty vector (pRS316) or pRS-based (CEN) vectors expressing GDP- or GTP-restricted mutant forms of Gtr1 and Gtr2 from their native promoters. The strains were tested for invertase secretion after growth in 0.5 μM KU#7f, as described for Fig. 4. For each strain, the means were calculated from seven repeats (for KU#7f) or three repeats (for DMSO). Each repeat was an independent culture. (B) An apl2Δ vps1Δ mutant strain (EHY644) culture was divided into four samples, which were treated with either DMSO (control), or 0.5 μM KU#7f, or 10 ng of rapamycin/ml, or 0.5 μM KU7f plus 10 ng of rapamycin/ml together. The means from three independent (predrug) cultures are shown. (C) Total invertase activity (secreted plus internal) from the cultures used in panel B. Invertase is expressed as A540 units per OD600 cells from the invertase enzymatic assay. Error bars, SEM.
Because the “active” Gtr complex positively regulates TORC1 signaling, whereas the “inactive” complex has a dominant-negative effect on TORC1 activity, we sought to determine whether decreasing TORC1 activity also suppresses the secretory defect in the presence of KU#7f. We found that 10 ng of rapamycin/ml (which is the amount typically used as a subinhibitory level, whereas 200 ng/ml is used to inhibit growth [6]) suppressed the secretory defect caused by KU#7f to an extent similar to that of the dominant-negative Gtr proteins (Fig. 8B). A nearly identical result was obtained with 20 ng of rapamycin/ml (data not shown), so our results with both the Gtr proteins and rapamycin may represent the maximum possible suppression. Rapamycin alone, either 10 ng/ml (or 20 ng/ml [data not shown]) had no effect on invertase secretion in the apl2Δ vps1Δ strain when no group A compound was present (Fig. 8B).
TORC1 positively regulates translation (45), so we speculated that suppression by reducing TORC1 activity may be due to a decrease in cargo flow through the secretory pathway, such that the reduced secretory competence due to effects of our group A compound is less deleterious to the apl2Δ vps1Δ mutant. Cells are grown in the drugs for 15 min prior to derepression of invertase expression, followed by 90 min more in drug, so some reduction in protein synthesis might eventually occur in the time course of our experiments. However, for the identical samples shown in Fig. 8B, we found that total invertase (secreted plus internal) was essentially the same when just KU#7f was added to cells and when both KU#7f and rapamycin were added (although total invertase level was somewhat lower compared to the DMSO control, whether or not rapamycin and KU#7f were combined or each was present alone). These results suggest that TORC1 activity may regulate membrane traffic in a way that is deleterious when traffic is perturbed in the apl2Δ vps1Δ mutant by group A compounds. We were unable to detect suppression of the growth-inhibitory effect of group A compounds, by either the mutant alleles of Gtr proteins or the subinhibitory levels of rapamycin. This could be because the invertase assay measures a relatively short-term effect, and the long-term effect on growth is not as readily suppressed.
GTR2 is not a likely direct target of group A compounds.
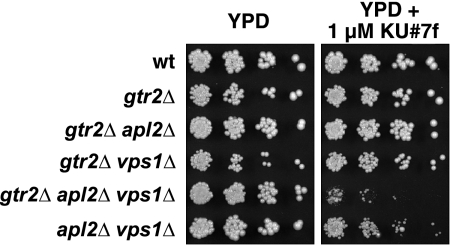
Suppression by overexpressed Gtr2 could indicate either that Gtr2 is a target of our group A compounds or that the function of the drug target is relevant for Gtr2 activity. Because group A compounds are toxic to an apl2Δ vps1Δ mutant, a defect in the drug target could likewise be deleterious to the apl2Δ vps1Δ strain. We found that crossing a gtr2Δ mutation into our apl2Δ vps1Δ strain did not noticeably reduce the growth of the gtr2Δ apl2Δ vps1Δ triple-mutant progeny (Fig. 9). It is still possible that group A compounds have a dominant effect on Gtr2 or target a regulator of its activity. However, this is unlikely, because in such a case, the deleterious effects of the compounds would require the presence of GTR2, and we found that KU#7f is at least as toxic to a gtr2Δ apl2Δ vps1Δ mutant as it is to an apl2Δ vps1Δ mutant (Fig. 9). Although we have not yet identified the molecular target of our compounds, we can conclude that modulation of TORC1 activity is critical when the effects of group A compounds are combined with the apl2Δ and vps1Δ mutations, and our results are valuable in suggesting additional target candidates.
FIG. 9.
Gtr2 is not a likely target of our group A compounds. A gtr2Δ mutation (in EHY47 background) was crossed into an apl2Δ vps1Δ strain (EHY644). All double- and triple-mutant progeny were viable; therefore, unlike group A compounds, gtr2Δ does not produce an AVL phenotype. The gtr2Δ apl2Δ vps1Δ strain was at least as sensitive to 1 μM KU#7f as was an apl2Δ vps1Δ strain, indicating that the drug does not interact with Gtr2 for a dominant effect. These results show that group A compounds do not have a direct effect on Gtr2 function.
DISCUSSION
We screened a 101,376-compound library for small molecules that perturb the late exocytic pathway, with the goal of identifying novel molecular probes to help us understand the mechanisms and regulation of late exocytic transport. We identified 15 compounds that had selective toxicity toward an apl2Δ vps1Δ mutant, in which exocytic cargo is rerouted from a defective pathway to an alternative exocytic route. Thus, the compounds are expected to perturb a remaining exocytic pathway in this mutant, and cause an AVL phenotype, analogous to the phenotype of the avl9Δ mutant identified in a classical yeast mutant screen (18). Some of our hits fell into two groups of similar structures, and one of these groups, which we named group A, we characterized in detail for effects on membrane trafficking.
The group A compounds inhibit the growth of the apl2Δ vps1Δ strain at a low (<1 μM) concentration and cause an exocytic defect at <0.5 μM both in this double mutant and the apl2Δ and vps1Δ single mutants. The transport defect appears to be specific to the late exocytic pathway, because the compounds have no detectable effect on transport to the vacuole/lysosome in either apl2Δ or wild-type cells. Furthermore, the compounds cause rapid (within 30 min) accumulation of membranes that resemble the aberrant membranes in other mutants with exocytic blocks at late Golgi compartments. With higher concentrations of compound (>2 μM), we detected secretory defects and membrane accumulation in wild-type cells as well. These results indicate that our compounds inhibit exocytic transport from Golgi compartments and possibly endosomes and thus target a molecule(s) that mediates traffic at these steps.
We initiated efforts to identify the molecular target of our group A compounds by screening for genes that suppress the toxicity of the compounds when overexpressed. Although Avl9 is a potential target, it is highly toxic when overexpressed (18), and other strategies are needed to explore it as a potential drug target. Our suppressor screen identified just one gene, GTR2, which suppressed the toxic effects of our most potent group A compound, KU7f, when highly expressed from the GAL promoter. Gtr2 and its homolog, Gtr1, function as a dimer to regulate numerous nutrient-responsive processes, but the primary function of these GTPases and the corresponding metazoan proteins is thought to be the regulation of TORC1 signaling and thus the regulation of growth (7, 11, 20, 35). Overexpression of GTR1 could not suppress the toxicity of KU7f, a result that was explained in our subsequent assays with GDP- and GTP-restricted mutant alleles of the GTPases. We found that the dominant-negative alleles of the GTPases, having a GDP-restricted conformation for Gtr1 and GTP-restricted conformation for Gtr2, partially suppressed the invertase secretion defect caused by KU7f in the apl2Δ vps1Δ mutant. Therefore, the overexpressed wild-type proteins are likely more abundant in a GTP-bound conformation.
The alleles of the GTPases that best suppressed the secretory defect caused by KU7f are dominant-negative regulators of TORC1 signaling and, correspondingly, sublethal concentrations of rapamycin, a TORC1 inhibitor, likewise suppressed the invertase secretory defect caused by KU7f. This result was not due to a reduction in invertase production. Therefore, TORC1 signaling may regulate a pathway that needs modulation in response to secretory transport blocks. Invertase in wild-type cells likely transits endosomes en route to the cell surface (17), and endosomes are the most likely site where the Gtr/Rag complex functions in regulating transport in response to amino acid signals in both yeast and mammalian cells (14, 35). Furthermore, TORC1-mediated signaling functions at endosomes or Golgi compartments for sorting the high-affinity tryptophan and histidine permeases, Tat2 and Hip1, from an endosome-mediated vacuolar pathway to the exocytic pathway (6). It is possible that both group A compounds and TORC1 signaling enhance sorting into an endosome-mediated exocytic transport route that is defective in the apl2Δ vps1Δ mutant. TORC1 signaling and our compounds may instead, or in addition, downregulate an alternative transport route for invertase that is utilized by the apl2Δ vps1Δ mutant.
In addition to linking exocytic transport to signaling mechanisms that regulate growth, the identification of GTR2 as a suppressor of our group A compounds was an exciting result, because it suggests that our chemical-genetic strategy may lead to insights about Avl9 function. The gtr and avl9 mutants were among the top-ranked mutants in a genome-wide screen of the nonessential yeast gene deletion collection for mutants that are hypersensitive to both high hydrostatic pressure and cold temperature (3). The reason for this growth phenotype of gtr and avl9Δ mutants is not clear, but it could reflect defects in traffic due to reduced membrane fluidity under these conditions. Other mutations in nonessential genes that cause defective transport from the Golgi were also identified in the screen (3). Furthermore, at high pressure and cold temperature, the Tat2 permease is sorted to the vacuole even though TOR signaling seems unaffected (2), suggesting that the TORC1-regulated exocytic route is especially sensitive to conditions that reduce membrane fluidity.
Transcriptional profiles of S. cerevisiae subjected either to high hydrostatic pressure or to cold temperature indicate highly upregulated expression of genes involved in remodeling of the cell surface (plasma membrane and cell wall) under anaerobic growth conditions (1, 4, 10, 13, 28). Traffic pathways or mechanisms that involve Avl9 and Gtr function may be involved in cell surface remodeling, and a defect in this process may lead to pressure and cold sensitivity. Alternatively or in addition, the high levels of expression of these same set of genes encoding cell surface components may be toxic to the avl9Δ mutant. The avl9Δ mutant is SLAM (for synthetic lethality analysis on microarrays) with mot3Δ (29), and Mot3 is a repressor of the expression of most of these same cell surface components (38). It is also possible that Avl9 and Gtr proteins have a role in regulating plasma membrane homeostasis, or an Avl9- and Gtr-dependent sorting or transport process depends on optimized lipid composition. There is much evidence that regulation lipid composition is critical for cargo sorting and transport carrier formation in the late secretory pathway (21, 23, 24, 30, 41).
The signaling pathways that regulate cell growth and proliferation are expected to coordinate with regulation of the traffic pathways that deliver cell surface components and thereby mediate cell growth. Therefore, our result that modulation of a TORC1-mediated process is critical in the presence of our group A compounds suggests that these compounds may serve as powerful probes for understanding the molecular mechanisms by which late exocytic transport is regulated in response to environmental factors. Furthermore, a possible link to Avl9 function via Gtr2-mediated suppression of the drug effects, as well at the AVL phenotype conferred by the compounds, indicate that our new exocytic transport inhibitors may help us to discover the biochemical and biological functions of the Avl9 protein family.
Acknowledgments
We are very grateful to Takeshi Sekiguchi (Kyushu University) for the GTR1 and GTR2 strains and plasmids and to Doug Law (University of Missouri, Kansas City, Electron Microscopy Facility) for providing access to equipment. We thank Qizhuang Ye for help with high-throughput data analysis.
This study was supported by National Institutes of Health grants R03 NS050784, P20 RR15563, and R21 NS061754 and by grant 0760054Z from the American Heart Association.
Footnotes
Published ahead of print on 6 November 2009.
REFERENCES
- 1.Abe, F. 2007. Induction of DAN/TIR yeast cell wall mannoprotein genes in response to high hydrostatic pressure and low temperature. FEBS Lett. 581:4993-4998. [DOI] [PubMed] [Google Scholar]
- 2.Abe, F., and K. Horikoshi. 2000. Tryptophan permease gene TAT2 confers high-pressure growth in Saccharomyces cerevisiae. Mol. Cell. Biol. 20:8093-8102. [DOI] [PMC free article] [PubMed] [Google Scholar]
- 3.Abe, F., and H. Minegishi. 2008. Global screening of genes essential for growth in high-pressure and cold environments: searching for basic adaptive strategies using a yeast deletion library. Genetics 178:851-872. [DOI] [PMC free article] [PubMed] [Google Scholar]
- 4.Abramova, N. E., B. D. Cohen, O. Sertil, R. Kapoor, K. J. Davies, and C. V. Lowry. 2001. Regulatory mechanisms controlling expression of the DAN/TIR mannoprotein genes during anaerobic remodeling of the cell wall in Saccharomyces cerevisiae. Genetics 157:1169-1177. [DOI] [PMC free article] [PubMed] [Google Scholar]
- 5.Akada, R., J. Yamamoto, and I. Yamashita. 1997. Screening and identification of yeast sequences that cause growth inhibition when overexpressed. Mol. Gen. Genet. 254:267-274. [DOI] [PubMed] [Google Scholar]
- 6.Beck, T., A. Schmidt, and M. N. Hall. 1999. Starvation induces vacuolar targeting and degradation of the tryptophan permease in yeast. J. Cell Biol. 146:1227-1238. [DOI] [PMC free article] [PubMed] [Google Scholar]
- 7.Binda, M., M.-P. Péli-Gulli, G. Bonfils, N. Panchaud, J. Urban, T. W. Sturgill, R. Loewith, and C. De Virgilio. 2009. The Vam6 GEF controls TORC1 by activating the EGO complex. Mol. Cell 35:563-573. [DOI] [PubMed] [Google Scholar]
- 8.Carlson, M., and D. Botstein. 1982. Two differentially regulated mRNAs with different 5′ ends encode secreted with intracellular forms of yeast invertase. Cell 28:145-154. [DOI] [PubMed] [Google Scholar]
- 9.Cross, F. R. 1997. ‘Marker swap’ plasmids: convenient tools for budding yeast molecular genetics. Yeast 13:647-653. [DOI] [PubMed] [Google Scholar]
- 10.Domitrovic, T., C. M. Fernandes, E. Boy-Marcotte, and E. Kurtenbach. 2006. High hydrostatic pressure activates gene expression through Msn2/4 stress transcription factors which are involved in the acquired tolerance by mild pressure precondition in Saccharomyces cerevisiae. FEBS Lett. 580:6033-6038. [DOI] [PubMed] [Google Scholar]
- 11.Dubouloz, F., O. Deloche, V. Wanke, E. Cameroni, and C. De Virgilio. 2005. The TOR and EGO protein complexes orchestrate microautophagy in yeast. Mol. Cell 19:15-26. [DOI] [PubMed] [Google Scholar]
- 12.Duncan, M. C., D. G. Ho, J. Huang, M. E. Jung, and G. S. Payne. 2007. Composite synthetic lethal identification of membrane traffic inhibitors. Proc. Natl. Acad. Sci. U. S. A. 104:6235-6240. [DOI] [PMC free article] [PubMed] [Google Scholar]
- 13.Fernandes, P. M. B., T. Domitrovic, C. M. Kao, and E. Kurtenbach. 2004. Genomic expression pattern in Saccharomyces cerevisiae cells in response to high hydrostatic pressure. FEBS Lett. 556:153-160. [DOI] [PubMed] [Google Scholar]
- 14.Gao, M., and C. A. Kaiser. 2006. A conserved GTPase-containing complex is required for intracellular sorting of the general amino-acid permease in yeast. Nat. Cell Biol. 8:657-667. [DOI] [PubMed] [Google Scholar]
- 15.Gaynor, E. C., C. Y. Chen, S. D. Emr, and T. R. Graham. 1998. ARF is required for maintenance of yeast Golgi and endosome structure and function. Mol. Biol. Cell 9:653-670. [DOI] [PMC free article] [PubMed] [Google Scholar]
- 16.Harsay, E., and A. Bretscher. 1995. Parallel secretory pathways to the cell surface in yeast. J. Cell Biol. 131:297-310. [DOI] [PMC free article] [PubMed] [Google Scholar]
- 17.Harsay, E., and R. Schekman. 2002. A subset of yeast vacuolar protein sorting mutants is blocked in one branch of the exocytic pathway. J. Cell Biol. 156:271-285. [DOI] [PMC free article] [PubMed] [Google Scholar]
- 18.Harsay, E., and R. Schekman. 2007. Avl9p, a member of a novel protein superfamily, functions in the late secretory pathway. Mol. Biol. Cell 18:1203-1219. [DOI] [PMC free article] [PubMed] [Google Scholar]
- 19.Hirst, J., and M. S. Robinson. 1998. Clathrin and adaptors. Biochim. Biophys. Acta 1404:173-193. [DOI] [PubMed] [Google Scholar]
- 20.Kim, E., P. Goraksha-Hicks, L. Li, T. P. Neufeld, and K.-L. Guan. 2008. Regulation of TORC1 by Rag GTPases in nutrient response. Nat. Cell Biol. 10:935-945. [DOI] [PMC free article] [PubMed] [Google Scholar]
- 21.Klemm, R. W., C. S. Ejsing, M. A. Surma, H.-J. Kaiser, M. J. Gerl, J. L. Sampaio, Q. de Robillard, C. Ferguson, T. J. Proszynski, A. Shevchenko, and K. Simons. 2009. Segregation of sphingolipids and sterols during formation of secretory vesicles at the trans-Golgi network. J. Cell Biol. 185:601-612. [DOI] [PMC free article] [PubMed] [Google Scholar]
- 22.Liu, H., J. Krizek, and A. Bretscher. 1992. Construction of a GAL1-regulated yeast cDNA expression library and its application to the identification of genes whose overexpression causes lethality in yeast. Genetics 132:665-673. [DOI] [PMC free article] [PubMed] [Google Scholar]
- 23.Mousley, C. J., K. Tyeryar, K. E. Ile, G. Schaaf, R. L. Brost, C. Boone, X. Guan, M. R. Wenk, and V. A. Bankaitis. 2008. Trans-Golgi network and endosome dynamics connect ceramide homeostasis with regulation of the unfolded protein response and TOR signaling in yeast. Mol. Biol. Cell 19:4785-4803. [DOI] [PMC free article] [PubMed] [Google Scholar]
- 24.Muthusamy, B. P., S. Raychaudhuri, P. Natarajan, F. Abe, K. Liu, W. A. Prinz, and T. R. Graham. 2009. Control of protein and sterol trafficking by antagonistic activities of a type IV P-type ATPase and oxysterol binding protein homologue. Mol. Biol. Cell 20:2920-2931. [DOI] [PMC free article] [PubMed] [Google Scholar]
- 25.Nakashima, N., E. Noguchi, and T. Nishimoto. 1999. Saccharomyces cerevisiae putative G protein, Gtr1p, which forms complexes with itself and a novel protein designated as Gtr2p, negatively regulates the Ran/Gsp1p G protein cycle through Gtr2p. Genetics 152:853-867. [DOI] [PMC free article] [PubMed] [Google Scholar]
- 26.Nothwehr, S. F., E. Conibear, and T. H. Stevens. 1995. Golgi and vacuolar membrane proteins reach the vacuole in vps1 mutant yeast cells via the plasma membrane. J. Cell Biol. 129:35-46. [DOI] [PMC free article] [PubMed] [Google Scholar]
- 27.Novick, P., C. Field, and R. Schekman. 1980. Identification of 23 complementation groups required for posttranslational events in the yeast secretory pathway. Cell 21:205-215. [DOI] [PubMed] [Google Scholar]
- 28.Palhano, F. L., H. L. Gomes, M. T. Orlando, E. Kurtenbach, and P. M. Fernandes. 2004. Pressure response in the yeast Saccharomyces cerevisiae: from cellular to molecular approaches. Cell. Mol. Biol. 50:447-457. [PubMed] [Google Scholar]
- 29.Pan, X., D. S. Yuan, D. Xiang, X. Wang, S. Sookhai-Mahadeo, J. S. Bader, P. Hieter, F. Spencer, and J. D. Boeke. 2004. A robust toolkit for functional profiling of the yeast genome. Mol. Cell 16:487-496. [DOI] [PubMed] [Google Scholar]
- 30.Proszynski, T. J., R. W. Klemm, M. Gravert, P. P. Hsu, Y. Gloor, J. Wagner, K. Kozak, H. Grabner, K. Walzer, M. Bagnat, K. Simons, and C. Walch-Solimena. 2005. A genome-wide visual screen reveals a role for sphingolipids and ergosterol in cell surface delivery in yeast. Proc. Natl. Acad. Sci. U.S.A. 102:17981-17986. [DOI] [PMC free article] [PubMed] [Google Scholar]
- 31.Rad, M. R., H. L. Phan, L. Kirchrath, P. K. Tan, T. Kirchhausen, C. P. Hollenberg, and G. S. Payne. 1995. Saccharomyces cerevisiae Apl2p, a homologue of the mammalian clathrin AP beta subunit, plays a role in clathrin-dependent Golgi functions. J. Cell Sci. 108:1605-1615. [DOI] [PubMed] [Google Scholar]
- 32.Rambourg, A., Y. Clermont, J. M. Nicaud, C. Gaillardin, and F. Kepes. 1996. Transformations of membrane-bound organelles in sec14 mutants of the yeasts Saccharomyces cerevisiae and Yarrowia lipolytica. Anat. Rec. 245:448-458. [DOI] [PubMed] [Google Scholar]
- 33.Rodriguez-Boulan, E., and A. Musch. 2005. Protein sorting in the Golgi complex: shifting paradigms. Biochim. Biophys. Acta 1744:455-464. [DOI] [PubMed] [Google Scholar]
- 34.Rothman, J. H., C. K. Raymond, T. Gilbert, P. J. O'Hara, and T. H. Stevens. 1990. A putative GTP binding protein homologous to interferon-inducible Mx proteins performs an essential function in yeast protein sorting. Cell 61:1063-1074. [DOI] [PubMed] [Google Scholar]
- 35.Sancak, Y., T. R. Peterson, Y. D. Shaul, R. A. Lindquist, C. C. Thoreen, L. Bar-Peled, and D. M. Sabatini. 2008. The Rag GTPases bind raptor and mediate amino acid signaling to mTORC1. Science 320:1496-1501. [DOI] [PMC free article] [PubMed] [Google Scholar]
- 36.Schiestl, R. H., and R. D. Gietz. 1989. High efficiency transformation of intact yeast cells using single stranded nucleic acids as a carrier. Curr. Genet. 16:339-346. [DOI] [PubMed] [Google Scholar]
- 37.Sekiguchi, T., N. Hayashi, Y. Wang, and H. Kobayashi. 2008. Genetic evidence that Ras-like GTPases, Gtr1p, and Gtr2p, are involved in epigenetic control of gene expression in Saccharomyces cerevisiae. Biochem. Biophys. Res. Commun. 368:748-754. [DOI] [PubMed] [Google Scholar]
- 38.Sertil, O., R. Kapoor, B. D. Cohen, N. Abramova, and C. V. Lowry. 2003. Synergistic repression of anaerobic genes by Mot3 and Rox1 in Saccharomyces cerevisiae. Nucleic Acids Res. 31:5831-5837. [DOI] [PMC free article] [PubMed] [Google Scholar]
- 39.Sherman, F. 2002. Getting started with yeast. Methods Enzymol. 350:3-41. [DOI] [PubMed] [Google Scholar]
- 40.Sikorski, R. S., and P. Hieter. 1989. A system of shuttle vectors and yeast host strains designed for efficient manipulation of DNA in Saccharomyces cerevisiae. Genetics 122:19-27. [DOI] [PMC free article] [PubMed] [Google Scholar]
- 41.Simons, K., and W. L. C. Vaz. 2004. Model systems, lipid rafts, and cell membranes. Annu. Rev. Biophys. Biomol. Struct. 33:269-295. [DOI] [PubMed] [Google Scholar]
- 42.Valdivia, R. H., D. Baggott, J. S. Chuang, and R. W. Schekman. 2002. The yeast clathrin adaptor protein complex 1 is required for the efficient retention of a subset of late Golgi membrane proteins. Dev. Cell 2:283-294. [DOI] [PubMed] [Google Scholar]
- 43.Wang, Y., Y. Kurihara, T. Sato, H. Toh, H. Kobayashi, and T. Sekiguchi. 2009. Gtr1p differentially associates with Gtr2p and Ego1p. Gene 437:32-38. [DOI] [PubMed] [Google Scholar]
- 44.Weiderhold, K. N., D. A. Randall-Hlubek, L. A. Polin, E. Hamel, and S. L. Mooberry. 2006. CB694, a novel antimitotic with antitumor activities. Int. J. Cancer 118:1032-1040. [DOI] [PubMed] [Google Scholar]
- 45.Wullschleger, S., R. Loewith, and M. N. Hall. 2006. TOR signaling in growth and metabolism. Cell 124:471-484. [DOI] [PubMed] [Google Scholar]


