Abstract
Perisomatic GABAergic input appears spared or even increased in intractable temporal lobe epilepsy, and has been suggested to contribute to the generation of pathological discharges. Nevertheless, its degree of functional activity during epileptiform synchronization has not been thoroughly investigated. Thus, it remains unclear how structural preservation or loss of domain-specific GABAergic input may affect the network. Here, we have taken advantage of a model of epileptiform activity in vitro to quantify the charge transfer provided by perisomatic GABAA receptor-mediated input to CA1 pyramidal neurons during interictal-like bursts. By recording both firing in GABAergic interneurons and the charge transfer generated by unitary postsynaptic currents to target pyramidal cells, we have estimated the charge transfer that would be dynamically generated by the recruitment of the entire pool of perisomatic-targeting interneurons and the number of perisomatic-targeting interneurons that would be required to generate the experimentally observed GABAergic input. In addition, we have recorded and compared the dynamics and charge density of GABAergic input recorded at different membrane compartments such as the soma vs. the proximal dendrite. Our results suggest that GABAA receptor-mediated perisomatic input is massively activated during burst synchronization and that its kinetic properties and charge density are similar at the soma and proximal dendrite. These functional results match structural data published by other laboratories very well and strengthen the hypothesis that the potential preservation of perisomatic GABAergic input in intractable epilepsies may be a key factor in the generation of pathological network activity.
Introduction
GABAergic inhibitory input to pyramidal cells is critical for the regulation of cortical circuits (Freund & Buzsaki, 1996), and its dysfunction has been proposed to underlie specific forms of intractable epilepsy (Cohen et al. 2002; Berg, 2008). Different classes of interneurons release GABA onto specific postsynaptic domains of target cells (Klausberger & Somogyi, 2008). In particular, the domain specificity of GABAergic input has been associated with complex network functions. Perisomatic inhibition (i.e. GABAergic input to the soma, axon initial segment and thick proximal dendrites) is considered critical for the emergence and regulation of synchronous population activity (Cobb et al. 1995), whereas more distal dendritic inhibition is believed to be important for the regulation of excitatory input, synaptic plasticity and calcium electrogenesis (Miles et al. 1996). Work on hippocampal tissue from patients suffering from temporal lobe epilepsy (Wittner et al. 2005) and from animal models (Cossart et al. 2001; Ang et al. 2006) has suggested that epilepsy impairs dendritic inhibition, whereas perisomatic input remains intact, if not potentiated (Cossart et al. 2005). This has led to the hypothesis that preserved perisomatic inhibition by itself may contribute to pathological activity in some intractable epilepsies, and would explain why, in these cases, drugs enhancing GABAergic neurotransmission fail (Maglóczky & Freund, 2005; Mazarati, 2005).
Indeed, it is important to underscore that the biophysical properties of GABAA receptors (Bormann et al. 1987) have the potential to mediate excitatory effects (Andersen et al. 1980) physiologically (Gulledge & Stuart, 2003; Szabadics et al. 2006; but see Glickfeld et al. 2008), and following the activity-dependent collapse of transmembrane chloride gradients (Thompson & Gähwiler 1989a; Staley et al. 1995) or pathological alteration of intracellular chloride homeostasis that may occur in epileptic networks (Cohen et al. 2002; Huberfeld et al. 2007; Pathak et al. 2007). Depolarization mediated by perisomatic GABAA receptors is particularly critical because of the proximity to the axonal action potential initiation site (Colbert & Johnston, 1996; Szabadics et al. 2006). Furthermore, synchronous firing of GABAergic networks of interneurons increases extracellular potassium concentrations that further promote epileptiform activity in vitro and may precipitate seizure-like electrographic events (Kaila et al. 1997; Voipio & Kaila, 2000; Barbarosie et al. 2002).
Despite the interest in perisomatic ‘inhibition’ as a mechanism involved in epilepsy, its dynamics during epileptiform activity have not been investigated. Thus, it remains unclear to what degree structural preservation vs. loss of domain-specific GABAergic input would make a difference during epileptiform synchronization.
Work in slices from adult animals has suggested that the recruitment of perisomatic GABAergic input during interictal-like discharges is weak (Staley et al. 1998), although strong firing in dendritic-targeting interneurons has also been reported (Spamapanato & Mody, 2007). In contrast, apparently powerful GABAergic input (Aradi & Maccaferri, 2004) and interneuronal firing (McBain, 1995) have both been reported in slices from juvenile animals.
Here, we have taken advantage of slices prepared from juvenile rats to directly explore the quantitative dynamics and spatial profile of perisomatic GABAergic input during synchronized bursts. Our results indicate that perisomatic-targeting interneurons massively release GABA during interictal-like synchronization, and reinforce the hypothesis that preserved perisomatic GABAergic input plays a role in some forms of intractable epilepsies.
Methods
Ethical approval
Killing was performed according to Northwestern University Institutional Animal Care and Use Committee (IACUC) approved protocols. Rats were placed in an induction chamber, and deeply anaesthetized by isoflurane. Lastly, they were decapitated, which is in compliance with the guidelines provided both by the IACUC of Northwestern University and the NIH.
Slice preparation
Slices were prepared from young Sprague–Dawley rats (P12–P18). Following deep anaesthesia, rats were quickly decapitated and the brain removed from the skull in a small container filled with chilled ‘cutting’ solution of the following composition (in mm): 234 sucrose, 28 NaHCO3, 2.5 KCl, 1.25 NaH2PO4, 0.5 CaCl2, 7 MgSO4, 7 glucose, 1 ascorbic acid, 3 pyruvic acid saturated with 95% O2–5% CO2 at pH = 7.4. A vibrating microtome (Leica, VT 1000 S) was used to cut sections of 350 μm in chilled ‘cutting’ solution. Slices were then stored in an incubation chamber at 34–35°C for at least 30 min, and then stored at room temperature in artificial cerebrospinal fluid (ACSF) until use. ACSF was of the following composition (in mm): 130 NaCl, 24 NaHCO3, 3.5 KCl, 1.25 NaH2PO4, 2 CaCl2, 1 MgSO4, 10 glucose saturated with 95% O2–5% CO2 at pH = 7.4.
Whole-cell recordings
Conventional somatic or dendritic patch-clamp recordings were performed (Stuart et al. 1993). Slices were superfused with preheated ACSF maintained at a constant temperature (32–35°C). Epileptiform activity was triggered by ‘epileptiform ACSF’ where MgSO4 was omitted, and CaCl2 and KCl were increased to 3 mm and 8.5 mm, respectively.
Cells were observed and selected for recording by means of a 60× IR immersion DIC objective applied to a direct microscope (Zeiss, Germany) equipped with an infrared camera system (DAGE-MTI, Michigan City, IN, USA). An additional 4× magnification was used for experiments involving dendritic recordings. Interneurons were chosen preferentially, but not exclusively, in the CA1 stratum oriens. Pipettes were pulled from borosilicate thin glass capillaries and filled with the appropriate filtered intracellular solution to a final resistance of ∼1.5–3 MΩ or 5–10 MΩ, for somatic and dendritic recordings, respectively. Recordings were carried out using a Multiclamp 700 amplifier (Molecular Devices, Sunnyvale, CA, USA). Data were filtered at 3 kHz and digitized at 10–20 kHz using a Digidata A/D board and the Clampex 9 program suite (Molecular Devices). Series resistances were estimated by injecting a 10 mV step in voltage-clamp configuration. Series resistances were not compensated online, but were corrected offline (Fig. 11A and B) using the algorithm described in detail by Traynelis (1998) and implemented on ChannelLab software (Synaptosoft, Decatur, GA, USA). The fractional voltage and capacitive corrections were set to 1 and 0.5, respectively.
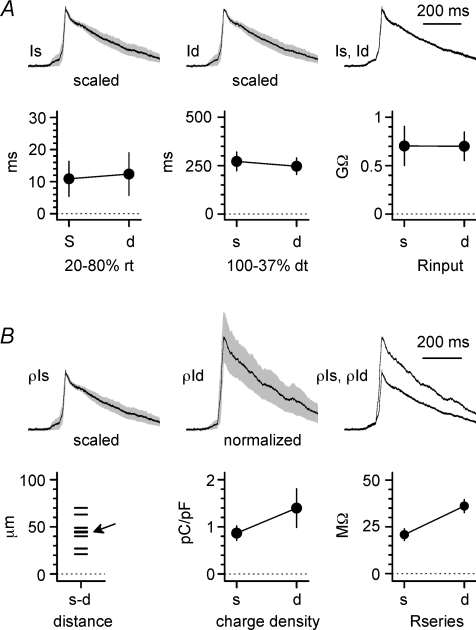
Figure 11. Burst currents recorded in the soma proximal dendrite have similar properties.
A, upper panel: average population burst currents (scaled to unity, grey area is ±s.e.m.) simultaneously recorded at the soma (Is, left), proximal dendrite (Id, middle), and shown superimposed (Is, Id, right). Notice the similar kinetics. Lower graphs are summary plots of kinetic parameters (20–80% rise-time, left; 100–37% decay-time, middle) measured in individual recordings at the soma (s) or dendrite (d). The right panel shows membrane input resistance simultaneously measured by the somatic (s) and dendritic (d) electrode. B, upper panels show the scaled current density measured at the soma or proximal dendrite (ρIs, ρId, respectively). Somatic traces were scaled to unity, whereas dendritic recordings were normalized in order to maintain the correct proportions. Traces are shown as population averages ±s.e.m. (grey areas) for the soma (ρIs, left), proximal dendrite (ρId, middle), and superimposed (ρIs, ρId, right). Lower plots show the inter-electrode distance for all the experiments (left), the calculated charge density (middle), and the series resistances at the somatic (s) and dendritic (d) electrode (right). The arrow indicates two data points particularly close and difficult to distinguish.
Intracellular solutions
We used two different types of intracellular solutions, as follows.
Solution for current-clamp recordings: (in mm): 125 potassium methylsulfate, 4 ATP-Mg2, 10 NaCl, 0.3 GTP, 16 KHCO3 plus biocytin (2.5–5 mg ml−1) equilibrated with 95% O2–5% CO2 to a pH = 7.3.
Solution for voltage-clamp recordings: (in mm): 125 potassium methylsulfate (or KF in Fig. 2A and B), 4 ATP-Mg2, 10 NaCl, 0.3 GTP, 16 KHCO3, 10 N-2(2,6-dimethylphenylcarbamoylmethyl) triethylammonium chloride (QX-314-Br) plus biocytin (2.5–5 mg ml−1) equilibrated with 95% O2–5% CO2 to a pH = 7.3. QX-314 was included in the intracellular solution at high concentration in order to block voltage-dependent conductances and GABAB receptor-operated potassium currents. Junction potential was experimentally measured as ∼10 mV and corrected online.
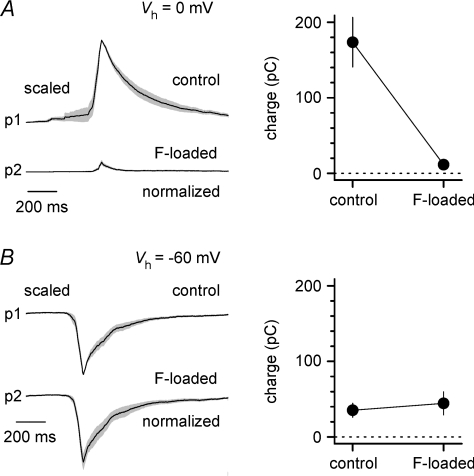
Figure 2. Burst currents at 0 mV are mediated by GABAA receptors.
A, simultaneous voltage-clamp recordings from pyramidal neurons using standard (p1) or fluoride-loaded pipettes (p2) reveal fluoride-dependent blockade of burst currents recorded at 0 mV, but not at −60 mV. Left panel, average traces ± standard error (grey area) from n= 10 experiments. The peak of the traces from cells recorded with control pipettes were scaled to unity prior to averaging, whereas events from the fluoride-loaded cells were normalized to maintain the correct peak proportions. Right panel, summary plot of the charge transfer of burst currents recorded at 0 mV. Notice the large difference between control and fluoride-loaded neurons. B, identical to A, but holding potential was −60 mV. Notice the lack of effect of fluoride on burst currents recorded at this voltage.
Drugs
Gabazine, d-AP5 and NBQX were from Tocris Cookson. QX-314-Br was from Alomone Laboratories.
Analysis of evoked inhibitory postsynaptic currents
Inhibitory postsynaptic currents (IPSCs) were evoked by Pt–Ir stimulating electrodes (Frederick Haer & Co., Bowdoinham, ME, USA) positioned in stratum pyramidale and connected to a constant current isolation unit (WPI, Sarasota, FL, USA). Stimulation was delivered for 150 μs in the range between 19 and 65 μA (38 ± 0.3 μA, n= 13) at 0.33 Hz or in trains of three stimuli at 50 Hz with an inter-train interval of 1 Hz. When evoked at 0.33 Hz, 20 individual responses were averaged and the amplitude of the resulting IPSC was measured and plotted (Fig. 8). The average response to a single stimulus in the train (indicated by  in Fig. 8) was obtained as follows. First, 20–50 train sweeps were averaged. Then, the individual responses within the train were aligned on their stimulating artifact and their mean was extracted.
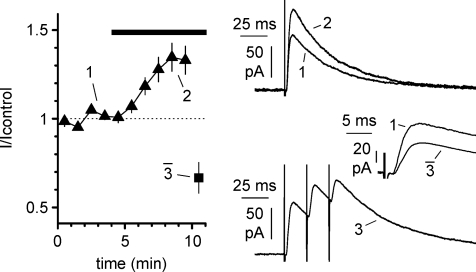
Figure 8. Short-term plasticity induced in epileptiform ACSF by stimulation patterns similar to burst activity.
The main plot shows the time course of the normalized amplitude of pharmacologically isolated IPSC evoked by stimulation of stratum pyramidale at 0.33 Hz (filled triangles) during the transition to epileptiform ACSF (black bar). Notice that switching to a stimulation pattern resembling epileptiform bursts (filled square: trains of three stimuli at 50 Hz with an inter-train interval of 1 s) produces a strong depression of the amplitude of the averaged IPSC during the trains. The upper right inset shows superimposed traces of the evoked IPSC in control vs. epileptiform ACSF (1 and 2, respectively). The lower inset shows the average response to a stimulation train (3), whereas the middle panel shows the control IPSC (1) superimposed to the mean of the three IPSCs evoked during the train ( ). d-AP5 (50 μm) and NBQX (20 μm) were present throughout the experiment.
Analysis of spontaneous burst currents
Spontaneous currents recorded in voltage-clamp at a holding potential of 0 mV were analysed using the Clampfit 9.0 (Molecular Devices), Origin Pro7.0 (Originlab, Northampton, MA, USA), Prism 3.0 (GraphPad Software), ChannelLab (Synaptosfoft), Microsoft Excel (Microsoft, Redmont, WA, USA), WinEDR and WinWCP (courtesy of Dr J Dempster, University of Strathclyde, UK) suites of programs. Events were first collected using the threshold-based analysis feature of Clampfit, reviewed by visual inspection, and finally aligned on their peak. As the rate of spontaneous bursts is variable across slices, analysis of blockade of burst current by gabazine was performed by calculating the mean current value of 5 s bins, and then averaging the normalized values across slices (Fig. 1C).
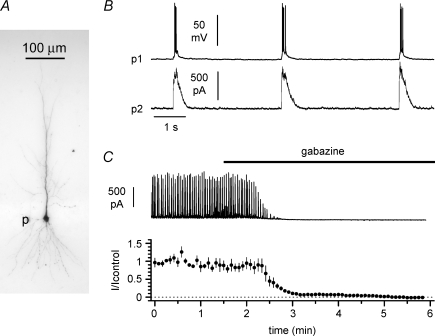
Figure 1. Network-driven activity induced by elevated potassium concentrations (8.5 mm) and omission of Mg2+ (0 mm) in the external bath.
A, post hoc visualization of a biocytin-loaded pyramidal cell (p): notice its extensive dendritic arborization. B, simultaneous recordings from two pyramidal cells under current- (upper trace, p1) and voltage-clamp (lower trace, p2, Vh= 0 mV) configurations. Notice the presence of spontaneous outward currents (burst currents) in cell 2 during epileptiform firing of cell 1. C, spontaneous burst currents at 0 mV were completely abolished by the GABAA receptor gabazine (12.5 μm, black bar). Data from n= 4 recordings.
Paired recordings and statistical analysis of unitary IPSCs
Paired recordings were established from presynaptic interneurons in current-clamp configuration, whereas voltage-clamp mode was imposed to the postsynaptic pyramidal cells. A holding potential of 0 mV was selected in order to increase the driving force for GABAA receptor-mediated currents (estimated reversal potential was −62 mV; see Aradi & Maccaferri (2004) for details). In addition, the holding potential of 0 mV is the assumed reversal potential for excitatory input, and therefore it allows the dissociation of GABAergic input from glutamatergic currents in the presence of epileptiform activity. Unitary IPSCs were first spike-aligned, and then exported as Axon binary files using the WinEDR and WinWCP software (courtesy of Dr J Dempster).
Quantification and comparisons between unitary IPSCs were performed according to two different strategies. Unitary IPSCs evoked in standard ACSF or during the transition to epileptiform ACSF (before the occurrence of burst currents) were either measured individually (Fig. 5C) and compared using a paired t test, or averaged as population unitary IPSCs (Fig. 7A).
Figure 5. Properties of unitary IPSCs recorded at a holding potential of 0 mV.
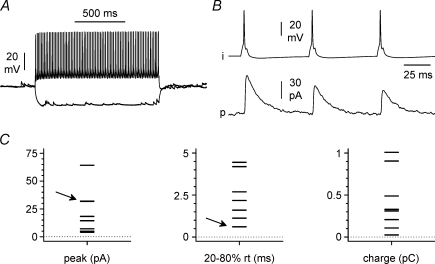
A, response to positive (200 pA), and negative (−100 pA) current step injected in a presynaptic interneuron. Notice the typical fast-spiking firing pattern and the lack of a pronounced hyperpolarizing sag. B, basic properties of the connection between the presynaptic interneuron (i) shown in A and a target pyramidal cell (p): notice the short-term depression on repetitive activation. C, summary plots from eight unitary connections. Notice the large variability in IPSC amplitude, rise-time and charge transfer indicating heterogeneity of the presynaptic interneuronal population. Overlapping data points in the graphs are highlighted by the arrows.
Figure 7. Unitary IPSCs can be detected with a population analysis during epileptiform activity.
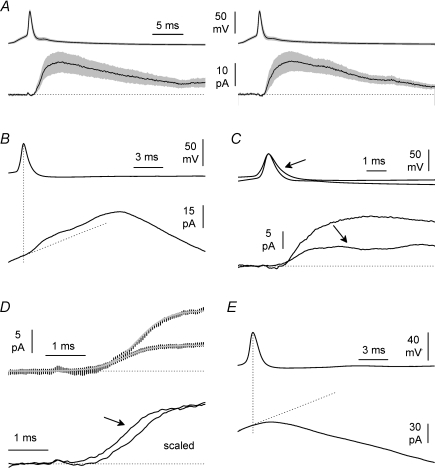
A, population analysis of unitary IPSCs in control ACSF (left) and during the transition to epileptiform ACSF before the development of burst currents (right). Traces are mean ±s.e.m. (grey area) of action potentials triggered in the presynaptic interneurons (upper panels) by current injection, and of unitary IPSCs (lower panels) recorded on target cells. Notice the stability of the recording and the lack of effect before the occurrence of burst currents. B, unitary IPSCs generated by spontaneous firing during epileptiform activity. Only population averages of presynaptic action potentials (upper trace) and postsynaptic membrane currents (lower panel) are shown. Notice the linear fit used as a baseline to correct the non-stationary conditions in the target cell due to burst currents (oblique dotted line). The vertical dotted line is used for reference. C, comparison of unitary IPSCs recorded in control ACSF and during epileptiform activity (after subtraction of the linear drift, arrow). Notice the different amplitudes. D, upper inset: non-linear fits (grey lines) of the raising phases of unitary IPSCs in control vs. epileptiform conditions are significantly different (P < 0.05, F test). The parameters estimated were: Ymax= 13.34 pA, X50= 3.309 ms, S= 1.153 ms−1 for the trace obtained in control ACSF, and Ymax= 5.685 pA, X50= 2.940 ms, S= 1.194 ms−1 for the trace recorded during epileptiform activity. Lower inset: notice the leftward shift of the latency to mid-point of the raising phase of the scaled unitary IPSC when comparing control conditions to epileptiform activity in the presence of burst currents (arrow, after baseline correction as in C and D). E, same population analysis of panel B applied to double recordings with no evidence of synaptic connection. Notice that, in contrast to B, no outward ‘bump’ is visible in the current trace.
When unitary IPSCs recorded during epileptiform activity were involved, only a population analysis was performed because the ratio between the size and variability of burst currents over unitary IPSCs was too large. For example, in Fig. 7D, the rising phases of population average unitary IPSCs recorded in control and epileptiform ACSFs were compared by fitting the data points with a variation of the Hill equation (Motulsky & Christopoulos, 2004):
where Ymax is the maximal current amplitude (pA), X50 is the time of mid-activation (ms), and S is the slope factor (1 ms−1). Fits were compared using an F test based on the calculation of the sum of squared errors obtained either fitting the curves separately or by considering all the data points combined. F was calculated as follows:
where SScombined is the sum of squares obtained from the combined fit, whereas SSseparate is the addition of the sum of squares obtained from separate fits. DFcombined and DFseparate are the degrees of freedom under the two different conditions.
The detection of unitary IPSCs during epileptiform synchronization was complicated by the lack of a stable baseline during spontaneous burst currents, which reduced the signal to noise ratio. Nevertheless, we reasoned that the averaged unitary IPSC occurring during burst currents could be identified if its initial rising phase and decay appeared as an outward ‘bump’ in the population trace of the pyramidal cells recorded under voltage-clamp. Baseline drift during the very short time required to observe the rising phase unitary IPSC was assumed linear, and corrected by linear fit. The time window selected for the fit included the initial 0.5 ms of the 1 ms period preceding the presynaptic action potential peak in the presynaptic cell (Fig. 7B and E).
General organization of double recordings
Double recordings were initiated in control ACSF and evaluated for synaptic connectivity. Overall, eight double recordings presented in this work were found synaptically connected (Fig. 5). Of these eight paired recordings, seven could be held long enough after the transition to epileptiform ACSF to produce spike-aligned averages for the evaluation of the unitary IPSC (Fig. 7). Spike timing of interneurons in epileptiform ACSF (Figs 3 and 4) was analysed in a total of 12 double recordings, of which only five were part of the previously mentioned seven synaptically connected pairs observed in epileptiform ACSF. The remaining two synaptically connected pairs were not used for the spike-timing analysis because the structure of the burst current recorded in the pyramidal cell was highly irregular and made burst alignment problematic. The other seven double recording used in the spike timing analysis were not synaptically connected. Also, intra-burst instantaneous frequency values are reported only in 11 of these 12 recordings because one interneuron tended to fire only single spikes per cycle, thus preventing the calculation of instantaneous frequencies.
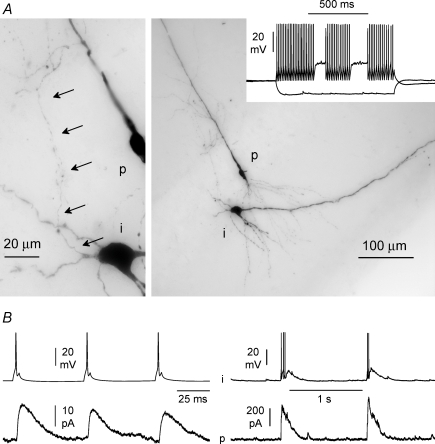
Figure 3. Variable spike timing in interneurons during burst currents.
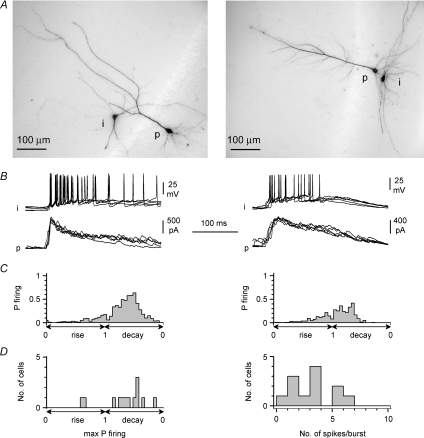
A, anatomical identification of interneuron (i)–pyramidal cell (p) pairs simultaneously recorded during epileptiform activity. Left panel shows a multipolar interneuron in stratum radiatum, whereas a horizontal stratum oriens interneuron is shown in the right panel. B shows their respective firing patterns (i) during burst currents simultaneously recorded in the neighbouring pyramidal cells (p) at Vh= 0 mV. Five consecutive events are superimposed: notice the similarity of spike timing despite the different anatomy of the recorded interneurons. C, quantification of spike timing relative to GABAergic input dynamics. Plots show the distributions of the probability of firing of the interneurons during rise and decay time of burst currents measured on the paired pyramidal cells. Please notice that the X axis used in these plots (and panel D, left) are linear with respect to the % of rise and decay of the burst current, but not time. D, left: summary graph showing the distribution of the maximal probability of firing during epileptiform GABAA receptor-mediated currents in a sample of 12 interneuron/pyramidal cell dual recordings. Notice that in the majority of cases maximal probability of firing occurs in the decay phase of the burst currents. Right: summary plot of the number of action potential generated during each burst current from the same dual recordings.
Figure 4. Further properties of firing in interneurons during epileptiform activity.
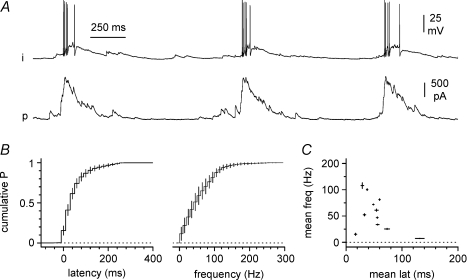
A, simultaneous activity in a double recording between an interneuron (i) held in current-clamp and a pyramidal cell (p) held at 0 mV in voltage-clamp. B, summary plots show the averaged distributions of: left, the latencies between the action potentials in the interneurons and the 20% point on the rise time of the average burst current simultaneously recorded in the companion pyramidal cell; middle, the instantaneous frequency observed in the interneuron during bursts; and right, the relationship between the individual parameters in each double recording.
General statistical methods
Data are presented as mean ±s.e.m. except from the cases in which population analysis for unitary IPSCs was employed. In those cases, only the mean is given because variability would be mainly related to burst currents, which were of much larger amplitude than unitary IPSCs in individual recordings. Standard paired, unpaired t tests, and repeated measures ANOVA with Newman–Keuls multiple comparison post hoc tests were employed. Significance level was set at 0.05.
Scaling and normalization of traces
Scaling of the traces to unity before averaging for population analysis was used to give to each individual experiment the same weight (and avoid an unequal contribution biased by the different amplitude of the epileptiform currents recorded in different cells: Figs 2A and B, 11B and 12A) or for kinetic analysis (Figs 7E and 11A). When double recordings were performed, the traces resulting from the second cell of the pair (Fig. 2A and B) or from the additional membrane compartment (i.e. soma vs. dendrite, see Figs 11B and 12A) were also normalized to the original amplitude of the first recording. This procedure ensured that the relative proportions of the currents observed in the simultaneously recorded cells (or membrane compartments) were preserved after the first scaling.
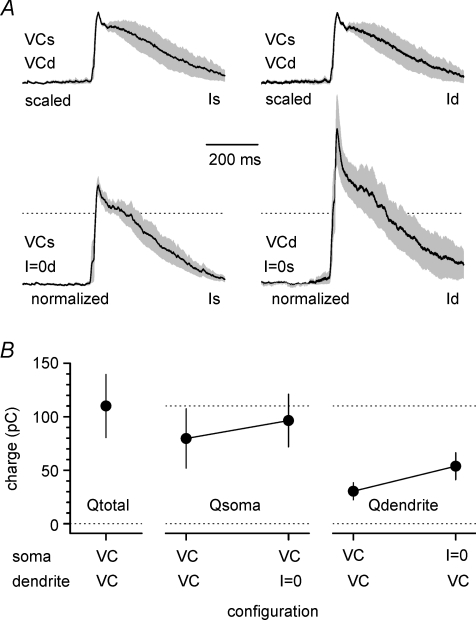
Figure 12. Burst currents recorded at the soma and proximal dendrite in various experimental settings reveal their predominant origin.
A, burst currents recorded under double voltage-clamp configuration (soma, Is; dendrite, Id, Vh= 0 mV at both sites) are smaller than events recorded at the same site in mixed voltage-/current-clamp configuration. Mean traces from individual experiments were scaled to unity and then averaged to build the population curves under double voltage-clamp configuration. The traces reflecting the current recorded under mixed voltage-/current-clamp configuration were normalized to maintain the proportions and show the effect of switching from double to single voltage-clamp. Averages ±s.e.m. in the insets are shown by the black lines and grey areas, respectively. Compare the current recorded by the somatic electrode under double (left, upper inset) or single voltage-clamp (left, lower panel). Similarly, the effect of switching from double voltage-clamp to mixed configuration on the dendritic events is shown in the right top and lower panels, respectively. B, summary plot indicating the charge transfer recorded at the soma and the dendrite under the various experimental configurations (voltage-clamp, VC; current-clamp, I = 0). Notice also the sum of the calculated charge transfer at the soma and dendrite under double voltage-clamp is larger than the charge transfer measured by any individual electrode under single voltage-clamp configuration.
Visualization of recorded cells and reconstruction
Methods were similar to the ones described in Maccaferri & Dingledine (2002). Briefly, slices were fixed for 1–10 days in a 4% paraformaldehyde phosphate-buffered saline (PBS) solution at 4°C. Endogenous peroxidase activity was removed by incubating the slices in 10% methanol, 1% H2O2 PBS solution. Biocytin staining was processed using an avidin–HRP reaction (Vectastain ABC Elite Kit; Vector Laboratories, Burlingame, CA, USA) and axon visualization was improved using a PBS solution containing NiNH4SO4 (1%) and CoCl2 (1%). Slices were not resectioned, but directly mounted on the slide using an aqueous mounting medium (Vectashield; Vector Laboratories), observed at 20–40× magnification and photographed using the AxioVision software package (Zeiss, Germany). Contrast and brightness of the entire figure were adjusted digitally with Adobe Photoshop (Adobe, San Jose, CA, USA).
Results
In order to elicit epileptiform activity, slices were bathed in a modified ACSF with elevated (8.5 mm) external potassium concentration and nominally 0 mm magnesium (epileptiform ACSF). The typical interictal-like pattern of activity recorded from CA1 pyramidal neurons (Fig. 1A and B) was associated with putative GABAergic input (measured as an outward current at a holding potential of 0 mV, which is the assumed reversal potential of glutamatergic excitatory input). Henceforth, we will refer to these currents as ‘burst currents’ or ‘epileptiform currents’. In order to verify that burst currents were mediated by GABAA receptors, we superfused the slice with gabazine (12.5 μm), which is a GABAA receptor antagonist. Pharmacological blockade of GABAA receptors in the slice completely abolished the burst currents in four CA1 pyramidal neurons (Fig. 1C), similarly to what has previously been reported in the CA3 subfield (Aradi & Maccaferri, 2004). However, exposure of the entire slice to gabazine may indirectly result in enhanced GABA release and stronger activation of GABAB receptors (Scanziani et al. 1991; Scanziani, 2000) because of decreased inhibition of GABAergic interneurons themselves. Given that presynaptic GABAB receptors depress glutamate release at excitatory synapses (Davies & Collingridge, 1996; Lei & McBain, 2003) and postsynaptic GABAB receptors trigger a slow inhibitory postsynaptic potential on pyramidal cells and interneurons (Dutar & Nicoll, 1988; Lacaille, 1991), the combination of these effects could potentially shut down the network and explain the disappearance of burst currents. Therefore, gabazine-induced abolishment of burst currents does not prove unequivocally that they are indeed mediated by GABAA receptors. We ruled out this possibility by blocking GABAA receptors selectively in one pyramidal cell, without affecting the rest of the slice.
Simultaneous double whole-cell recordings were performed from pyramidal neurons using different intracellular solutions. In the first cell, a standard voltage-clamp solution was used, whereas the second neuron was recorded with a fluoride-loaded pipette in order to suppress GABAA receptor-mediated currents (Bormann et al. 1987). A clear difference was observed in burst currents recorded at a holding potential of 0 mV (assumed reversal potential for glutamatergic input, Fig. 2A), which resulted in a calculated charge transfer of 173 ± 33 pC, compared to 12 ± 4 pC (P < 0.05, n= 10 double recordings, paired t test). In contrast, excitatory burst currents recorded at a holding potential (−60 mV) close to the estimated reversal potential for GABAA receptor-mediated currents were not different in the same pair of neurons (35 ± 9 pC, compared to 44 ± 15 pC, P > 0.05, n= 10 double recordings, paired t test, Fig. 2B). This result indicates that burst currents recorded at 0 mV are, under our experimental conditions, virtually completely mediated by GABAA receptors. Therefore, the complete loss of burst currents at 0 mV following gabazine application is unlikely to result from an indirect shut-down of glutamatergic synchrony in the network, but reflects the direct blockade of GABAA receptor-mediated currents at the reversal potential of excitatory synaptic input, which remains active. Next, we decided to examine spike timing in interneurons (Fig. 3A and B) and relate it to the dynamics of network-driven GABAergic input on pyramidal cells in slices exposed to epileptiform ACSF. Since the original demonstration of cell type-specific short-term plasticity of excitatory input in hippocampal interneurons (Ali & Thomson, 1998; Ali et al. 1998), work by several groups (Reyes et al. 1998; Pouille & Scanziani, 2004; Silberberg & Markram, 2007; Kapfer et al. 2007) has suggested that this factor may contribute to the time-specific recruitment of distinct classes of interneurons in cortical circuits at sparse levels of activity. However, additional factors (for example, activation of intrinsic excitatory conductances) may be involved during stronger network-driven excitation. We performed simultaneous recordings from a total of 12 interneurons and pyramidal cells. The majority of the interneurons were located in stratum oriens (n= 10), close to the additionally recorded pyramidal cells, whereas in the remaining two cases interneurons were located in stratum radiatum (Fig. 3A). In three cases, the dendrites of the stratum oriens interneurons were mainly oriented along a ‘horizontal’ axis parallel to stratum pyramidale (Maccaferri, 2005), whereas in five cases the dendritic tree was more multipolar/vertically oriented. In two cases, the morphology of the dendritic tree could not be determined. The remaining two interneurons located in stratum radiatum had a clear multipolar appearance. In most cases, the thickness of the slices did not allow a clear identification of the axon.
The time of occurrence of spikes in interneurons was expressed as a fraction of the rise or decay phase of the average GABAA receptor-mediated burst current in the simultaneously recorded pyramidal neurons (Fig. 3C). The maximal probability of firing for individual cells could fall either early in the rising phase of the burst current or during its decay phase. As illustrated in Fig. 3A,B, and C, anatomically distinct interneurons could show similar patterns of activity. Out of 12 double recordings, two interneurons displayed their maximal probability of firing during the rise vs. 10 during the decay phase (Fig. 3D). The average number of spikes produced during a burst current cycle was 3.2 ± 0.5 (n= 12, Fig. 3D).
We further characterized the simultaneous activity of interneurons and pyramidal cells by measuring absolute values such as the latency from the spikes observed in interneurons to a 20% time point on the rising phase of the epileptiform current simultaneously recorded in pyramidal cells, the frequency of burst currents, and the instantaneous frequency of the spikes in the bursts generated by the interneurons (Fig. 4A and B). The average latency of action potentials from the 20% of the rising phase of the burst current was 62 ± 12 ms (range 29–150 ms, n= 12), the frequency of burst currents was 0.9 ± 0.1 Hz (range 0.4–1.1 Hz, n= 12) and the instantaneous frequency of the spikes during synchronization was 55 ± 10 Hz (range 7–108 Hz, n= 11 (because in one case only single spikes were generated by the interneuron)). The mean latency and instantaneous firing frequency observed in the interneurons were not significantly correlated (P > 0.05, Fig. 4C). It is important to note that the consistently positive latency measured in our experiments indicates that the recorded interneurons were not involved in the initiation of the epileptiform current, but could contribute to its later phase. A likely explanation is that the burst current is initiated by interneurons activated earlier, which are likely to be positioned closer to the CA3 region, which drives the population cycles (Traub & Miles, 1991). Indeed, anatomical reconstructions of hippocampal basket and axo-axonic cells have revealed a large horizontal spread of their axon, which can span several hundreds microns, and allows interneurons to contact postsynaptic targets distally located along the CA3–CA1–subiculum axis (Freund & Buzsaki, 1996). Interneurons more proximal to the CA3 subfield would be activated with a shorter delay compared to the ones we recorded, which were selected to be as close as possible to the simultaneously recorded pyramidal cell (Fig. 3A).
Therefore, in order to directly show that synaptic release of GABA from interneurons contributes to the burst currents, we took advantage of double recordings from interneuron → pyramidal cell connected pairs (Miles & Poncer, 1996).
First, we recorded unitary GABAergic postsynaptic currents at 0 mV in standard ACSF (i.e. containing 3.5 mm potassium, 2 mm calcium and 1 mm magnesium concentrations, see Methods for details). Then, the same connection was observed after switching to epileptiform ACSF (i.e. containing 8.5 mm potassium, 3 mm calcium and 0 mm magnesium, see Methods for details). Figure 5A and B show the properties of an identified connection between a fast-spiking interneuron and a pyramidal cell in control conditions. Similar to a previous report (Maccaferri et al. 2000), unitary IPSCs have a large range of amplitude and kinetics. From a sample of eight paired recordings (Fig. 5C), we measured an average peak amplitude of 22.1 ± 7.2 pA (range: 4.1–64.3 pA at a Vh= 0 mV), 20–80% rise-time of 2.2 ± 0.5 ms (range: 0.6–4.4 ms), and charge transfer of 0.4 ± 0.1 pC (range: 0.0–1.0 pC). Figure 6A and B show the effect of switching the bath medium from standard to epileptiform ACSF on a connection between a dendritic-targeting interneuron and a pyramidal cell. Because of the appearance of spontaneous burst currents in the presence of epileptiform ACFS, it was difficult to distinguish unitary events.
Figure 6. Properties of the unitary IPSC between a dendritic-targeting stratum oriens interneuron and a pyramidal cell.
A, anatomical identification of the recorded cells at different magnifications. Left: notice the axon (arrows) emerging from the interneuron (i) and running towards the thick proximal dendrite of the pyramidal cell (p). Right: the dendritic arborizations of the two cells are shown at lower magnification. Inset shows the firing pattern of the interneuron in response to a 200 pA depolarizing step and the membrane response to a hyperpolarizing current pulse of −100 pA. B, unitary IPSCs recorded at 0 mV in standard (left) and epileptiform ACSF (right). Action potentials were triggered in standard ACSF by brief (5 ms duration) current pulses (500 pA amplitude). Activity shown in epileptiform ACSF was spontaneous. The co-occurrence of firing in the presynaptic interneuron and large burst currents in pyramidal cells made it difficult to distinguish the unitary IPSC in single sweeps.
Therefore, we decided to perform a kinetic analysis using data from seven synaptically connected interneuron → pyramidal cells. First, we monitored unitary IPSCs in standard ACSF, then during the transition to epileptiform ACSF, and finally, in the presence of epileptiform ACSF and burst currents. In the first two cases, postsynaptic currents were aligned according to spikes triggered by current injection in the presynaptic neurons, whereas spontaneous action potentials were used for alignment during epileptiform activity. As shown in Fig. 7A, the average unitary IPSCs did not change much during the transition from control conditions to epileptiform ACSF (before the appearance of burst currents). The average peak amplitude in standard ACSF was 16.1 ± 4.5 pA, which compared to 16.3 ± 4.2 pA (P > 0.05, n= 7, paired t test) in the transition period. The half-widths of the presynaptic spikes recorded in the interneuron in control vs. the transition period were also unchanged (0.6 ± 0.1 ms vs. 0.6 ± 0.1 ms, respectively, P > 0.5, n= 7, paired t test) suggesting that the ionic conditions of the extracellular fluid in the slices had not reached the desired concentrations yet, most probably because of the potassium buffer capability of the slice (Kofuji & Newman, 2004). In six out of seven recordings, burst currents were clearly identifiable in the postsynaptic pyramidal cell. In the remaining recording, increased synaptic input forming compound events was clearly visible, but the structure of burst currents appeared less synchronized. All seven pairs were included in the analysis.
When we examined the postsynaptic unitary response during the occurrence of epileptiform activity, a ‘bump’ was visually detected in the population average trace (Fig. 7B). Because of the fast rise-time of the averaged unitary IPSC compared to averaged burst currents, we reasoned that it should be possible to distinguish the kinetics of activation of the unitary IPSC by eliminating the baseline drift due to the non-stationary membrane current conditions during the burst currents. Therefore, we corrected the postsynaptic response for baseline drift by subtracting a linear fit of a short period preceding the action potential peak (see Methods for details). This procedure yielded a postsynaptic response that was ∼45% of the amplitude of the population average unitary IPSC recorded in control conditions (Fig. 7C: the peak of the population average unitary IPSC was 14.7 pA in control vs. 6.6 pA during epileptiform activity). We corroborated this observation by fitting the rising phase of the population unitary IPSCs, which were significantly different (Fig. 7D, P < 0.05, F test, see Methods for details). Interestingly, the latency from the action potential peak to the mid-point of the raising phase of the population average unitary IPSC was decreased (the leftward shift of the mid-point was 0.35 ms, see Fig. 7D). This was to be expected because of the higher extracellular concentration of calcium in the epileptiform ACSF (Sabatini & Regehr, 1996; Boudkkazi et al. 2007). In contrast, a similar population analysis performed on seven double recordings where no evidence of synaptic connections was found, failed to reveal any ‘bump’ indicative of unitary IPSCs (Fig. 7E). Thus, taken together, these results confirmed that activation of interneurons during burst currents is associated with reduced, but detectable neurotransmitter release on their postsynaptic target cells.
At first glance, the decreased amplitude of the unitary IPSC in regular vs. epileptiform ACSF may appear surprising, given the increased extracellular calcium concentration of this latter solution. However, an important factor to be considered is that, in standard ACSF, presynaptic interneurons were artificially driven by current pulses at 0.33 Hz, whereas in epileptiform ACSF, action potentials were spontaneously generated by the network at higher and more variable frequencies, as described above (Fig. 4B).
We corroborated this interpretation by designing an experiment in which the effect of different stimulation frequencies was monitored on pharmacologically isolated IPSCs evoked by local stimulation of stratum pyramidale in the presence of ionotropic glutamate receptor antagonists (d-AP5, 50 μm and NBQX 20 μm). As shown in Fig. 8, IPSCs evoked at 0.33 Hz were increased by the transition from regular to epileptiform ACSF (from 93 ± 13 pA to 117 ± 14 pA, P < 0.05, n= 13, repeated measures ANOVA with Newman–Keuls multiple comparison test). However, when fibres were then stimulated with a frequency pattern similar to the spontaneous firing observed in interneurons exposed to epileptiform ACSF (Fig. 3, trains of 3 stimuli at 50 Hz with inter-train frequency of 1 Hz), strong short-term depression of the IPSC was observed. When compared to the ones recorded at 0.33 Hz in standard or epileptiform ACSF, the average IPSC evoked by the epileptiform pattern described above was decreased in both cases (51 ± 7 pA, P < 0.05, repeated measures ANOVA with Newman–Keuls multiple comparison test, n= 13).
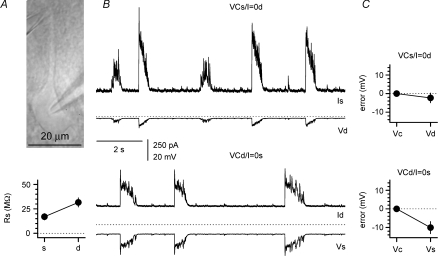
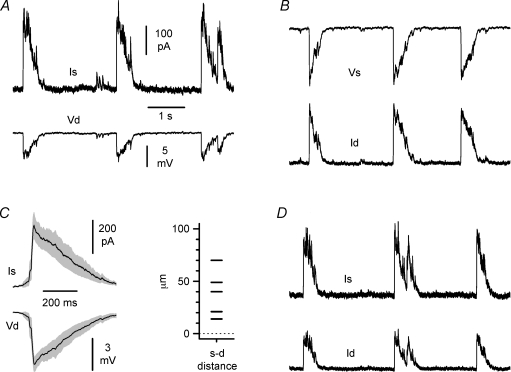
Next, we decided to measure perisomatic GABAergic burst currents recorded at specific cellular domains such as the soma and thick proximal dendrites (Fig. 9A), which receive the highest density of symmetrical synapses (Megías et al. 2001). Simultaneous whole-cell recording were performed from the soma and main proximal dendrite of individual pyramidal neurons under a mixed voltage-clamp/current-clamp (I= 0) configuration (Fig. 9B). These experimental settings allowed the direct monitoring of the steady-state voltage errors associated with the series resistance of the recording electrodes (17 ± 3 MΩ in the somatic electrode vs. 32 ± 5 MΩ in the dendritic pipette, n= 7). As shown in Fig. 9C, a steady-state error of −2.3 ± 2.6 mV was directly observed in the dendrite when voltage-clamp was delivered by the somatic electrode, whereas a deviation of −10.1 ± 3.3 mV from the voltage command was recorded in the soma when the membrane was clamped by the dendritic electrode (linear distance between the electrodes was 39 ± 7 μm). In addition, dynamic errors associated with burst currents were revealed as hyperpolarizations at the current-clamp recording site (Fig. 10A and B), indicating that voltage-clamp with a single electrode does not capture the total burst currents originating from the entire membrane surface of the neuron. The peak average dynamic error associated with somatic voltage-clamp was measured to be 5 ± 1 mV (n= 5 double recordings, average electrode distance was 39 ± 10 μm, Fig. 10C).
Figure 9. Quantification of steady-state errors associated with somatic and dendritic voltage-clamp recordings.
A, IR-DIC image of a simultaneous recording from a pyramidal neuron. The distance between the two pipettes was 40 μm. B, sample traces from mixed voltage-/current-clamp configuration in the soma/dendrite (upper panel) and dendrite/soma (lower panel), respectively. VCs = voltage-clamp at the soma, VCd = voltage-clamp at the dendrite, I = 0s = current-clamp at the soma, I = 0d = current-clamp at the dendrite. Notice the larger currents recorded by the somatic electrode and the larger steady-state and dynamic voltage errors produced by dendritic voltage-clamp. The dashed lines are set for reference at a potential of 0 mV. C, summary plots for the steady-state errors under the two different configurations. Vc indicates the command voltage in the voltage-clamp electrode, whereas Vd and Vs are the potentials measured by the current-clamp pipettes at the dendrite and soma, respectively.
Figure 10. Dynamic errors associated with voltage-clamp and different recording configurations used to study the spatial profile of burst currents.
A and B, mixed voltage-/current-clamp configurations at the soma and the dendrite reveal loss of clamp during burst currents. In A the soma is under voltage-clamp (Vh= 0 mV) and the dendrite is under current-clamp, whereas the opposite configuration is shown in B. Notice the larger errors associated with dendritic voltage-clamp. Is and Id indicate the currents recorded at the soma and dendrite, whereas Vs and Vd refer to the voltage measured at the two membrane compartments. C, left panel, average population analysis of dynamic errors during somatic voltage-clamp from five double recordings. The grey area indicates ±s.e.m. Right panel indicate the inter-electrode distance of these experiments. D, simultaneous voltage-clamp at the somatic and dendritic site. Notice that the size of the currents is reduced compared to A and B. Data in A, B and D form the same double recording.
Next, we attempted to dissect out the components of the burst current generated by the soma and proximal dendrite. We reasoned that, under a simultaneous voltage-clamp configuration at both sites (Fig. 10D), the currents measured by each electrode would predominantly reflect the proximity of the pipette to the specific membrane domain of origin. Thus, the properties of burst currents from the soma and proximal dendrite can be compared. Effects due to the different series resistances were compensated offline using the algorithm described by Traynelis (1998), as described in the Methods. As shown in Fig. 11A, double voltage-clamp revealed burst currents in the soma and dendrites with undistinguishable kinetics (linear distance between the electrodes was 45 ± 6 μm, n= 8). Rise-time was 11 ± 5 ms in the soma vs. 12 ± 7 ms in the dendrite (P > 0.05, n= 8, paired t test), and decay-time was 272 ± 49 ms in the soma vs. 247 ± 43 ms in the dendrite (P > 0.05, n= 8, paired t test). We then normalized burst current charge transfers by membrane capacitance and calculated their charge density (Fig. 11B). No statistically significant differences were found, consistent with the anatomical reports suggesting that the both the soma and thick proximal dendritic shafts receive GABAergic innervation to similar degrees and participate in perisomatic inhibition (Megías et al. 2001; Papp et al. 2001). The charge transfer density at the soma was 0.9 ± 0.3 pC pF−1vs. 1.4 ± 0.4 pC pF−1 at the dendrite (P > 0.05, paired t test). Lastly, we compared the charge transfer calculated from burst currents at the soma vs. the dendrite during simultaneous voltage-clamp conditions or mixed voltage-/current-clamp configurations at the two recording sites (Fig. 12A and B). We reasoned that if somatic and dendritic electrodes recorded purely local events, then the events measured by either electrode should not be influenced by the status (voltage-clamp vs. current-clamp) of the other recording site. In contrast, changes in the amplitude of the burst currents observed at one site induced by switching from voltage- to current-clamp configuration at the other site may be used to determine the degree of overlap of the membrane domains clamped by the two electrodes. The charge transfer calculated from burst currents recorded at the soma increased from 80 ± 28 pC to 96 ± 25 pC (n= 4, P < 0.05, paired t test) when the dendritic site was shifted from voltage- to current-clamp conditions, thus indicating that 17% of the burst current recorded under conditions of single somatic voltage-clamp is of dendritic origin. The charge transfer of burst currents recorded at the dendritic location increased from 30 ± 8 pC to 54 ± 13 pC (n= 4, P < 0.05, paired t test) following the switch of the somatic recording site from voltage- to current-clamp, thus indicating that 44% of the burst current measured by the dendritic electrode is actually of somatic origin. The overall sum of the charge transfer recorded at the soma and at the dendrite during double voltage-clamp was 110 ± 29 pC (n= 4), which reflected 73% of somatic charge transfer compared to 23% contributed by the dendrite. These results indicated that, within the perisomatic compartment, we could partially dissect burst currents originating from the soma vs. proximal apical dendrite.
Discussion
Interneurons of the CA3 region have been suggested to be strongly active during epileptiform activity (Aradi & Maccaferri, 2004). However, direct observation of their postsynaptic effect under epileptiform conditions has not been provided yet. Therefore, in this work, we have re-examined this issue in the CA1 subfield, which presents the advantage of allowing the comparison of functional data estimating perisomatic GABAergic input to quantitative anatomical work detailing the number of GABAergic synapses contacting CA1 pyramidal neurons (Megías et al. 2001).
The main finding of this work is that epileptiform discharges in juvenile CA1 pyramidal cells in vitro are associated with GABAergic input to the perisomatic compartment that can be approximately quantified in terms of number of active presynaptic interneurons. This knowledge is important because perisomatic inhibition, which appears spared during temporal lobe epilepsy, has been proposed to contribute to network dysfunctions (Maglóczky & Freund, 2005; Mazarati, 2005). However, its degree of activity during specific types of epileptiform network dynamics is currently unknown. To our knowledge, this is the first experimental attempt to generate a quantitative estimate.
How many interneurons are necessary to produce a burst current?
According to Megías et al. (2001) an individual CA1 pyramidal neuron receives, on average, a total of 1700 inhibitory synapses, 40% of which are distributed over the perisomatic area. Considering that interneurons establish, again on average, five release sites on their postsynaptic target domains (Han et al. 1993; Gulyás et al. 1993; Buhl et al. 1994; Miles et al. 1996), these numbers suggest the presence of an overall pool of 340 (1700 divided by 5) presynaptic interneurons per every pyramidal cell, 136 of which (340 multiplied 0.4) target the perisomatic area. Our experiments of Figs 2A and 12 indicate that the charge transfer of somatically recorded burst currents is between 173 and 80 pC (datasets were not statistically different: P > 0.05, unpaired t test). Therefore, for the following calculations, we will use an intermediate value of 126 pC. The largest unitary connection recorded (Fig. 5C, charge transfer in control ACSF was 1 pC) was associated with the fastest rise-time kinetics (0.6 ms) and a fast-spiking phenotype, suggesting that the presynaptic interneuron of origin was probably either a basket or axo-axonic cell (Maccaferri et al. 2000). In contrast, the charge transfer from an identified cell targeting the proximal dendrites (Fig. 6A and B) was 0.3 pC. Taking into consideration that, on average, interneurons fire 3.2 action potentials during every burst (Fig. 3D), the contribution of the aforementioned neurons during a burst would generate 3.2 pC and 1.0 pC, respectively. Thus, the average effect of an arbitrarily defined ‘perisomatic’ interneuron would result in 2.1 pC under control conditions. However, our analysis of population unitary IPSCs suggests that a significant reduction of unitary IPSC amplitude does occur during epileptiform activity (∼45%, see Fig. 7C and D). This is most probably explained by short-term depression because of increased firing frequencies during the epileptiform burst, as indicated by our experiments on extracellularly evoked IPSCs. In addition, activation of presynaptic GABAB receptors (Thompson & Gähwiler, 1989b; Lei & McBain, 2003), or reduced clamp efficacy during a burst current (Fig. 10C) could be involved. Therefore, the contribution of an average ‘perisomatic’ interneuron would be reduced to 0.9 pC per burst (2.1 pC multiplied by 0.45). Recruitment of the entire population of 136 perisomatic targeting interneurons would result in burst currents with a charge transfer of 122 pC (0.9 pC multiplied by 136), which is very close to the overall experimental estimate of 126 pC. Similarly, the number of interneurons required to generate a burst current of 126 pC (126 pC divided by 0.9 pC per interneuron) is estimated to be 140, which matches very well the total number of perisomatic-targeting interneurons derived from the work of Megías et al. (2001). Hence, we conclude that perisomatic-targeting interneurons are massively recruited during epileptiform activity under our experimental conditions, potentially involving the entire pool of perisomatically innervating GABAergic cells. Interestingly, work in artificial networks predicted that a larger fraction of interneurons than pyramidal cells should fire during synchronized bursting (see Fig. 7.7. of Traub & Miles, 1991).
Relevance for epilepsy
The importance of GABAergic input to the perisomatic compartment of pyramidal cells is highlighted by the extraordinary density of inhibitory synapses terminating on the soma, proximal dendrites and axon initial segment (Megías et al. 2001; Papp et al. 2001). Massive activation of synaptic GABAA receptors would be expected to hyperpolarize membrane resting potential and hence drive the cell away from action potential threshold, but also to functionally disconnect the action potential initiation site in the axon (Colbert & Johnston, 1996) from the excitatory postsynaptic input originating in the apical dendritic tree. These events are likely to underlie at least some of the therapeutic effects of GABAergic drugs clinically used in the treatment of epilepsy (Rogawski, 2002). In contrast, work from tissue obtained from patients suffering from epilepsy refractory to pharmacological treatment has suggested that, in these specific cases, GABAergic input may depolarize postsynaptic targets and play an excitatory role. In particular, the loss of homeostatic mechanisms that maintain a hyperpolarizing equilibrium potential for GABAA receptors has been underscored (Cohen et al. 2002; Huberfeld et al. 2007). Thus, our data suggest that epileptiform activity would massively activate GABAergic perisomatic input, which is structurally preserved in intractable epilepsy (Wittner et al. 2005). This would be likely to result in depolarization of the perisomatic area, which might spread to more distal dendritic sites receiving excitatory input and reduce voltage-dependent block of NMDA receptors (Nowak et al. 1984; Mayer et al. 1984). Furthermore, the reported observation that GABAergic input during epileptiform activity precedes and outlasts glutamatergic input during a synchronized burst (Aradi & Maccaferri, 2004) suggests that it could be particularly efficient in triggering potentiation of excitatory input (Kampa et al. 2004), and unbalance the network. Lastly, perisomatic input is critically close to the axonal action potential initiation site. For all these reasons, a massively active depolarizing perisomatic GABAergic input would be likely to significantly contribute to pathological activity. Hence, a quantitative estimate of the degree of activity of perisomatic GABAergic input during an interictal-like event is important to understand its potential role in some forms of epilepsy.
Limits of this work
At first glance, the almost ideal match between our data, obtained in slices, and the calculations based on work in vivo may seem surprising. However, although it is undeniable that a certain degree of de-afferentation may occur in a slice, there is no obvious reason to believe that this should significantly affect the estimate of the total burst current more that the estimate of the unitary IPSCs that contribute to it. Therefore, this consideration may explain the good agreement between the total number of perisomatic interneurons estimated in vivo and the fact that a similar number was derived from the ratio between the observed burst currents and unitary IPSCs measured in vitro.
It is equally important to explicitly mention several assumptions that underlie our interpretation of these results. First, the data of Megías et al. (2001) and Papp et al. (2001) refer to adult animal tissue, whereas our experiments were performed on slices obtained from juvenile animals. Therefore, developmentally regulated changes in the total number of GABAergic synapses received by a single pyramidal cell or in the number of release sites established by presynaptic interneurons may affect the presented estimates. It would be very interesting to repeat these calculations using estimates obtained from juvenile animals. However, to our knowledge, these numbers are not available in the literature yet.
The contribution of basket cells used in our calculation could be thought to be more representative of parvalbumin- than cholecystokinin-expressing basket cells (Freund, 2003; Klausberger & Somogyi, 2008) because of the holding potential used to record unitary IPSCs, which could lead to depolarization-induced suppression of inhibition (DSI, Pitler & Alger, 1994). However, it is interesting to note that Földy et al. (2006) have shown that DSI can be overcome by short bursts of high-frequency action potentials, similar to the ones occurring during epileptiform activity. In any case, the relative proportions of different subclasses of interneurons targeting the perisomatic compartment (soma, axon initial segment and thick proximal dendrite; for details see Klausberger & Somogyi, 2008) have not been estimated precisely. Therefore, although the concept of an ‘average perisomatic interneuron’ that we have used for our calculations appears a useful tool, it remains, nevertheless, an artificial construction. The precise estimate of the proportion of all the different classes of interneurons targeting the perisomatic area, and the detailed properties of their unitary IPSCs and burst firing, would be required. Despite its great usefulness, we think that this challenging task would be beyond the purpose of the present work.
Also, burst current recordings were associated with voltage- and space-clamp errors, which are unavoidable when attempting voltage-clamp experiments in central neurons (Williams & Mitchell, 2008). However, while steady-state and dynamic errors associated with dendritic voltage-clamp were severe, errors associated with somatic voltage-clamp were more limited, and their sum was on average less than 10 mV (Figs 9 and 10). For this reason, the above calculations were based on burst current charge transfer obtained from somatic voltage-clamp experiments.
Lastly, this work was performed on slices from normal juvenile animals. Therefore, the validity of our observations is probably limited to the physiology of interneurons during the initial stages of the disease. Cell death, structural or functional plasticity (Franck, 1993; Bernard et al. 2004) in the entire hippocampal circuitry after years of recurrent epileptic discharges may affect the population activity in ways that could not be explored here.
GABAergic epileptiform activity in dendrites
Our results confirm from a physiological standpoint the exquisite similarity of GABAergic innervation of the soma and proximal dendrite, originally detailed by anatomical studies (Megías et al. 2001; Papp et al. 2001). Burst currents recorded in the soma and at proximal dendritic sites under double voltage-clamp configuration appeared kinetically identical and of similar density (Fig. 11A and B). It is indeed important to underscore that the double voltage-clamp configuration is probably the best experimental approach to separate events originating from the two different compartments. Indeed, the results of Fig. 12A and B show that single voltage-clamp recordings at proximal dendrites are heavily contaminated by somatically originated events. It would be extremely interesting to directly record GABAergic input to distal dendrites. However, to our knowledge, recordings from distal dendrites in young animals are technically challenging and most published recordings from distal dendrites have indeed been performed in slices from adult animals.
Conclusions
In conclusion, the results of this work indicate that perisomatic-targeting interneurons are massively recruited and release GABA on their postsynaptic domains during epileptiform activity. The observation of a strongly active perisomatic GABAergic input during epileptiform synchronization strengthens the hypothesis that maintained (or increased) perisomatic input in epileptic patients refractory to pharmacological therapy may contribute to network dysfunctions.
Acknowledgments
We would like to thank Drs R. Dingledine (Emory University), J. Lawrence (University of Montana), M. Martina and G. Shepherd Jr (Northwestern University) for comments on a previous version of the manuscript and discussion. We are also indebted to Dr J. Dempster (University of Strathclyde, UK) for the use of WinEDR and WinWCP software. This work was initially supported by grant MH067561 (from National Institute of Mental Health) and then NS057445 (from the National Institute of Neurological Disorders and Stroke) to G.M.
References
- Ali AB, Deuchars J, Pawelzik H, Thomson AM. CA1 pyramidal to basket and bistratified cell EPSPs: dual intracellular recordings in rat hippocampal slices. J Physiol. 1998;507:201–217. doi: 10.1111/j.1469-7793.1998.201bu.x. [DOI] [PMC free article] [PubMed] [Google Scholar]
- Ali AB, Thomson AM. Facilitating pyramid to horizontal oriens–alveus interneurone inputs: dual intracellular recordings in slices of rat hippocampus. J Physiol. 1998;507:185–199. doi: 10.1111/j.1469-7793.1998.185bu.x. [DOI] [PMC free article] [PubMed] [Google Scholar]
- Andersen P, Dingledine R, Gjerstad L, Langmoen IA, Laursen AM. Two different responses of hippocampal pyramidal cells to application of γ-amino butyric acid. J Physiol. 1980;305:279–296. doi: 10.1113/jphysiol.1980.sp013363. [DOI] [PMC free article] [PubMed] [Google Scholar]
- Ang CW, Carlson GC, Coulter DA. Massive and specific dysregulation of direct cortical input to the hippocampus in temporal lobe epilepsy. J Neurosci. 2006;26:11850–11856. doi: 10.1523/JNEUROSCI.2354-06.2006. [DOI] [PMC free article] [PubMed] [Google Scholar]
- Aradi we, Maccaferri G. Cell type-specific synaptic dynamics of synchronized bursting in the juvenile CA3 rat hippocampus. J Neurosci. 2004;24:9681–9692. doi: 10.1523/JNEUROSCI.2800-04.2004. [DOI] [PMC free article] [PubMed] [Google Scholar]
- Barbarosie M, Louvel J, D’Antuono M, Kurcewicz I, Avoli M. Masking synchronous GABA-mediated potentials controls limbic seizures. Epilepsia. 2002;43:1469–1479. doi: 10.1046/j.1528-1157.2002.17402.x. [DOI] [PubMed] [Google Scholar]
- Berg AT. The natural history of mesial temporal lobe epilepsy. Curr Opin Neurobiol. 2008;21:173–178. doi: 10.1097/WCO.0b013e3282f36ccd. [DOI] [PubMed] [Google Scholar]
- Bernard C, Anderson A, Becker A, Poolos NP, Beck H, Johnston D. Acquired dendritic channelopathy in temporal lobe epilepsy. Science. 2004;305:532–535. doi: 10.1126/science.1097065. [DOI] [PubMed] [Google Scholar]
- Bormann JH, Hamill OP, Sakmann B. Mechanism of anion permeation through channels gated by glycine and γ-aminobutyric acid in mouse cultured spinal neurones. J Physiol. 1987;385:243–286. doi: 10.1113/jphysiol.1987.sp016493. [DOI] [PMC free article] [PubMed] [Google Scholar]
- Boudkkazi S, Carlier E, Ankri N, Caillard O, Giraud P, Fronzaroli-Molinieres L, Debanne D. Release-dependent variations in synaptic latency: a putative code for short- and long-term synaptic dynamics. Neuron. 2007;56:1048–1060. doi: 10.1016/j.neuron.2007.10.037. [DOI] [PubMed] [Google Scholar]
- Buhl EH, Halasy K, Somogyi P. Diverse sources of hippocampal unitary inhibitory postsynaptic potentials and the number of synaptic release sites. Nature. 1994;368:823–828. doi: 10.1038/368823a0. [DOI] [PubMed] [Google Scholar]
- Cobb SR, Buhl EH, Halasy K, Paulsen O, Somogyi P. Synchronization of neuronal activity in hippocampus by individual GABAergic interneurons. Nature. 1995;378:75–78. doi: 10.1038/378075a0. [DOI] [PubMed] [Google Scholar]
- Cohen I, Navarro C, Clemenceau S, Baulac M, Miles R. On the origin of interictal activity in human temporal lobe epilepsy in vitro. Science. 2002;298:1418–1421. doi: 10.1126/science.1076510. [DOI] [PubMed] [Google Scholar]
- Colbert CM, Johnston D. Axonal action-potential initiation and Na+ channel densities in the soma and axon initial segment of subicular pyramidal neurons. J Neurosci. 1996;16:6676–6686. doi: 10.1523/JNEUROSCI.16-21-06676.1996. [DOI] [PMC free article] [PubMed] [Google Scholar]
- Cossart R, Bernard C, Ben-Ari Y. Multiple facets of GABAergic neurons and synapses: multiple fates of GABA signalling in epilepsies. Trends Neurosci. 2005;28:108–115. doi: 10.1016/j.tins.2004.11.011. [DOI] [PubMed] [Google Scholar]
- Cossart R, Dinocourt C, Hirsch JC, Merchan-Perez A, De Felipe J, Ben-Ari Y, Esclapez M, Bernard C. Dendritic but not somatic GABAergic inhibition is decreased in experimental epilepsy. Nat Neurosci. 2001;4:52–62. doi: 10.1038/82900. [DOI] [PubMed] [Google Scholar]
- Davies CH, Collingridge GL. Regulation of EPSPs by the synaptic activation of GABAB autoreceptors in rat hippocampus. J Physiol. 1996;496:451–470. doi: 10.1113/jphysiol.1996.sp021698. [DOI] [PMC free article] [PubMed] [Google Scholar]
- Dutar P, Nicoll RA. A physiological role for GABAB receptors in the central nervous system. Nature. 1988;332:156–158. doi: 10.1038/332156a0. [DOI] [PubMed] [Google Scholar]
- Földy C, Neu A, Jones MV, Soltesz I. Presynaptic, activity-dependent modulation of cannabinoid type 1 receptor-mediated inhibition of GABA release. J Neurosci. 2006;26:1465–1469. doi: 10.1523/JNEUROSCI.4587-05.2006. [DOI] [PMC free article] [PubMed] [Google Scholar]
- Franck JAE. Cell death, plasticity, and epilepsy: insight provided by experimental models of hippocampal sclerosis. In: Schwartzkroin PA, editor. Epilepsy: Models, Mechanisms, and Concepts. Cambridge, UK: Cambridge University Press; 1993. pp. 281–303. [Google Scholar]
- Freund T. Interneuron diversity series: rhythm and mood in perisomatic inhibition. Trends Neurosci. 2003;26:489–495. doi: 10.1016/S0166-2236(03)00227-3. [DOI] [PubMed] [Google Scholar]
- Freund T, Buzsaki G. Interneurons of the hippocampus. Hippocampus. 1996;6:347–470. doi: 10.1002/(SICI)1098-1063(1996)6:4<347::AID-HIPO1>3.0.CO;2-I. [DOI] [PubMed] [Google Scholar]
- Glickfeld LL, Roberts JD, Somogyi P, Scanziani M. Interneurons hyperpolarize pyramidal cells along their entire somatodendritic axis. Nat Neurosci. 2008;12:21–23. doi: 10.1038/nn.2230. [DOI] [PMC free article] [PubMed] [Google Scholar]
- Gulledge AT, Stuart GJ. Excitatory actions of GABA in the cortex. Neuron. 2003;37:299–309. doi: 10.1016/s0896-6273(02)01146-7. [DOI] [PubMed] [Google Scholar]
- Gulyás AI, Miles R, Hájos N, Freund TF. Precision and variability in postsynaptic target selection of inhibitory cells in the hippocampal CA3 region. Eur J Neurosci. 1993;5:1729–1751. doi: 10.1111/j.1460-9568.1993.tb00240.x. [DOI] [PubMed] [Google Scholar]
- Han ZS, Buhl EH, Lörinczi Z, Somogyi P. A high degree of spatial selectivity in the axonal and dendritic domains of physiologically identified local-circuit neurons in the dentate gyrus of the rat hippocampus. Eur J Neurosci. 1993;5:395–410. doi: 10.1111/j.1460-9568.1993.tb00507.x. [DOI] [PubMed] [Google Scholar]
- Huberfeld G, Wittner L, Clemenceau S, Baulac M, Kaila K, Miles R, Rivera C. Perturbed chloride homeostasis and GABAergic signalling in human temporal lobe epilepsy. J Neurosci. 2007;27:9866–9873. doi: 10.1523/JNEUROSCI.2761-07.2007. [DOI] [PMC free article] [PubMed] [Google Scholar]
- Kaila K, Lamsa K, Smirnov S, Taira T, Voipio J. Long-lasting GABA-mediated depolarization evoked by high-frequency stimulation in pyramidal neurons of rat hippocampal slice is attributable to a network-driven, bicarbonate-dependent, K+ transient. J Neurosci. 1997;17:7662–7672. doi: 10.1523/JNEUROSCI.17-20-07662.1997. [DOI] [PMC free article] [PubMed] [Google Scholar]
- Kampa BM, Clements J, Jonas P, Stuart GJ. Kinetics of Mg2+ unblock of NMDA receptors: implications for spike-timing dependent synaptic plasticity. J Physiol. 2004;556:337–345. doi: 10.1113/jphysiol.2003.058842. [DOI] [PMC free article] [PubMed] [Google Scholar]
- Kapfer C, Glickfeld LL, Atallah BV, Scanziani M. Supralinear increase of recurrent inhibition during sparse activity in the somatosensory cortex. Nat Neurosci. 2007;10:743–753. doi: 10.1038/nn1909. [DOI] [PMC free article] [PubMed] [Google Scholar]
- Klausberger T, Somogyi P. Neuronal diversity and temporal dynamics: the unity of hippocampal circuit operations. Science. 2008;321:53–57.. doi: 10.1126/science.1149381. [DOI] [PMC free article] [PubMed] [Google Scholar]
- Kofuji P, Newman EA. Potassium buffering in the central nervous system. Neuroscience. 2004;129:1045–1056. doi: 10.1016/j.neuroscience.2004.06.008. [DOI] [PMC free article] [PubMed] [Google Scholar]
- Lacaille JC. Postsynaptic potentials mediated by excitatory and inhibitory amino acids in interneurons of stratum pyramidale of the CA1 region of rat hippocampal slices in vitro. J Neurophysiol. 1991;66:1441–1454. doi: 10.1152/jn.1991.66.5.1441. [DOI] [PubMed] [Google Scholar]
- Lei S, McBain CJ. GABAB receptor modulation of excitatory and inhibitory synaptic transmission onto rat CA3 hippocampal interneurons. J Physiol. 2003;546:439–453. doi: 10.1113/jphysiol.2002.034017. [DOI] [PMC free article] [PubMed] [Google Scholar]
- McBain CJ. Hippocampal inhibitory neuron activity in the elevated potassium model of epilepsy. J Neurophysiol. 1995;73:2853–2863. doi: 10.1152/jn.1995.73.2.2853. [DOI] [PubMed] [Google Scholar]
- Maccaferri G. Stratum oriens horizontal interneurone diversity and hippocampal network dynamics. J Physiol. 2005;562:73–80. doi: 10.1113/jphysiol.2004.077081. [DOI] [PMC free article] [PubMed] [Google Scholar]
- Maccaferri G, Dingledine R. Control of feedforward dendritic inhibition by NMDA receptor-dependent spike timing in hippocampal interneurons. J Neurosci. 2002;22:5462–5472. doi: 10.1523/JNEUROSCI.22-13-05462.2002. [DOI] [PMC free article] [PubMed] [Google Scholar]
- Maccaferri G, Roberts JD, Szucs P, Cottingham CA, Somogyi P. Cell surface domain specific postsynaptic currents evoked by identified GABAergic neurones in rat hippocampus in vitro. J Physiol. 2000;524:91–116. doi: 10.1111/j.1469-7793.2000.t01-3-00091.x. [DOI] [PMC free article] [PubMed] [Google Scholar]
- Maglóczky Z, Freund TF. Impaired and repaired inhibitory circuits in the epileptic human hippocampus. Trends Neurosci. 2005;28:334–340. doi: 10.1016/j.tins.2005.04.002. [DOI] [PubMed] [Google Scholar]
- Mayer ML, Guthrie PB. Voltage-dependent block by Mg2+ of NMDA responses in spinal cord neurones. Nature. 1984;309:261–263. doi: 10.1038/309261a0. [DOI] [PubMed] [Google Scholar]
- Mazarati AM. Does preservation of perisomatic inhibition in epileptic hippocampus contribute to seizures? Epilepsy Curr. 2005;5:174–175. doi: 10.1111/j.1535-7511.2005.00055.x. [DOI] [PMC free article] [PubMed] [Google Scholar]
- Megías M, Emri Z, Freund TF, Gulyás AI. Total number and distribution of inhibitory and excitatory synapses on hippocampal CA1 pyramidal cells. Neuroscience. 2001;102:527–540. doi: 10.1016/s0306-4522(00)00496-6. [DOI] [PubMed] [Google Scholar]
- Miles R, Poncer JC. Paired recordings from neurones. Curr Opin Neurobiol. 1996;6:387–394. doi: 10.1016/s0959-4388(96)80124-3. [DOI] [PubMed] [Google Scholar]
- Miles R, Tóth K, Gulyás AI, Hájos N, Freund TF. Differences between somatic and dendritic inhibition in the hippocampus. Neuron. 1996;16:815–823. doi: 10.1016/s0896-6273(00)80101-4. [DOI] [PubMed] [Google Scholar]
- Motulsky H, Christopoulos A. Fitting Models to Biological Data using Linear and Nonlinear Regression: A Pratical Guide to Curve Fitting. New York: Oxford University Press; 2004. [Google Scholar]
- Nowak L, Prochiantz A. Magnesium gates glutamate-activated channels in mouse central neurones. Nature. 1984;307:462–465. doi: 10.1038/307462a0. [DOI] [PubMed] [Google Scholar]
- Papp E, Leinekugel X, Henze DA, Lee J, Buzsáki G. The apical shaft of CA1 pyramidal cells is under GABAergic interneuronal control. Neuroscience. 2001;102:715–721. doi: 10.1016/s0306-4522(00)00584-4. [DOI] [PubMed] [Google Scholar]
- Pathak HR, Weissinger F, Terenuma M, Carlson GC, Hsu FC, Moss SJ, Coulter DA. Disrupted dentate granule cell chloride regulation enhances synaptic excitability during development of temporal lobe epilepsy. J Neurosci. 2007;27:1412–1422. doi: 10.1523/JNEUROSCI.4390-07.2007. [DOI] [PMC free article] [PubMed] [Google Scholar]
- Pitler TA, Alger BE. Depolarization-induced suppression of GABAergic inhibition in rat hippocampal pyramidal cells: G protein involvement in a presynaptic mechanism. Neuron. 1994;13:1447–1455. doi: 10.1016/0896-6273(94)90430-8. [DOI] [PubMed] [Google Scholar]
- Pouille F, Scanziani M. Routing of spike series by dynamic circuits in the hippocampus. Nature. 2004;429:717–723. doi: 10.1038/nature02615. [DOI] [PubMed] [Google Scholar]
- Reyes A, Lujan R, Rozov A, Burnashev N, Somogyi P, Sakmann B. Target-cell-specific facilitation and depression in neocortical circuits. Nat Neurosci. 1998;1:279–285. doi: 10.1038/1092. [DOI] [PubMed] [Google Scholar]
- Rogawski MA. Principles of antiepileptic drug action. In: Levy RH, Meldrum BS, Mattson RH, Perucca E, editors. Antiepileptic Drugs. Philadelphia: Lippincott Williams & Wilkins; 2002. pp. 3–22. [Google Scholar]
- Sabatini BL, Regehr WG. Timing of neurotransmission at fast synapses in the mammalian brain. Nature. 1996;384:170–172. doi: 10.1038/384170a0. [DOI] [PubMed] [Google Scholar]
- Scanziani M. GABA spillover activates postsynaptic GABAB receptors to control rhythmic hippocampal activity. Neuron. 2000;25:673–681. doi: 10.1016/s0896-6273(00)81069-7. [DOI] [PubMed] [Google Scholar]
- Scanziani M, Gähwiler BH, Thompson SM. Paroxysmal inhibitory potentials mediated by GABAB receptors in partially disinhibited rat hippocampal slice cultures. J Physiol. 1991;444:375–396. doi: 10.1113/jphysiol.1991.sp018884. [DOI] [PMC free article] [PubMed] [Google Scholar]
- Silberberg G, Markram H. Disynaptic inhibition between neocortical pyramidal cells mediated by Martinotti cells. Neuron. 2007;53:735–746. doi: 10.1016/j.neuron.2007.02.012. [DOI] [PubMed] [Google Scholar]
- Spamapanato J, Mody we. Spike timing of lacunosum-moleculare targeting interneurons and CA3 pyramidal cells during high-frequency network oscillations in vitro. J Neurophysiol. 2007;98:96–104. doi: 10.1152/jn.00188.2007. [DOI] [PubMed] [Google Scholar]
- Staley KJ, Longacher M, Bains JS, Yee A. Presynaptic modulation of CA3 network activity. Nat Neurosci. 1998;1:201–209. doi: 10.1038/651. [DOI] [PubMed] [Google Scholar]
- Staley KJ, Soldo BL, Proctor WR. Ionic mechanisms of neuronal excitation by inhibitory GABAA receptors. Science. 1995;269:977–981. doi: 10.1126/science.7638623. [DOI] [PubMed] [Google Scholar]
- Stuart GJ, Dodt HU, Sakmann B. Patch-clamp recordings from the soma and dendrites of neurons in brain slices using infrared video microscopy. Pflugers Arch. 1993;423:511–518. doi: 10.1007/BF00374949. [DOI] [PubMed] [Google Scholar]
- Szabadics J, Varga C, Molnár G, Oláh S, Barzó P, Tamás G. Excitatory effect of GABAergic axo-axonic cells in cortical microcircuits. Science. 2006;311:233–235. doi: 10.1126/science.1121325. [DOI] [PubMed] [Google Scholar]
- Thompson SM, Gähwiler BH. Activity-dependent disinhibition. I. Repetitive stimulation reduces IPSP driving force and conductance in the hippocampus in vitro. J Neurophysiol. 1989a;61:501–511. doi: 10.1152/jn.1989.61.3.501. [DOI] [PubMed] [Google Scholar]
- Thompson SM, Gähwiler BH. Activity-dependent disinhibition. III. Desensitization and GABAB receptor-mediated presynaptic inhibition in the hippocampus in vitro. J Neurophysiol. 1989b;61:524–533. doi: 10.1152/jn.1989.61.3.524. [DOI] [PubMed] [Google Scholar]
- Traub RD, Miles R. Neuronal Networks of the Hippocampus. New York: Cambridge University Press; 1991. [Google Scholar]
- Traynelis SF. Software-based correction of single compartment series resistance errors. J Neurosci Methods. 1998;86:25–34. doi: 10.1016/s0165-0270(98)00140-x. [DOI] [PubMed] [Google Scholar]
- Voipio J, Kaila K. GABAergic excitation and K+-mediated volume transmission in the hippocampus. Prog Brain Res. 2000;125:329–338. doi: 10.1016/S0079-6123(00)25022-X. [DOI] [PubMed] [Google Scholar]
- Williams SR, Mitchell SJ. Direct measurement of somatic voltage-clamp errors in central neurons. Nat Neurosci. 2008;11:790–798. doi: 10.1038/nn.2137. [DOI] [PubMed] [Google Scholar]
- Wittner L, Eross L, Czirják S, Halász P, Freund TF, Maglóczky Z. Surviving CA1 pyramidal cells receive intact perisomatic inhibitory input in the human epileptic hippocampus. Brain. 2005;128:138–152. doi: 10.1093/brain/awh339. [DOI] [PubMed] [Google Scholar]


