

Abstract
Mineral crystal nucleation in UMR 106-01 osteoblastic cultures occurs within 15–25-μm extracellular vesicle-containing biomineralization foci (BMF) structures. We show here that BAG-75 and BSP, biomarkers for these foci, are specifically enriched in laser capture microscope-isolated mineralized BMF as compared with the total cell layer. Unexpectedly, fragments of each protein (45–50 kDa in apparent size) were also enriched within captured BMF. When a series of inhibitors against different protease classes were screened, serine protease inhibitor 4-(2-aminoethyl)benzenesulfonylfluoride HCl (AEBSF) was the only one that completely blocked mineral nucleation within BMF in UMR cultures. AEBSF appeared to act on an osteoblast-derived protease at a late differentiation stage in this culture model just prior to mineral deposition. Similarly, mineralization of bone nodules in primary mouse calvarial osteoblastic cultures was completely blocked by AEBSF. Cleavage of BAG-75 and BSP was also inhibited at the minimum dosage of AEBSF sufficient to completely block mineralization of BMF. Two-dimensional SDS-PAGE comparisons of AEBSF-treated and untreated UMR cultures showed that fragmentation/activation of a limited number of other mineralization-related proteins was also blocked. Taken together, our results indicate for the first time that cleavage of BAG-75 and BSP by an AEBSF-sensitive, osteoblast-derived serine protease is associated with mineral crystal nucleation in BMF and suggest that such proteolytic events are a permissive step for mineralization to proceed.
Bone is a vascularized tissue that uniquely becomes mineralized as part of its developmental program (1). Mineralized bone serves essential vertebrate functions, including structural support, reversible storage for calcium and phosphorus, and as a reservoir for toxic metals and carbonate (2). Bone tissue is composed of osteoid; osteoblasts, which produce and mineralize new bone; osteoclasts, which resorb bone; and osteocytes, mature osteoblasts that maintain bone viability (1–3). Osteoid is a type I collagen-rich extracellular matrix enriched in acidic noncollagenous proteins (4). Using fetal rat calvaria cell cultures, Bellows et al. (5) showed that osteoid is unmineralized when initially deposited, and mineral crystals form within nodular structures over the following 48–72 h. Bone matrices can be classified as lamellar, based on a highly organized layered structure, or woven bone. Woven bone is formed during embryonic development, fracture healing, and at sites receiving mechanical stimulation in excess of 3,000 microstrain (6); lamellar bone replaces woven bone later in development.
The question of whether bone mineralization is under direct osteoblastic control or whether it is purely a passive chemical process is under active investigation. Schinke et al. (7) have proposed that calcification reactions in vivo are passive physiochemical processes occurring readily where local mineralization inhibitors are overwhelmed. In support of this hypothesis, Murshed et al. (8) produced a calcified dermal layer in transgenic mice expressing alkaline phosphatase in skin under the control of the type I collagen α chain promoter (2). Similarly, Luo et al. (9) and Murshed et al. (10) showed that matrix GLA protein is a passive local inhibitor of vascular calcification because deficient mice calcify their thoracic aorta. The latter approach emphasizes the formation of hydroxyapatite crystals as the primary experimental outcome.
A second view focuses on the active role of local extracellular nucleation complexes such as biomineralization foci (11, 12), crystal ghosts (13, 14), matrix vesicles (15), and the hole regions of collagen fibrils (16) with matrix vesicles (17, 18) or with extracellular matrix phosphoproteins (12, 19, 20). We have proposed that mineralization can be divided into a cell-mediated nucleation phase within BMF,2 followed by passive growth and expansion of these initial crystals (11, 12). In this model, once the initial crystals reach sufficient size and number, the BMF barrier function is abrogated, facilitating the passive growth and expansion of the initial mineral phase into the larger, territorial collagenous matrix. The latter research focuses on the in vivo functionality of the mineralized bone product (10–19). In this context, hydroxyapatite crystal formation is envisioned to occur in a manner that facilitates subsequent vascular access to the crystals and placement of crystals within the organic matrix so as to facilitate mechanical support for organs, joints, muscles, and tendons.
Bone osteoid is enriched in phosphoproteins, acidic glycoproteins, and proteoglycans, some of which like BSP or its fragments are nucleators of hydroxyapatite crystals (20, 21). We have shown that phosphoglycoprotein BAG-75 expression delineates future extracellular sites of mineralization in vivo within woven bone and in vitro termed BMF (11, 12). BMF are 15–25-μm spherical extracellular structures containing several sizes of vesicles (15), which are sites of the first mineral crystals in the UMR osteoblastic model (12). Following plating, UMR cells proliferate and differentiate over the first 60–64 h and attain a competency to initiate mineralization in BMF, if supplemented with a phosphate source (22). BSP has also been localized to mineralizing nodules termed crystal ghost aggregates in rat bone, which are analogous to BMF (13, 14, 23). BSP is incorporated into BMF just prior the appearance of mineral crystals (12, 22). Based on these findings, we proposed that BMF structures function in an active mineralization process initiated and controlled by osteoblastic cells.
To better understand the role of BMF in bone mineral nucleation, we have begun to characterize the proteome of mineralized BMF isolated by laser capture microscopy. Our results show that isolated BMF are not only physically enriched in BAG-75 and BSP but also fragments of each. Screening inhibitors of the different classes of proteases revealed for the first time that serine protease inhibitor AEBSF completely blocked cleavage of BAG-75 and BSP, as well as mineral crystal nucleation within BMF. Two-dimensional SDS-PAGE comparisons of AEBSF-treated and control cultures suggested that activation of procollagen processing may also be inhibited. Taken together, our results demonstrate an association between serine protease cleavage of mineral nucleator BSP and mineral crystal nucleation within biomineralization foci and mineralization nodules.
EXPERIMENTAL PROCEDURES
Materials
Antibodies were from several sources as follows: nonimmune rabbit IgG (EMD Biosciences), anti-BAG-75 (number 503) (anti-peptide antibody) rabbit serum (24); anti-BAG-75 (number 504) (anti-protein antibody) rabbit serum (24); antibone sialoprotein LF-100 antiserum (Larry Fisher, NIDCR, National Institutes of Health); and monoclonal anti-BSP (WV1D1(9C5)) antibody (NIH Developmental Studies Hybridoma Bank, University of Iowa).
Methods
Cell Culture
UMR 106-01 BSP cells were passaged and cultured at 37 °C and 5% carbon dioxide as described previously (12, 22) and updated briefly here. Cells were seeded at a density of 1.0 × 10⁵ cells/cm2 in Growth Medium (Eagle’s MEM supplemented with Earle’s salts, 1% nonessential amino acids (Sigma), 10 mm HEPES (pH 7.2), and 10% fetal bovine serum (Hyclone)). After 24 h, the medium was exchanged with Growth Medium containing 0.5% BSA (catalog number A-1933, Sigma) instead of FBS. Sixty four hours after plating, the culture medium was exchanged with Mineralization Media (Growth Medium containing either 0.1% BSA or 10% fetal bovine serum and 7 mm BGP). Cultures were then incubated for an additional 24 h, at the end of which (88 h) the cells were either subjected to MTT assay or fixed in 70% ethanol and then extracted for protein. In some experiments, protease inhibitors, including serine protease inhibitor AEBSF [(4-(2-aminoethyl)- benzenesulfonylfluoride HCl)] (EMD Biosciences), were added to cultures at 64 h after plating in Mineralization Media. Alternatively, AEBSF was added at 44 h after plating; inhibitor was then removed and exchanged for Mineralization Media at 64 h and the amount of mineralization analyzed at 88 h.
Primary mouse osteoblasts were isolated from calvaria of 5–7-day-old mice using a modification of the method described previously (25, 26). Briefly, the calvaria were aseptically harvested, and four sequential 20-min digests were performed in 0.05% trypsin, 0.2% collagenase in Hanks’ balanced salt solution. Fractions 2– 4 were pooled, centrifuged, and resuspended in α-MEM containing 10% fetal bovine serum, 2 mm l-glutamine, 100 units/ml penicillin, and 30 μg/ml gentamicin (α-Growth Medium). 2 × 10⁶ cells were plated per T-75-cm2 flask and allowed to reach confluency (3–4 days). Confluent flasks were then trypsinized and plated into 12- or 24-well culture dishes for experiments at a density of 20,000 cells per cm2 growth area using media and supplements as described above. At confluency, the media were changed to α-MEM containing 5% FBS, 50 μg/ml ascorbic acid, 5 mm BGP, and other supplements as described above. BGP was omitted from some wells that served as an un-mineralized control. To test the effect of AEBSF, identical duplicate cultures were treated on days 3, 6, or 9 with 0.003 to 0.1 mm AEBSF. Phase contrast images were taken of living cultures on days 3–12. On day 12 after plating, one set of cultures was incubated with MTT as described below to determine cell viability. A second set of cultures was fixed on day 12 with 70% ethanol and processed for quantitative Alizarin red S staining as described below.
MTT Assay
Culture wells were washed with Eagle’s MEM supplemented with Earle’s salts and then incubated with a solution of 0.5 mg/ml MTT in Eagle’s MEM for 1–2 h at 37 °C (27). Residual MTT solution was removed; the cells were disrupted by mixing briefly with dimethyl sulfoxide, and free reduced dye was read at 490 or 540 nm in a spectrophotometer.
Quantitation of Mineralization
After fixation in 70% ethanol, the cell layer was rinsed and stained with Alizarin red S dye as described previously (22). The same procedure was also used for serum-depleted cultures with the following modified washing protocol, e.g. the stained cell layer was rinsed once with 1 mm HEPES in nanopure water. A standard curve for Alizarin red S dye was constructed for each analysis, and amount of bound dye/culture well determined.
Statistical Methods
All statistical tests were performed using SigmaStat 3.1 software (Systat Software, Inc.). A one-way analysis of variance test was used to determine whether a statistical difference existed between the viability of UMR-106-01 cultures or the amount of mineral deposited. Subsequent pair-wise multiple comparison tests were performed with the Student-Newman-Keuls or the Kruskal-Wallis method.
Extraction of Cell Layer Fraction; One-step Method
Cells were dislodged by scraping and then extracted with 75 mm potassium phosphate buffer (pH 7.2), containing 10 mm CHAPS, 75 mm sodium chloride, 50 mm tetrasodium EDTA, 10 mm benzamidine hydrochloride, 2 mm dithiothreitol, and 0.02% sodium azide for 1 h at 4 °C. Each extract was then homogenized briefly using a motorized pestle and clarified by ultracentrifugation at 30,000 rpm for 1 h at 4 °C in an SW 50.1 rotor prior to use. Conditioned media were immediately heated at 95 °C for 5 min to inactivate protease activity and frozen at −80 °C until analyzed.
Extraction of Cell Layer; Two-step Method
During the final 24-h mineralization period, cells were grown in BSA-free, serum-free media conditions to reduce the amount of BSA in fractions used for two-dimensional gel electrophoresis. Media were removed from each flask, heated at 95 °C for 5 min, dialyzed against 5% acetic acid, and lyophilized to dryness. Cell layers were first extracted without mixing for 2 h at 4 °C in 0.05 m Tris acetate buffer (pH 7.5) containing 0.15 m NaCl, 0.05 m EDTA, and 0.02% sodium azide; extracts were then inactivated at 95 °C for 5 min, dialyzed against 5% HAc, and lyophilized to dryness. The residual cell layer was next dislodged by scraping and extracted overnight at 4 °C by slow mixing with 0.1 m Tris acetate buffer (pH 7.5) containing 8 m urea, 2% (w/v) CHAPS, and 0.02% sodium azide. Urea extracts were homogenized and clarified by ultracentrifugation at 30,000 rpm for 1 h at 4 °C in an SW 50.1 rotor prior to use in two-dimensional gel electrophoresis.
Western Blotting Chemiluminescence Detection
Cell layer extracts and media fractions prepared as described above were electrophoresed under reducing conditions on 4–20% linear gradient gels (ISC BioExpress) according to Laemmli (28) and electroblotted onto polyvinylidene difluoride membranes (Millipore Corp.) for 2 h at 100 V. The transfer buffer was composed of 10 mm CAPS buffer (pH 11.0) containing 10% methanol. Blots were processed essentially as described previously (29). Immunoblotting with digoxygenin-MAA lectin followed a procedure described earlier (29) except that a secondary horseradish peroxidase-conjugated anti-digoxygenin antibody was used for chemiluminescent detection. Films were digitized using a flat bed scanner. To detect directly acidic bone glycoproteins or phosphoproteins, some gels were stained with Stains All (29).
Laser Capture Microscopy
UMR cells were grown as usual on Fisher Plus microscope slides (Fisher), fixed, and stained with Alizarin red S dye. Immediately prior to laser capture, slides were dehydrated through a graded series of ethanol washes and xylene rinses. Dried slides were stored at −20 °C in a sealed box with desiccant until used. Mineralized BMF were collected onto standard caps using an Arturus Pixel IIe microscope. Collection films were pooled and stored in 70% ethanol at −20 °C until ~6200 BMF were collected. LCM-captured BMF were then mixed in 70% ethanol to dislodge the purple-stained particles that were then microcentrifuged to remove the ethanol. BMF pellets were extracted twice sequentially over a 2-day period at 4 °C with 1.1 ml of 0.1 m Tris acetate buffer (pH 7.8) containing with 0.5% octyl glucoside, 0.05% SDS, 0.05 m EDTA, and 0.02% sodium azide. Extracts were then dialyzed first against 0.01 m Tris acetate buffer (pH 7.8) containing 8 m urea, 0.05% SDS, 0.1% octyl glucoside, 0.05 m EDTA, and second against 0.01 m Tris acetate buffer (pH 7.8) containing 8 m urea, 0.05% SDS, and 0.1% octyl glucoside. Controls consisted of glass slides containing the total cell layer fractions from +BGP or −BGP cultures; control slides were extracted using a similar protocol. The resultant dialyzed extracts were used for comparative blotting studies where identical protein amounts were loaded per gel lane.
Protein Determination
Protein concentration of BMF extracts was determined using the NonInterfering Protein Assay by Geno-Technology Inc. (St. Louis, MO).
Mass Spectrometric Analyses
Protein bands and spots were detected by staining with Coomassie Blue G dye or with Sypro Ruby dye according to the manufacturer’s instructions (Bio-Rad). Excised gel bands/spots were reduced and alkylated followed by digestion with trypsin for 6–16 h (30). Peptides were extracted and subjected to reverse phase capillary liquid chromatography-mass spectrometry with a linear 2–70% acetonitrile gradient over 45 min in 50 mm acetic acid, in a 50 μm inner diameter × 7 mm Phenomenex C18 Jupiter Proteo capillary column. The column eluted directly into an LTQ linear ion trap mass spectrometer as described previously (30). The instrument was operated in the data-dependent mode in which one mass spectrum and eight collision-induced dissociation spectra were acquired per cycle. The data were analyzed using Mascot protein identification software (Matrix Science), with manual inspection of data base matches for validation. The Mascot identification program (Matrix Science) uses a statistical method to assess the validity of a match (31). Criteria used for protein identifications include matching the peptide based on the following: 1) the precursor (peptide) mass, and 2) MS/MS fragment masses present in the scan, coinciding with the predicted masses of peptides (and peptide fragment masses) from a data base entry. Protein searches are currently based on comparison to all or a subset of (rodent, for example) the sequences present in the MSDB data base, filename MSDB_20050227.fasta (February 27th, 2005 version). Protein identifications made contain at least two peptides match in the MS/MS scans that meets or exceeds the threshold values for a 95% confidence level.
Two-dimensional PAGE
Gels were run according to the method of Witzmann et al. (32) and stained with either colloidal Coomassie Blue G, Pro-Q Emerald 300 glycoprotein stain (Invitrogen), or Pro-Q Diamond phosphoprotein stain (Invitrogen). PD-Quest (Bio-Rad) software was used to digitally analyze the colloidal Coomassie Blue G-stained gels comparing AEBSF-treated with nontreated cell layer and media fractions to identify proteins differentially expressed in one condition versus another.
RESULTS
Mineralization of UMR Osteoblastic Cells Is Unchanged in Serum-depleted Conditions
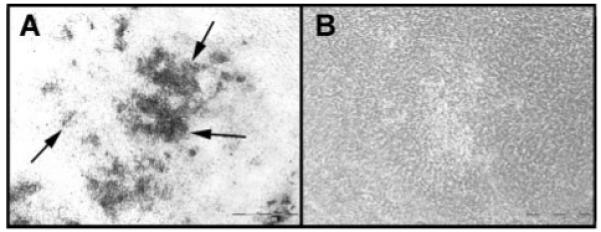
To limit contamination by serum proteins in isolated BMF, we tested whether use of serum-free conditions would affect the amount or morphology of mineralization in UMR cultures. No differences were noted in the amount or morphology of mineralized BMF when conditions of serum depletion were compared with serum-replete conditions (compare Fig. 1, A versus C). As expected (22), few mineral crystals are evident when BGP is omitted (Fig. 1B). Quantitation of the amount of Alizarin red stain bound per well also revealed no significant differences (not shown). Manual counts of mineralized BMF formed under serum-containing and serum-depleted conditions showed no statistical difference (103 foci/cm2 ± 6.56 S.D. versus 105 mineralized foci/cm2 ± 6.08 S.D., p = 0.486 using one-way analysis of variance followed by Kruskal-Wallis method). These results confirm that the mineralization potential is unchanged in conditions of serum depletion.
FIGURE 1. Biomineralization foci can be isolated from total cell layers by laser capture microscopy.
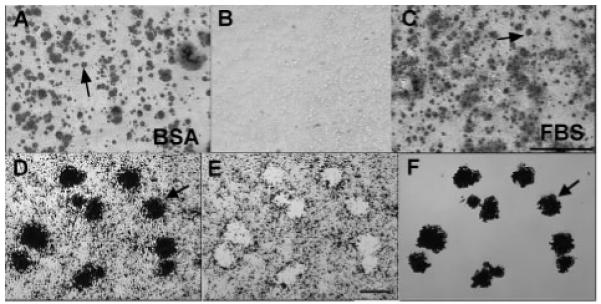
A and B, UMR-106-01 osteoblastic cells were cultured in serum-depleted conditions (BSA), or C, the presence of serum (FBS). Cultures were stained with Alizarin red S to detect hydroxyapatite crystals. B, both conditions failed to mineralize in the absence of BGP. Arrows point to mineralized BMF (A and C). Scale bar = 500 μm. D–F, laser capture microscopy of Alizarin red S stained BMF from UMR-106-01 culture. Arrows refer to the same BMF structures in all panels. D, microscopic view of field to be laser-captured. E, appearance of the residual cell layer left behind after laser dissection of mineralized BMF. F, purified BMF temporarily affixed to the “cap” used for laser capture. Gel images are representative of multiple analyses on two separate BMF preparations. Scale bar = 25 μm.
BAG-75 and BSP and Fragments of Each Are Enriched within Purified Mineralized BMF
Mineralized BMF, which appear as dark spots about 20–25 μm in diameter, were isolated from ethanol-fixed, Alizarin red-stained UMR cultures by laser capture microscopy (Fig. 1, D–F). Use of Alizarin red staining for identification provides a direct connection to previous work that defined BMF structures as sites of initial mineral crystal nucleation (12, 22). After laser capture of mineralized BMF, Fig. 1E depicts residual “holes” that are devoid of cells and show the underlying glass surface. Finally, Fig. 1F provides an image of the resultant captured BMF preparation with individual foci arranged in the same relative orientation as they appeared on the original stained slide (Fig. 1D). Visual inspection of captured populations revealed an absence of obvious cellular contamination. Furthermore, attempts at direct isolation of cells from the fixed cell layer using an LCM approach proved unsuccessful demonstrating that the fixed UMR cells adhere too tightly to the glass slide to permit their capture from this surface.3
Following capture, ~6200 pooled BMF were extracted by mixing with 0.1 m Tris acetate buffer (pH 7.8), containing with 0.5% octyl glucoside, 0.05% SDS, 0.05 m EDTA, and 0.02% sodium azide, and then subjected to SDS-PAGE. As controls, UMR culture slides containing the total cell layer along with mineralized BMF (as depicted in Fig. 1D, +CL) were processed similarly. Culture slides not treated with β-glycerol phosphate and containing nonmineralized pre-BMF represent a second control (as depicted in Fig. 1B, −CL). Equal amounts of protein were applied to each lane, and gels were stained as indicated (Fig. 2).
FIGURE 2. LCM-captured BMF display distinctive glyco- and phosphoprotein staining patterns compared with the total cell layer fraction.
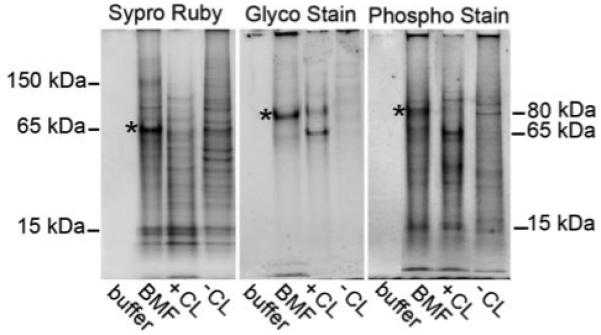
The same amount of protein was applied to each lane. Asterisks emphasize the quantitative enrichment of 75–80-kDa glycophosphoproteins and of a 65-kDa Sypro ruby-stained protein in BMF lanes. Molecular weight estimates refer to blue pre-stained standards co-electrophoresed on the same gel. Results depicted are representative of two separate BMF preparations. Buffer, 0.1 m Tris acetate buffer (pH 7.8), containing with 0.5% octyl glucoside, 0.05% SDS, 0.05 m EDTA, and 0.02% sodium azide); BMF, represents proteins extracted from purified BMF (see Fig. 1F); +CL, cell layer extract of cultures after 24 h mineralization in β-glycerol phosphate (see Fig. 1D); −CL, cell layer extract of cultures not treated with β-glycerol phosphate (see Fig. 1B).
SDS-PAGE results show substantial enrichment of 75-kDa glycoproteins and phosphoproteins in the BMF extract when compared directly with the +CL control (Fig. 2, see bands with asterisks). Sypro Ruby staining showed enrichment of bands in the 65-kDa range in BMF. In contrast, bands in the 10–15-kDa range appeared to be shared by both the BMF and total cell layer samples (Fig. 2). Although not quantitative, this comparative analysis is designed to identify those proteins substantially enriched within mineralized BMF. Our approach is based upon the hypothesis that BMF are structures assembled for the specific purpose of nucleating hydroxyapatite crystals in culture and in primary bone (11, 12). Because mineral nucleation is a specialized function, our hypothesis predicts that BMF should exhibit a specialized proteome. Existence of clear differences (more than 5–10-fold) in 75-kDa glyco- and phosphoproteins between the BMF proteome and that of the +CL control supports this hypothesis. The absence of similar post-translationally modified proteins in the −CL control re-enforces this finding (Fig. 2).
Immunoblotting studies (Fig. 3, A–E) revealed that the 75-kDa glycophosphoproteins BAG-75 and BSP were both dramatically enriched in BMF only in the presence of BGP. Closer inspection reveals BMF fractions also contain a higher relative content of BAG-75 and BSP fragments (Fig. 3, B, D, and E, arrows). In the case of BAG-75, this was detected through use of an N-terminal 3-13 anti-peptide antibody (number 503), which is known to preferentially recognize a 50-kDa fragment (24). For BSP, a 45–50-kDa fragment was observable when the full-length BSP band was purposely overloaded (Fig. 3, C–E). Nonmineralizing cultures also contain a much smaller amount of the 45–50-kDa fragment (Fig. 3, D and E, −CL), although the gel band pattern is different from that for cultures treated with BGP (+CL). These findings validate the use of laser capture microscopy as a means to purify mineralized BMF from UMR 106 cell monolayers. Enrichment of full-length protein within BMF links BAG-75 and BSP with mineral nucleation, whereas localization of their cleavage fragments at the site of initial crystal nucleation raises a question as to whether proteolytic cleavage of BAG-75 and BSP is required for mineral nucleation within BMF.
FIGURE 3. Comparative immunostaining of LCM-isolated BMF versus total cell layer fractions demonstrates an enrichment of BAG-75 and BSP and their fragments.
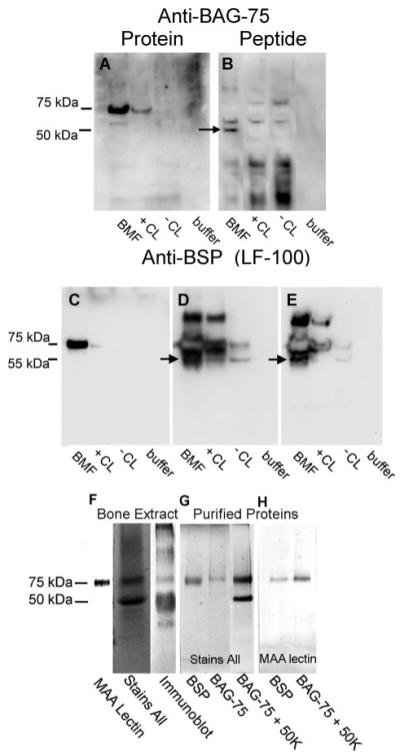
A–E, protein extracts from LCM-captured BMF, cell layer fractions, and a buffer control were electroblotted onto polyvinylidene difluoride membrane and developed with anti-BAG-75 or anti-BSP antibodies. Arrows indicate 45–50-kDa fragments of BAG-75 and of BSP enriched in BMF extracts over that in the +CL total cell layer. The amount of protein loaded onto gel lanes for blots A–C was 6.5 μg, for blot D was 13 μg, and for blot E was 26 μg. Blots D and E were intentionally overdeveloped to detect the BSP fragment. Antibodies used are as follows: anti-BAG-75 protein antibody (number 504); anti-BAG-75 peptide antibody (number 503); and anti-BSP antibody (LF-100). BMF, extract of LCM-captured biomineralization foci; +CL, extract of total cell layer from β-glycerol phosphate-treated cultures; −CL, extract of total cell layer from cultures not treated with β-glycerol phosphate; buffer, 0.1 m Tris acetate buffer (pH 7.8), containing with 0.5% octyl glucoside, 0.05% SDS, 0.05 m EDTA, and 0.02% sodium azide. F–H, BAG-75 and BSP are two prominent 75-kDa glycoproteins in rat primary bone extracts. F, rat bone G/E extract was electroblotted and detected either with digoxygenin-labeled MAA lectin or with anti-BAG-75 antibodies (number 504) (immunoblot). The extract was also electrophoresed and stained directly with Stains All dye. G, purified BSP, BAG-75, and mixture of BAG-75 and its 50-kDa fragment were electrophoresed and stained with Stains All. H, purified BSP and a mixture of BAG-75 and its 50-kDa fragment were electroblotted and detected with digoxygenin-labeled MAA lectin. Molecular weight estimates are based on pre-stained standards co-electrophoresed on the same gel.
Results with whole animals indicate that BAG-75 and BSP are two major glycoproteins in rat bone. Specifically, total 4 m guanidine HCl, 0.5 m EDTA extracts of the mineralized compartment of bone (33) contain a single 75-kDa glycoprotein band reactive with MAA lectin (Fig. 3F). This result parallels that obtained upon glycoprotein staining of UMR fractions (Fig. 2). Bone extracts, like UMR extracts, also contain a major phosphoprotein of this size revealed after Stains All staining (Fig. 3F). Finally, as shown in Fig. 3H, both purified BSP and BAG-75, but not a characteristic 50-kDa fragment of BAG-75 (24), strongly react with MAA lectin. As a result, we conclude that BAG-75 and BSP together compose the 75-kDa glycophosphoprotein band whose cellular distribution specifically reflects the state of mineralization in the UMR culture model.
Serine Protease Inhibitor AEBSF Inhibits Mineral Crystal Nucleation in UMR 106 and in Primary Mouse Calvarial Cultures
To investigate the nature of the protease activity responsible for BAG-75/BSP cleavage and the relationship of cleavage with mineralization, we tested a variety of protease inhibitors (Table 1) in the UMR model. Individual inhibitors were added to confluent cultures at 64 h after plating, and the amount of mineral deposited within BMF was quantitated 24 h later. UMR cultures are not competent to mineralize until 60–64 h after plating, reflecting an osteogenic differentiation process that leads to the production of spherical pre-BMF structures.4
TABLE 1.
Effect of protease inhibitors on mineral nucleation within biomineralization foci in UMR 106 cultures
| Inhibitor | Target protease(s) | Range of concentration tested |
Specific inhibition of mineral deposition |
|---|---|---|---|
| AEBSF | Trypsin, chymotrypsin, plasmin, thrombin, kallikrein, proprotein convertases | 0.01–0.4 mm | Yes |
| Aprotinin | Trypsin, chymotrypsin, and plasmin | 0–3 μg/ml | No |
| Antipain | Papain, trypsin, and plasmin | 100 μm | No |
| C1s inhibitor | Activated complement protein C1s | 0.1–100 μg/ml | No |
| E-64 | Cysteine proteases | 10 μm | No |
| Elastatinal | Elastase and elastase-like proteases | 100 μm | No |
| GM 6001 | Matrix metalloproteinases 2, 3, 8, and 9 | 10 μm | No |
| Hexa-d-arginine | Furin | 1–10 μm | No |
| Hirudin | Thrombin | 0.5–10 ATUa | No |
| Leupeptin | Trypsin-like proteases and some cysteine proteases | 100 μm | No |
| Pefabloc PL | Plasmin and plasma kallikrein | 1–100 μm | No |
| Pefabloc urokinase-type plasminogen activator |
Urokinase plasminogen activator | 1–100 μm | No |
One antithrombin unit (ATU) will neutralize 1 NIH unit of thrombin at 37 ° C, based on direct comparison with an NIH thrombin reference standard.
Only one inhibitor, AEBSF, blocked mineral nucleation in BMF (Table 1 and Fig. 4A). AEBSF is a covalent serine protease inhibitor (34) and was capable of completely blocking mineral nucleation at concentrations as low as 0.04 mm. None of the other protease inhibitors tested, which included inhibitors of thrombin, plasmin, plasminogen activator, furin, and matrix metalloproteinases, diminished mineralization in the UMR system when used at their optimal recommended dosage (Table 1). When added at 64 h after plating, AEBSF was similarly effective regardless of whether serum was included in the culture media or not (Fig. 4A), indicating that the source of the mineralization-related, AEBSF-sensitive protease is the UMR 106 cells themselves. However, the time at which AEBSF was added dramatically influenced the outcome. Assuming a control mineral level represented by 150–170 nmol of Alizarin red dye/well, the inhibitor was 10-fold less effective if present during the period in which the cells are actively proliferating and differentiating (44–64 h after plating) rather than during the mineralization period (64–88 h after plating) (22) (Fig. 4A).
FIGURE 4. AEBSF inhibits mineral nucleation both in UMR 106 osteoblastic cultures and in primary mouse calvarial osteoblasts.
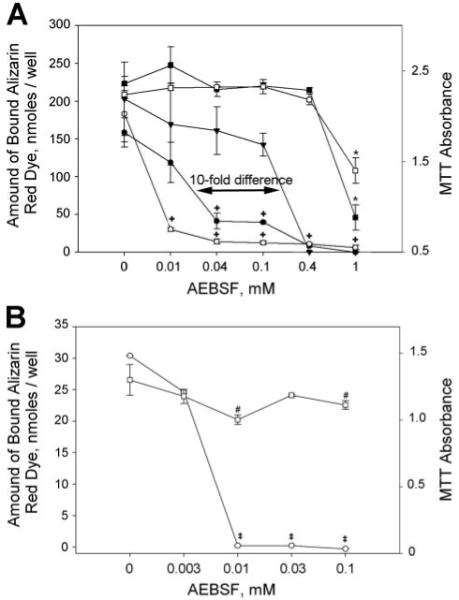
A, with UMR cells, AEBSF blocks mineralization similarly in both serum-containing and serum-depleted conditions, while displaying higher effectiveness with mineralization competent cultures. The amounts of Alizarin red S bound to calcium phosphate crystals within BMF and cell viability assessed with the MTT assay were plotted versus the concentration of AEBSF added to cultures. AEBSF was present two times during the culture model, e.g. from 44 to 64 h after plating and from 64 to 88 h after plating. A 4-fold increase in sensitivity was observed in converting from serum-sufficient conditions to serum-depleted conditions, whereas a 10-fold increase in effectiveness was obtained when comparing 64–88 h versus 44–64 h cultures. For 64–88 h cultures: □, MTT absorbance in serum-depleted conditions; ■, MTT absorbance in serum-containing media; ○, amount of Alizarin red bound in serum-depleted conditions; ●, amount of Alizarin red bound in serum-containing media. For 44–64 h cultures: ▽, amount of Alizarin red bound in serum-containing media. (MTT assay results for 44–64-h cultures were essentially identical to those for 64–88 h cultures and were omitted from the graph to maintain clarity.) For Alizarin red S assays, designated results (+) were significantly different from controls at p < 0.05; for MTT cell viability assays, only cultures treated with 1 mm AEBSF (*) differed significantly from controls at p < 0.05. UMR culture studies were carried out in triplicate; results shown are representative of four separate experiments. Error bars represent the means ± S.D. B, AEBSF completely inhibits mineralization within nodules of primary mouse calvarial cultures. MTT assay results and the amount of Alizarin red S bound to mineral deposits within cultures on day 12 are plotted versus the concentration of AEBSF added to cultures on day 9. □, MTT absorbance in serum-containing media; ○, amount of Alizarin red bound in serum-containing media. For Alizarin red S assays, individual data points (‡) differed significantly from controls at p < 0.05; for MTT cell viability assays, results (#) were significantly different from controls at p < 0.05. Primary culture studies were done in quadruplicate; results shown are representative of three separate experiments. Error bars represent the mean ± S.D.
To exclude the possibility that the effects of AEBSF were because of cell toxicity, AEBSF-treated and nontreated control cultures were analyzed using the MTT assay, a widely accepted assay for cell viability that measures vital mitochondria (27). As shown in Fig. 4A, AEBSF only shows toxic effects at concentrations above 0.4 mm. This outcome is similar whether cells are grown in serum-sufficient or serum-depleted conditions.
Previously, we have shown that mineralization of MC3T3 osteoblastic cells and of primary calvarial osteoblasts also occurred at sites enriched in BAG-75 (12), similar to that in the UMR model. We therefore next determined whether AEBSF could also block mineralization in primary calvarial osteoblasts. Because the length of exposure is necessarily longer than with UMR cells because of the longer time course of this mineralization model, we initially added AEBSF starting at day 0, 3, 6, or 9 and continuing until the end of the 12-day culture period (not shown). Media-containing treatments were changed every 3 days. On this basis, the minimal effective treatment window was found to be between days 9 and 12 (Fig. 4B). Specifically, 0.01–0.1 mm AEBSF was able to block mineralization completely in primary calvarial cultures when scored on day 12 (Fig. 4B and Fig. 5). Parallel assays of primary calvarial osteoblast viability showed that AEBSF had no consistent effect on cell viability (Fig. 4B). Instead, cell viability seemed to exhibit a very gradual decrease over the concentration range tested and approached 90% of the control value at 0.1 mm AEBSF. Mineralization of primary calvarial osteoblast cultures occurs within multilayered nodules (Fig. 5), whereas in UMR 106 cultures, it is initiated within spherical 20–25-μm BMF structures. Despite the clear morphological differences between these two sites of mineral nucleation, AEBSF was similarly effective in both systems (Fig. 4, A and B).
FIGURE 5. Phase contrast microscopy of mineralized and AEBSF-treated primary calvarial osteoblastic cultures.
Primary calvarial osteoblastic cells were harvested and cultured as described under “Methods.” On day 9 after plating, some of the culture wells were treated with 0.01 mm AEBSF, whereas control cultures were re-fed normal media. Unstained cultures were photographed on day 12. A, phase contrast image of control cultures. Mineralized nodules (arrows) appear as dark deposits under these conditions. B, phase contrast image of culture treated with 0.01 mm AEBSF. No mineralized nodules were visible. Results shown are representative of multiple wells and were consistent in three separate experiments. Scale bar = 500 μm.
Uptake of a 75-kDa Phosphoglycoprotein Band in the Cell Layers of Mineralizing Cultures Is Blocked by AEBSF
To examine the effect of AEBSF on the protein distribution within mineralizing UMR 106 cultures, cells were grown until 64 h at which time they were re-fed using one of the following four different media conditions: 1) 7 mm BGP only (+BGP); 2) 7 mm BGP and 0.1 mm AEBSF (+BGP + AEBSF); 3) the absence of both BGP and AEBSF (−BGP), and 4) with 0.1 mm AEBSF present but no BGP (−BGP + AEBSF). Cell layer extracts and media fractions from all four conditions were then compared using SDS-PAGE followed by staining or immunoblotting.
Following mineralization, the cell layer was extracted with either a 50 mm EDTA/CHAPS detergent solution or with an 8 m urea, 0.5% SDS, 50 mm EDTA extraction solution (see “Experimental Procedures” for details). Solubility was defined by ultracentrifugation at 108,000 × g for 1 h. Gel electrophoresis revealed that during the 24-h mineralization period (+BGP −AEBSF), a 75-kDa glyco- and phosphoprotein band is lost from the media fraction (Fig. 6A, arrows). At the same time, a similarly sized glycoprotein band appears in the cell layer fraction. This suggests uptake by the mineralizing cell layer, presumably into the BMF, because a similar glycophosphoprotein band was shown in Fig. 2 to be specifically enriched in mineralized LCM-captured BMF.
FIGURE 6. One-step extraction of UMR osteoblastic cell layer is unable to account for the quantitative loss of BAG-75 from the media fraction occurring during mineralization.
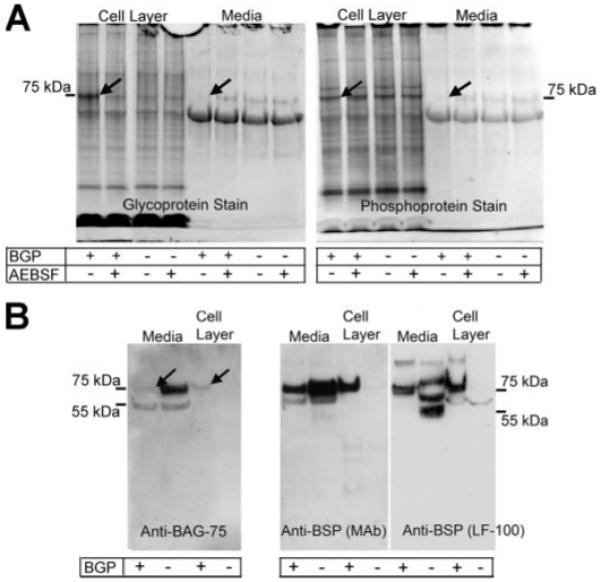
A, extraction of cell layers with 50 mm EDTA/CHAPS extraction buffer (0.1 m Tris acetate buffer (pH 7.8), containing with 0.5% octyl glucoside, 0.05% SDS, 0.05 m EDTA, and 0.02% sodium azide) reveals the loss of 75-kDa glycophosphoproteins from the media and the subsequent uptake of this band into the cell layer. Treatment of the cultures with AEBSF blocks the cell layer uptake of this same band. A, media and cell layer extracts from cell cultures treated with or without β-glycerol phosphate and with or without AEBSF. B, extraction of cell layers with 8 m urea, 50 mm EDTA, and 0.5% SDS reveals BAG-75 is lost from the media of β-glycerol phosphate-treated cultures, while unaccounted for in the cell layer extract from the same cultures. Recovery of full-length 75-kDa BSP from the cell layer of β-glycerol phosphate treated cultures, along with that for conditioned media, is comparable with that without β-glycerol phosphate; however, no BSP fragment (45–50-kDa) was detected in the cell layer fraction.
The 75-kDa glycoprotein band is likely composed of BAG-75 and BSP because they are the only two proteins of this molecular weight in total bone extracts shown to react with digoxygenin-labeled MAA lectin (see Fig. 3H). The 75-kDa phosphoprotein band is presumed to be predominantly composed of BAG-75 because BSP from bone exhibits a low phosphate content, whereas BAG-75 contains 44 phosphates/mol (35). Loss from the media fraction only occurs when mineralization is ongoing and not when it is blocked by inclusion of AEBSF or when BGP is omitted (Fig. 6A). Although similar analyses of the cell layer demonstrate that a 75-kDa glycoprotein is taken up only when mineralization is progressing, a comparable increase in phosphoprotein (e.g. BAG-75) staining is not observed (Fig. 6A, arrows). These conclusions were confirmed when similar one-step extracts were probed with monospecific antibodies (Fig. 6B). Although approximately one-half of the BSP is lost from the media fraction during mineralization (+BGP), a comparable amount of BSP became associated with the cell layer. Although BAG-75 protein was also lost from the media fraction only when mineralization occurred (media, +BGP), its recovery in the cell layer fraction was lower than expected. This is contrary to the known presence of BAG-75 antigen in BMF and nodular complexes prior to and during their mineralization in osteoblastic cell cultures (12). As a result, we reasoned that the one-step extraction method resulted in a lower than expected recovery of BAG-75.
As an alternative, a two-step sequential extraction protocol was used. To dissolve mineral crystals and release bound proteins, the cell layer was first extracted for 2 h at 4 °C with 0.05 m EDTA (pH 7.8). The residual cell layer was then treated vigorously with 8 m urea and 2% CHAPS (pH 7.8). Each extract was processed separately and subjected to SDS-PAGE, and the gels were stained with either Coomassie Blue dye or for glycoproteins or phosphoproteins. Urea/CHAPS extracts showed few differences among the four different experimental conditions (Fig. 7). In contrast, EDTA extracts of mineralizing cell layers grown only in the presence of BGP displayed dramatically increased glycoprotein- and phosphoprotein-stained bands at 50 and 75 kDa when compared directly with nonmineralizing cultures grown in the other three conditions (Fig. 7). Interestingly, total protein staining with Coomassie Blue showed a comparable pattern for all culture conditions suggesting the absence of large scale proteolysis accompanying mineral nucleation within BMF (Fig. 7). Taken together, these findings indicate that the two-step extraction method improves recoveries of unaccounted for 75- and 50-kDa glycophosphoproteins from the cell layer of mineralized cultures. These results indicate that one or more 75-kDa glycophosphoproteins present in the serum-free media compartment of UMR 106-01 cultures are specifically taken up by the cell layer (+BGP) during the mineralization period (64–88 h) (Figs. 6 and 7). Because LCM-captured BMF are highly enriched in a similar glycophosphoprotein band of 75 kDa (Fig. 2), we propose that this band is taken up from the media into the cell layer where it is specifically localized within the BMF structures. When mineralization is blocked with AEBSF, the 75-kDa glycophosphoprotein band remains in the media fraction (Fig. 7). Likewise, in the absence of BGP, the 75-kDa band remains in the media compartment (−BGP and −BGP + AEBSF) (Fig. 7).
FIGURE 7. Two-step extraction method yields increased recoveries of 75- and 50-kDa glycoprotein and phosphoprotein bands.
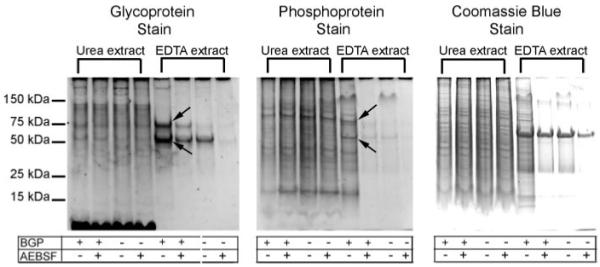
UMR cell layers were extracted first with 0.05 m EDTA and then with urea-CHAPS as described under “Experimental Procedures.” The extracts were then processed for SDS-PAGE and the gels stained with Pro-Q Emerald and Pro-Q Diamond fluorescent stains, or with Coomassie Blue. Compared with results with the one-step extraction method (Fig. 6A), increased recoveries of 75- and 50-kDa glycoprotein and phosphoprotein bands are denoted by arrows. For reference, the appearance of relevant conditioned media gel lanes is depicted in Fig. 6A; the conditioned media were unaffected by choice of cell layer extraction method.
AEBSF Inhibits the Proteolytic Cleavage of BAG-75 and BSP That Accompanies Mineralization
In view of the identification of BSP and BAG-75 as 75-kDa glycoproteins involved in mineral nucleation and the enrichment of 45–50-kDa fragments within LCM-captured BMF (Fig. 3), it was of interest to establish whether their cleavage was also susceptible to AEBSF inhibition. UMR cultures were grown in the presence or absence of AEBSF and of BGP. Resultant cell layer fractions were extracted with the two-stage extraction protocol of 0.05 m EDTA followed by 8 m urea, 2% CHAPS (see “Methods”). For comparison, all media and cell layer fractions were electrophoresed in adjacent lanes and blotted with either MAA lectin, antibody 503 (recognizes N-terminal residues number 3-13 of BAG-75), antibody 504 (recognizes BAG-75 protein), or anti-BSP antibodies (Fig. 8, A–D).
FIGURE 8. Western blotting demonstrates that AEBSF inhibits proteolytic cleavage of BAG-75 and BSP.
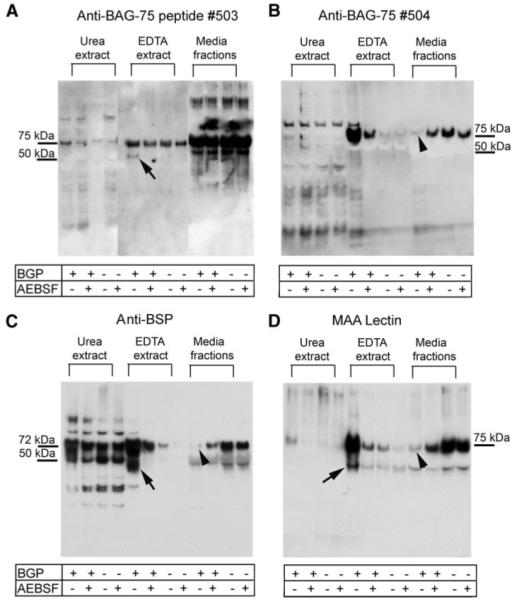
UMR cultures were grown in the presence or absence of β-glycerol phosphate and with or without 0.04 mm AEBSF inhibitor as described under “Experimental Procedures.” The conditioned media were then removed, and the cell layer was subjected to the two-step extraction method (see Fig. 7). Resultant EDTA and urea/CHAPS extracts were processed separately for immunoblotting along with the conditioned media. Immunostaining for BAG-75 (A and B) and BSP (C) proteins and MAA lectin (D) shows the presence of fragments in EDTA extracts from mineralizing conditions only (arrows) and the loss of full-length forms from the conditioned media in mineralizing conditions only (arrowheads). MAA lectin binds to both full-length BAG-75 and BSP (see Fig. 3. F–H) and shows an enrichment of 75-kDa band only in the mineralizing conditions.
Consideration of these blots revealed several interesting points. First, full-length BAG-75 and BSP are taken up by the cell layer only in the presence of BGP (Fig. 8, B and C). Second, 45–50-kDa fragments of BAG-75 (Fig. 8A) and BSP (Fig. 8C) were detected in the cell layer only when mineralization occurs. Importantly, cleavage is blocked by AEBSF coincident with inhibition of mineralization. Third, MAA lectin, which recognizes both BSP and BAG-75 (Fig. 3H), also recognizes 45–50- and 75-kDa forms in mineralized cell layer fractions (Fig. 8D). Finally, direct analyses of LCM-captured BMF have shown the 75- and 45–50-kDa fragment forms of BAG-75 and of BSP are both predominantly localized to BMF complexes (Fig. 3). In summary, AEBSF blocks uptake and cleavage of BAG-75 and BSP, as well as mineral nucleation within BMF.
In view of the known affinity of BSP and BAG-75 for hydroxyapatite crystals (35, 36), it is possible that some of the uptake by the +BGP cell layer is because of direct binding to mineral. However, a significant portion of these proteins taken up by the +BGP cell layer also occurs in the absence of mineral and of cleavage (+BGP + AEBSF) (Fig. 8, B and C). Control blots developed with MAA lectin confirm our earlier glycoprotein staining results showing redistribution of a 75-kDa glycoprotein coincident with mineral crystal nucleation (Fig. 8D). In this way, we suggest that the amount of direct protein binding to mineral crystals is represented by the difference between the respective 75-kDa bands in the +BGP versus +BGP + AEBSF lanes (Fig. 8, B and C). Although the percentage of cleaved fragment relative to full-length BAG-75 or BSP in the cell layer of mineralized cultures (+BGP) is less than 50%, the absolute amount of these stained fragments is similar to that for uncleaved precursor proteins (Fig. 8, A and C) from nonmineralized cultures (+BGP + AEBSF). It is noteworthy that nonmineralized cultures contain high levels of the uncleaved, fulllength protein in the media (Fig. 8, A–D). Taken together, the blotting data indicate that mineralization occurs coincident with uptake and/or cleavage of BAG-75 and BSP by BMF. Blockage of this cleavage by AEBSF leads to complete inhibition of mineral nucleation within BMF.
Two-dimensional SDS-PAGE Reveals That AEBSF Blocks the Cleavage and Uptake of Other Mineralization-related Proteins by the Cell Layer
Comparative analyses of EDTA extracts by SDS-PAGE (Fig. 8) prompted us to look more extensively at whether proteins other than BAG-75 and BSP have their cleavage inhibited by AEBSF. Cells were grown under serum-depleted conditions, and resultant cell layer fractions were extracted with the two-step protocol using 0.05 m EDTA and then 8 m urea, 2% CHAPS. Preparations from each cell layer extract and media fraction were subjected to two-dimensional SDS-PAGE. Gels were stained with colloidal Coomassie Blue and aligned using the PD-Quest program (Bio-Rad) to identify differences in the staining patterns for the +BGP condition compared with that for the +BGP + AEBSF condition (supplemental Figs. 1–3).
There were no major differences detected between the +BGP and the +BGP + AEBSF-treated cultures for either the urea/CHAPS extract or the media fraction (supplemental Figs. 2 and 3). However, the differences detected between the two EDTA extracts were dramatic (supplemental Fig. 1). Gel spots were selected for mass spectral peptide mapping and liquid chromatography-tandem mass spectrometry identification if at least a 2-fold difference existed in staining intensity between the two culture conditions. Over 50 protein spots in EDTA fractions from AEBSF-treated and untreated control cultures were identified (results not shown). Application of the following criteria to this list identified three additional AEBSF-sensitive cleavages. 1) Spot present in EDTA extract was absent in urea extract and in media fraction. 2) Spot exhibits substantially higher staining intensity in the +BGP condition as compared with that in +BGP + AEBSF condition. 3) Size of protein based on second dimension SDS-PAGE is at least 10% smaller than expected. 4) Apparent isoelectric point is inconsistent with that expected for full-length protein.
Table 2 provides a summary list of the five proteins whose cleavage is blocked by treatment with AEBSF. These proteins are procollagen C proteinase enhancer protein (37), bone sialoprotein, 1,25-vitamin D3 membrane-associated rapid-response steroid-binding protein, nascent polypeptide-associated complex α chain, and bone acidic glycoprotein-75.
TABLE 2.
Proteins in EDTA extract whose fragmentation is blocked by AEBSF
| Spot no. |
Protein identification | Observed mass |
Apparent mass | Expected pI | Method(s) for identification |
Peptides identified (Mascot score) |
|---|---|---|---|---|---|---|
| Da | Da | |||||
| 1 | Procollagen C proteinase enhancer protein |
48,000 | 55,000 (Ref. 37) | 8.5 | Differential staining after two-dimensional SDS-PAGE and mass spectroscopy |
fdvepdtycr (59) tgdldlpspasgtslk (49) sgtlqsnfcssslvvtgtvk (75) |
| 2 | 1,25-D3-MARRS receptor protein (ERp57) |
50,000 | 57,079 | 5.4 | Differential staining after two-dimensional SDS-PAGE and mass spectroscopy |
lnfavasr (63) ygvsgyptlk (65) lapeyeaaatr (88) fahtnveslvk (74) dlfsdghseflk (72) |
| 3 | Nascent polypeptide associated complex, α chain |
31,000 | 221,512 | 9.4 | Differential staining of two-dimensional SDS after PAGE and mass spectroscopy |
dielvmsqanvsr (75) spasdtyivfgeak (79) nilfvitkpdvyk (80) |
| Bone acidic glycoprotein-75 | 50,000 | 75–80,000 | 4.5–5.0 | One-dimensional SDS-PAGE immunoblotting |
NAa | |
| Bone sialoprotein | 45–50,000 | 75–80,000 | 6.0 | One-dimensional SDS-PAGE immunoblotting |
NA |
NA indicates not applicable.
DISCUSSION
The data presented here support the following conclusions about the mechanism of mineral crystal nucleation within spherical extracellular BMF structures. First, UMR cells mineralize equally well in the presence or absence of fetal bovine serum. Second, glycophosphoproteins BAG-75 and BSP are specifically enriched in LCM-captured mineralized BMF as compared with the total cell layer. Fragments of each protein (45–50 kDa in apparent size) were also substantially enriched within BMF. Third, a functional survey of different protease inhibitors showed that AEBSF, a covalent serine protease inhibitor, was able to specifically block mineral nucleation within BMF in UMR 106 cultures and in mineralization nodules in primary calvarial osteoblastic cultures. In the UMR model, the inhibitor was 10-fold more effective if present during the mineralization phase (64–88 h after plating) rather than during the proliferation/differentiation phase (44–64 h after plating). Similarly, in primary osteoblastic cultures, AEBSF appeared to block a step just prior to mineral crystal nucleation. Fourth, when mineralization was blocked by AEBSF, cleavage of BAG-75 and BSP was also inhibited. Furthermore, two-dimensional SDS-PAGE comparisons of UMR culture fractions in the presence and absence of AEBSF identified three other proteins (procollagen C proteinase enhancer protein, membrane-associated rapid-response steroid receptor, and nascent polypeptide associated complex α chain) whose cleavage was also blocked by this inhibitor. Fifth, although BSP and BAG-75 become enriched within BMF during their mineralization, they originally are also present in the media compartment. Taken together, our results indicate for the first time that cleavage of BAG-75, BSP, procollagen C proteinase enhancer protein, 1,25-vitamin D3-membrane-associated rapid-response steroid-binding protein, and nascent polypeptide associated complex α chain and mineral nucleation within biomineralization foci are associated with an AEBSF-sensitive protease produced by osteoblastic cells. The data suggest these proteolytic events may be a permissive step for mineralization to proceed.
Selective proteolysis or fragmentation plays a critical role in many biological processes, e.g. blood coagulation, fertilization, and complement activation, where it represents a means to regulate protein function through activation or inactivation. Serine proteases play a key role in tumor-induced bone formation and tooth mineralization. Enamel mineralization requires serine proteases enamelysin (MMP-20) and kallikrein 4 (38). Enamelysin catalyzes the cleavage of amelogenin, one of the main structural proteins forming enamel. Kallikrein 4 is responsible for degradation of enamel proteins, which results in their removal from the matrix allowing the enamel layer to fully mineralize. Previously, we showed stromelysin cleaved BAG-75 into a 50-kDa fragment in vitro (39); a similar 50-kDa fragment is found in calcified tissue and in serum (24). Preliminary data show that the level of 50-kDa fragment in serum correlates directly with bone formation following ovariectomy of rats (40). BSP has also been shown to undergo proteolysis by an endogenous protease in UMR 106 cells yielding a fragment of ~47 kDa (41). This fragment is similar in size to that produced here by the AEBSF-sensitive protease. Although cleavage of these phosphoproteins has been noted previously (above), our findings are the first to link BSP and BAG-75 fragments specifically to the site of mineral nucleation.
Because the identity of the protease responsible for endogenous fragmentation of BSP and BAG-75 in bone is presently unknown, we surveyed a wide range of competitive and noncompetitive inhibitors against serine and cysteine proteases and matrix metalloproteinases. Of all the inhibitors tested, AEBSF was the only one that had a specific effect on mineralization. Some like Pefabloc urokinase-type plasminogen activator were found to block mineralization nonspecifically because of their associated toxicity. This was identified by separate, parallel assays of cell viability. For AEBSF, toxicity was observed only at concentrations 100-fold above those found to completely block mineral nucleation in BMF, e.g. 0.01 mm.
In addition to full-length forms, EDTA extracts of the cell layer contained a 50-kDa fragment of BAG-75 and a 45-kDa fragment of BSP under mineralizing conditions only. A major source of BAG-75 and BSP was the conditioned media, because in the absence of BGP, full-length proteins were localized predominantly to the media. We have previously shown that addition of a phosphate source to 64-h cultures (mineralization-competent) is necessary to induce BSP uptake by BMF and their subsequent mineralization (12, 22); in the absence of phosphate, BAG-75 enriched BMF remain unmineralized. The 10-fold greater effectiveness of AEBSF when added to 64-h versus 44-h UMR cultures suggests that the inhibitor acts late in the differentiation phase just prior to mineral nucleation. Similarly, in primary calvarial cultures, late addition of AEBSF on day 9 proved just as effective as on days 3 or 6 during the differentiation phase (5, 25, 26, 42) suggesting that AEBSF acts preferentially during the period immediately before mineral crystal nucleation in nodules. In this way, both the UMR 106 and primary osteoblast culture models exhibited similar sensitivities to AEBSF.
Protein uptake into the cell layer (and BMF) is a selective process because comparative one-dimensional gel analyses revealed +BGP versus +BGP + AEBSF cultures differed primarily in their content of a single 75-kDa glycophosphoprotein band shown later by immunoblotting to contain BAG-75 and BSP. Interestingly, formation of both of the 45–50-kDa fragments was inhibited, and their incorporation into the cell layer was blocked by inclusion of AEBSF. However, a portion of each full-length protein remained in the EDTA extract in +BGP + AEBSF cultures, suggesting that their incorporation into the cell layer required the presence of BGP and can occur prior to cleavage. Although mineral crystals are formed within BMF in the presence of BGP, no crystals could be detected in AEBSF-treated cultures. Thus, initial binding of full-length BAG-75 and BSP likely depends upon protein-protein interactions within the BMF complex; however, their fragmentation correlates with mineral crystal nucleation. This suggests that these fragments may participate in mineral nucleation within BMF. AEBSF may be directly inhibiting a protease that is capable of cleaving BAG-75 and BSP, or alternatively, the inhibition may be indirect, involving multiple proteases. Further work will be necessary to identify the AEBSF-sensitive protease and to determine whether it acts directly.
This is the first report of a serine protease requirement for bone mineral nucleation. Capable of diffusing through bilayer membranes, AEBSF is a covalent serine protease inhibitor. It has been used previously to block trypsin activation of protease-activated receptor in A-549 epithelial cultures (43) and in monocyte cultures to inhibit superoxide release following tumor necrosis factor-α or platelet-activating factor stimulation (44). AEBSF inactivates a wide variety of serine proteases, including chymotrypsin, urokinase plasminogen activator, kallikrein, plasmin, thrombin, furin, and trypsin (45–47). However, more specific inhibitors against most of these proteases were unable to block mineralization. Two possible explanations are that the effect of AEBSF may not be due to a proteolytic enzyme (AEBSF has also been identified as an inhibitor of phospholipase D (48)) or that a more specific inhibitor for the AEBSF-sensitive protease may not be available. In view of the identification of five proteins whose cleavage is blocked by AEBSF, the evidence strongly supports a role for a serine protease in mineralization.
All five proteins whose cleavage is inhibited by AEBSF are associated directly or indirectly in the process of bone mineralization. BSP is associated with mineralization in bone, teeth, and breast cancer (49–51). Both a 38-kDa mid-protein fragment and a 25-kDa N-terminal fragment of this protein have been identified as nucleators of mineralization in vitro (21). Procollagen C proteinase enhancer protein is a secreted protein that enhances the activity of extracellular matrix procollagen C-terminal proteinase (BMP-1), an enzyme that activates fibrillar assembly of type I procollagen. Procollagen C proteinase enhancer protein knock-out mice increase the diameter of their long bones to apparently compensate for diminished mechanical performance (52). In 1997 an “active” fragment of this protein was identified in 3T6 fibroblast cells by Hulmes et al. (53) who suggested that cleavage of this protein was required for the formation of the extracellular matrix that will later support mineralization. The product of procollagen C-terminal proteinase cleavage of procollagen I is type I collagen C-terminal propeptide. Nicolaidou et al. (54) showed type I collagen C-terminal propeptide rose following vitamin K treatment and correlated with an increase in bone mineral density. The use of this by-product of procollagen type I processing as a marker for bone formation (55) suggests that enhancer activation and inhibition in our system may relate to its osteogenic role. Along with collagen type I, other substrates of procollagen C-terminal proteinase (BMP-1) include collagen type VII (55, 56) and collagens type II and type III (57).
1,25D3-MARRS is a membrane-associated vitamin D-binding protein necessary for calcium and phosphate uptake into the cell for support of bone development (58, 59). In 2005, Sterling and Nemere (60) showed that addition of an antibody against 1,25D3-MARRS, or protein kinase C inhibitor calphostin C, inhibited vitamin D-stimulated phosphate uptake in chick intestinal cell cultures. Calcium transport has also been shown to be regulated by vitamin D binding to 1,25D3-MARRS in aged female chicken intestine, as determined by dose-response curves for ion transport and kinetics (61). Because 1,25D3-MARRS is a plasma membrane protein, we speculate that its presence in the EDTA cell layer extract may reflect an association with released membrane-bound vesicles participating in the process of mineral nucleation or proteolytic release from the cell (46).
Finally, nascent polypeptide-associated complex α chain is a large 220-kDa cytosolic protein that translocates newly synthesized polypeptides to the nucleus. A C-terminal fragment of this protein was previously identified in an epithelial cell line (62), and all three peptides identified in our mass spectroscopic MS/MS peptide studies were localized to this same fragment (Table 2). Identification of an intracellular protein in the EDTA extract seems counterintuitive (Table 2). However, we hypothesize that intracellular proteins may become entrapped within secretory vesicles contributing to the assembly of BMF. Alternatively, BMF formation may involve the blebbing of the plasma membrane and release of vesicular structures containing selected cytoplasmic contents.
In summary, the results indicate that cleavage of BAG-75, BSP, 1,25D3-MARRS protein, nascent polypeptide associated complex α chain, and procollagen propeptidase enhancer by an unidentified osteoblast-derived serine protease is associated with mineral nucleation. The fact that both BAG-75 and BSP and their fragments are preferentially localized to mineralizing BMF sites and that inhibition of their cleavage blocks mineral nucleation within BMF suggests that each plays a functional role in this process. Future studies will address the identity of the protease and effect of cleavage on the structure/function of these proteins.
Supplementary Material
Acknowledgments
J. P. G. acknowledges the excellent technical assistance of Sharon Midura and the generous assistance of Dr. William Landis with initial laser capture microscopy.
Footnotes
This work was supported by National Institutes of Health Grants R21 DE14619 (to J. P. G.) and R01 AR052775 (to J. P. G.) and small grants from the Women’s Council of the University of Missouri, Kansas City (to N. T. H.). Parts of this research were presented in preliminary form at the annual meeting of the American Society for Biochemistry and Molecular Biology, June 12–16, 2004, Boston, MA; the American Society for Bone and Mineral Research, September 23–27, 2005, Nashville, TN; and the American Society for Bone and Mineral Research, September 15–19, 2006, Philadelphia, PA. The costs of publication of this article were defrayed in part by the payment of page charges. This article must therefore be hereby marked “advertisement” in accordance with 18 U.S.C. Section 1734 solely to indicate this fact.
- BMF
- biomineralization foci
- AEBSF
- 4-(2-aminoethyl)benzenesulfonylfluoride HCl
- FBS
- fetal bovine serum
- BSP
- bone sialoprotein
- BAG-75
- bone acidic glycoprotein-75
- BGP
- β-glycerol phosphate
- BSA
- bovine serum albumin
- +CL
- total cell layer extract from BGP-treated cultures
- −CL
- total cell layer extract from cultures not treated with BGP
- MAA
- Maackia amurensis agglutinin
- MS/MS
- tandem mass spectrometry
- LC
- liquid chromatography
- SKI-1
- subtilisin kexin isozyme-1
- LCM
- laser capture microscope
- 1,25D3-MARRS
- 1,25-vitamin D3-membrane-associated rapid-response steroid-binding protein
- CHAPS
- 3-[(3-cholamidopropyl)dimethylammonio]-1-propanesulfonic acid
- CAPS
- 3-(cyclohexylamino)propanesulfonic acid
- MTT
- 3-(4,5-dimethylthiazol-2-yl)-2,5-diphenyltetrazolium bromide
- MEM
- minimal essential medium
- MAA
- Maackia amurensis agglutinin
N. T. Huffman and J. P. Gorski, unpublished results.
J. P. Gorski and R. J. Midura, manuscript in preparation.
REFERENCES
- 1.Olsen BR. In: Primer on the Metabolic Bone Diseases and Disorders of Mineral Metabolism. Favus M, editor. Lippincott/Williams & Wilkins; Philadelphia: 2006. pp. 1–6. [Google Scholar]
- 2.Dempster DW, Lian JB, Goldring SR. In: Primer on the Metabolic Bone Diseases and Disorders of Mineral Metabolism. Favus M, editor. Lippincott/Williams & Wilkins; Philadelphia: 2006. pp. 7–11. [Google Scholar]
- 3.Aubin JE, Lian JB, Stein GS, Goldring SR. In: Primer on the Metabolic Bone Diseases and Disorders of Mineral Metabolism. Favus M, editor. Lippincott/Williams & Wilkins; Philadelphia: 2006. pp. 20–29. [Google Scholar]
- 4.Gehron Robey P, Boskey AL, Lian JB, Goldring SR. In: Primer on the Metabolic Bone Diseases and Disorders of Mineral Metabolism. Favus M, editor. Lippincott/Williams & Wilkins; Philadelphia: 2006. pp. 12–19. [Google Scholar]
- 5.Bellows CG, Aubin JE, Heersche JN. Bone Miner. 1991;14:27–40. doi: 10.1016/0169-6009(91)90100-e. [DOI] [PubMed] [Google Scholar]
- 6.Turner CH, Akhter MP, Raab DM, Kimmel DB, Recker RR. Bone (Elmsford) 1991;12:73–79. doi: 10.1016/8756-3282(91)90003-2. [DOI] [PubMed] [Google Scholar]
- 7.Schinke T, McKee MD, Karsenty G. Nat. Genet. 1999;21:150–151. doi: 10.1038/5928. [DOI] [PubMed] [Google Scholar]
- 8.Murshed M, Harmey D, Millan JL, McKee MD, Karsenty G. Genes Dev. 2005;19:1093–1104. doi: 10.1101/gad.1276205. [DOI] [PMC free article] [PubMed] [Google Scholar]
- 9.Luo G, Ducy P, McKee MD, Pinero GJ, Loyer E, Behringer RR, Karsenty G. Nature. 1997;386:78–81. doi: 10.1038/386078a0. [DOI] [PubMed] [Google Scholar]
- 10.Murshed M, Schinke T, McKee MD, Karsenty G. J. Cell Biol. 2004;165:625–630. doi: 10.1083/jcb.200402046. [DOI] [PMC free article] [PubMed] [Google Scholar]
- 11.Gorski JP, Wang A, Lovitch D, Law D, Powell K, Midura RJ. J. Biol. Chem. 2004;279:25455–25463. doi: 10.1074/jbc.M312408200. [DOI] [PubMed] [Google Scholar]
- 12.Midura RJ, Wang A, Lovitch D, Law D, Powell K, Gorski JP. J. Biol. Chem. 2004;279:25464–25473. doi: 10.1074/jbc.M312409200. [DOI] [PubMed] [Google Scholar]
- 13.Bonucci E. Calcif. Tissue Int. 1979;29:181–182. doi: 10.1007/BF02408077. [DOI] [PubMed] [Google Scholar]
- 14.Bonucci E, Silvestrini G, di Grezia R. Connect. Tissue Res. 1989;22:43–50. 53–61. [PubMed] [Google Scholar]
- 15.Anderson HC. Clin. Orthop. Relat. Res. 1995;314:266–280. [PubMed] [Google Scholar]
- 16.Lee DD, Glimcher MJ. Connect. Tissue Res. 1989;21:247–257. doi: 10.3109/03008208909050014. [DOI] [PubMed] [Google Scholar]
- 17.Arsenault AL. J. Electron Microsc. Technol. 1991;18:262–268. doi: 10.1002/jemt.1060180308. [DOI] [PubMed] [Google Scholar]
- 18.Wiesmann HP, Meyer U, Plate U, Hohling HJ. Int. Rev. Cytol. 2005;242:121–156. doi: 10.1016/S0074-7696(04)42003-8. [DOI] [PubMed] [Google Scholar]
- 19.Gericke A, Qin C, Spevak L, Fujimoto Y, Butler WT, Sorensen ES, Boskey AL. Calcif. Tissue Int. 2005;77:45–54. doi: 10.1007/s00223-004-1288-1. [DOI] [PMC free article] [PubMed] [Google Scholar]
- 20.Hunter GK, Goldberg HA. Proc. Natl. Acad. Sci. U. S. A. 1993;90:8562–8565. doi: 10.1073/pnas.90.18.8562. [DOI] [PMC free article] [PubMed] [Google Scholar]
- 21.Goldberg HA, Warner KJ, Stillman MJ, Hunter GK. Connect. Tissue Res. 1996;35:385–392. doi: 10.3109/03008209609029216. [DOI] [PubMed] [Google Scholar]
- 22.Wang A, Martin JA, Lembke LA, Midura RJ. J. Biol. Chem. 2000;275:11082–11091. doi: 10.1074/jbc.275.15.11082. [DOI] [PubMed] [Google Scholar]
- 23.Bianco P, Riminucci M, Silvestrini G, Bonucci E, Termine JD, Fisher LW, Robey PG. J. Histochem. Cytochem. 1993;41:193–203. doi: 10.1177/41.2.8419459. [DOI] [PubMed] [Google Scholar]
- 24.Gorski JP, Griffin D, Dudley G, Stanford C, Thomas R, Huang C, Lai E, Karr B, Solursh M. J. Biol. Chem. 1990;265:14956–14963. [PubMed] [Google Scholar]
- 25.Kalajzic I, Kalajzic Z, Kaliterna M, Gronowicz G, Clark SH, Lichtler AC, Rowe D. J. Bone Miner. Res. 2002;17:15–25. doi: 10.1359/jbmr.2002.17.1.15. [DOI] [PubMed] [Google Scholar]
- 26.Kalajzic I, Staal A, Yang WP, Wu Y, Johnson SE, Feyen JH, Krueger W, Maye P, Yu F, Zhao Y, Kuo L, Gupta RR, Achenie LE, Wang HW, Shin DG, Rowe DW. J. Biol. Chem. 2005;280:24618–24626. doi: 10.1074/jbc.M413834200. [DOI] [PubMed] [Google Scholar]
- 27.Mosmann T. J. Immunol. Methods. 1983;65:55–63. doi: 10.1016/0022-1759(83)90303-4. [DOI] [PubMed] [Google Scholar]
- 28.Laemmli UK. Nature. 1970;227:680–685. doi: 10.1038/227680a0. [DOI] [PubMed] [Google Scholar]
- 29.Gorski JP, Liu FT, Artigues A, Castagna LF, Osdoby P. J. Biol. Chem. 2002;277:18840–18848. doi: 10.1074/jbc.M109578200. [DOI] [PubMed] [Google Scholar]
- 30.Keightley JA, Shang L, Kinter M. Mol. Cell. Proteomics. 2004;3:167–175. doi: 10.1074/mcp.M300119-MCP200. [DOI] [PubMed] [Google Scholar]
- 31.Perkins DN, Pappin DJ, Creasy DM, Cottrell JS. Electrophoresis. 1999;20:3551–3567. doi: 10.1002/(SICI)1522-2683(19991201)20:18<3551::AID-ELPS3551>3.0.CO;2-2. [DOI] [PubMed] [Google Scholar]
- 32.Witzmann FA, Clack JW, Geiss K, Hussain S, Juhl MJ, Rice CM, Wang C. Electrophoresis. 2002;23:2223–2232. doi: 10.1002/1522-2683(200207)23:14<2223::AID-ELPS2223>3.0.CO;2-D. [DOI] [PubMed] [Google Scholar]
- 33.Termine JD, Kleinman HK, Whitson SW, Conn KM, McGarvey ML, Martin GR. Cell. 1981;26:99–105. doi: 10.1016/0092-8674(81)90037-4. [DOI] [PubMed] [Google Scholar]
- 34.Citron M, Diehl TS, Capell A, Haass C, Teplow DB, Selkoe DJ. Neuron. 1996;17:171–179. doi: 10.1016/s0896-6273(00)80290-1. [DOI] [PubMed] [Google Scholar]
- 35.Gorski JP, Shimizu K. J. Biol. Chem. 1988;263:15938–15945. [PubMed] [Google Scholar]
- 36.Stubbs JT, III, Mintz KP, Eanes ED, Torchia DA, Fisher LW. J. Bone Miner. Res. 1997;12:1210–1222. doi: 10.1359/jbmr.1997.12.8.1210. [DOI] [PubMed] [Google Scholar]
- 37.Kessler E, Adar R. Eur. J. Biochem. 1989;186:115–121. doi: 10.1111/j.1432-1033.1989.tb15184.x. [DOI] [PubMed] [Google Scholar]
- 38.Yamakoshi Y, Hu JC, Fukae M, Yamakoshi F, Simmer JP. Eur. J. Oral Sci. 2006;114(Suppl 1):45–51. doi: 10.1111/j.1600-0722.2006.00281.x. [DOI] [PubMed] [Google Scholar]
- 39.Kremer EA, Chen Y, Suzuki K, Nagase H, Gorski JP. J. Bone Miner. Res. 1998;13:1890–1902. doi: 10.1359/jbmr.1998.13.12.1890. [DOI] [PubMed] [Google Scholar]
- 40.Gorski JP, Fullenkamp C, Paul DC, Black LJ, Williams DC. J. Bone Miner. Res. 1991;6(Suppl 1):100. [Google Scholar]
- 41.Mintz KP, Grzesik WJ, Midura RJ, Robey PG, Termine JD, Fisher LW. J. Bone Miner. Res. 1993;8:985–995. doi: 10.1002/jbmr.5650080812. [DOI] [PubMed] [Google Scholar]
- 42.Sudo H, Kodama HA, Amagai Y, Yamamoto S, Kasai S. J. Cell Biol. 1983;96:191–198. doi: 10.1083/jcb.96.1.191. [DOI] [PMC free article] [PubMed] [Google Scholar]
- 43.Sachse F, von Eiff C, Stoll W, Becker K, Rudack C. Clin. Exp. Immunol. 2006;144:534–542. doi: 10.1111/j.1365-2249.2006.03089.x. [DOI] [PMC free article] [PubMed] [Google Scholar]
- 44.Megyeri P, Pabst KM, Pabst MJ. Immunology. 1995;86:629–635. [PMC free article] [PubMed] [Google Scholar]
- 45.Chu TM, Kawinski E. Biochem. Biophys. Res. Commun. 1998;253:128–134. doi: 10.1006/bbrc.1998.9760. [DOI] [PubMed] [Google Scholar]
- 46.Okada T, Haze K, Nadanaka S, Yoshida H, Seidah NG, Hirano Y, Sato R, Negishi M, Mori K. J. Biol. Chem. 2003;278:31024–31032. doi: 10.1074/jbc.M300923200. [DOI] [PubMed] [Google Scholar]
- 47.Omondi JG, Stark JR. Appl. Biochem. Biotechnol. 2001;90:137–153. doi: 10.1385/abab:90:2:137. [DOI] [PubMed] [Google Scholar]
- 48.Andrews B, Bond K, Lehman JA, Horn JM, Dugan A, Gomez-Cambronero J. Biochem. Biophys. Res. Commun. 2000;273:302–311. doi: 10.1006/bbrc.2000.2938. [DOI] [PubMed] [Google Scholar]
- 49.Castronovo V, Bellahcene A. Int. J. Oncol. 1998;12:305–308. doi: 10.3892/ijo.12.2.305. [DOI] [PubMed] [Google Scholar]
- 50.Chen JK, Shapiro HS, Wrana JL, Reimers S, Heersche JN, Sodek J. Matrix. 1991;11:133–143. doi: 10.1016/s0934-8832(11)80217-9. [DOI] [PubMed] [Google Scholar]
- 51.MacNeil RL, Berry J, D’Errico J, Strayhorn C, Piotrowski B, Somerman MJ. Connect. Tissue Res. 1995;33:1–7. doi: 10.3109/03008209509016974. [DOI] [PubMed] [Google Scholar]
- 52.Steiglitz BM, Kreider JM, Frankenburg EP, Pappano WN, Hoffman GG, Meganck JA, Liang X, Hook M, Birk DE, Goldstein SA, Greenspan DS. Mol. Cell. Biol. 2006;26:238–249. doi: 10.1128/MCB.26.1.238-249.2006. [DOI] [PMC free article] [PubMed] [Google Scholar]
- 53.Hulmes DJ, Mould AP, Kessler E. Matrix Biol. 1997;16:41–45. doi: 10.1016/s0945-053x(97)90115-3. [DOI] [PubMed] [Google Scholar]
- 54.Nicolaidou P, Stavrinadis I, Loukou I, Papadopoulou A, Georgouli H, Douros K, Priftis KN, Gourgiotis D, Matsinos YG, Doudounakis S. Eur. J. Pediatr. 2006;165:540–545. doi: 10.1007/s00431-006-0132-1. [DOI] [PubMed] [Google Scholar]
- 55.Brittingham R, Colombo M, Ito H, Steplewski A, Birk DE, Uitto J, Fertala A. J. Biol. Chem. 2005;280:191–198. doi: 10.1074/jbc.M406210200. [DOI] [PubMed] [Google Scholar]
- 56.Colombo M, Brittingham RJ, Klement JF, Majsterek I, Birk DE, Uitto J, Fertala A. Biochemistry. 2003;42:11434–11442. doi: 10.1021/bi034925d. [DOI] [PubMed] [Google Scholar]
- 57.Njieha FK, Morikawa T, Tuderman L, Prockop DJ. Biochemistry. 1982;21:757–764. doi: 10.1021/bi00533a028. [DOI] [PubMed] [Google Scholar]
- 58.Nemere I. Steroids. 2005;70:455–457. doi: 10.1016/j.steroids.2005.02.005. [DOI] [PubMed] [Google Scholar]
- 59.Zhao B, Nemere I. J. Cell. Biochem. 2002;86:497–508. doi: 10.1002/jcb.10246. [DOI] [PubMed] [Google Scholar]
- 60.Sterling TM, Nemere I. J. Endocrinol. 2005;185:81–91. doi: 10.1677/joe.1.05945. [DOI] [PubMed] [Google Scholar]
- 61.Larsson B, Nemere I. J. Cell. Biochem. 2003;90:901–913. doi: 10.1002/jcb.10696. [DOI] [PubMed] [Google Scholar]
- 62.Mossabeb R, Seiberler S, Mittermann I, Reininger R, Spitzauer S, Natter S, Verdino P, Keller W, Kraft D, Valenta R. J. Investig. Dermatol. 2002;119:820–829. doi: 10.1046/j.1523-1747.2002.00518.x. [DOI] [PubMed] [Google Scholar]
Associated Data
This section collects any data citations, data availability statements, or supplementary materials included in this article.