

Abstract
G protein coupled receptors (GPCRs) are seven transmembrane proteins that mediate the majority of cellular responses to hormones and neurotransmitters. They are the largest group of therapeutic targets for a broad spectrum of diseases. Recent crystal structures of GPCRs1,2,3,4,5 reveal structural conservation extending from the orthosteric ligand binding site in the transmembrane core to the cytoplasmic G protein coupling domains. In contrast, the extracellular surface (ECS) of GPCRs is remarkably diverse, and therefore represents an ideal target for the discovery of subtype-selective drugs. However, little is known about the functional role of the ECS in receptor activation, or about conformational coupling of this surface to the native ligand binding pocket. Here we use NMR spectroscopy to investigate ligand-specific conformational changes around a central structural feature in the ECS of the β2 adrenergic receptor: a salt bridge linking extracellular loops (ECLs) 2 and 3. Small molecule drugs that bind within the transmembrane core and exhibit different efficacies towards G protein activation (agonist, neutral antagonist, and inverse agonist) also stabilize distinct conformations of the ECS. We thereby demonstrate conformational coupling between the ECS and the orthosteric binding site, showing that drugs targeting this diverse surface could function as allosteric modulators with high subtype selectivity. Moreover, these studies provide new insight into the dynamic behavior of GPCRs not addressable by static, inactive-state crystal structures.
In the ligand-free basal state, GPCRs exist in an equilibrium of conformations6. Ligand binding modulates receptor function by stabilizing different intramolecular interactions and establishing a new conformational equilibrium. Activating ligands (agonists) stabilize receptor conformations that increase signaling through G proteins; inhibiting ligands (inverse agonists) stabilize other conformations that decrease the basal, agonist-independent level of signaling (Supplementary Fig. 1). When a GPCR is activated, structural changes occur in the cytoplasmic G protein coupling domains. These changes have been characterized for several receptors, including rhodopsin7,8,9,10 and the β2 adrenergic receptor (β2AR)11,12,13. Recent solid-state NMR data show that light activation of rhodopsin also induces conformational changes in ECL214. In rhodopsin, ECL2 forms a structured cap over the covalently-bound ligand retinal and interacts with transmembrane (TM) segments involved in activation. However, little is known about the effects of diffusible ligand binding on the extracellular domains of other Family A GPCRs, where ECL2 is displaced away from the ligand binding pocket. Here we show that ligands known to differentially affect cytoplasmic domain conformation also stabilize distinct ECS conformations (Supplementary Fig. 1).
Understanding conformational changes in the ECS of GPCRs may provide new avenues for drug design. Comparing the crystallographically identified orthosteric binding pockets of β2AR and β1AR reveals that 15 of 16 amino acids (94%) are identical1,5. This observation underscores the challenge of identifying subtype-selective drugs for families containing several closely-related receptors (e.g., adrenergic, serotonin, or dopamine receptors)15. In contrast, while the backbone structure of the β2AR and β1AR extracellular domains are similar, 22 of 39 residues (56%) in ECLs 2 and 3 differ. Therefore, the ECS provides a diverse site for the development of subtype-selective drugs.
The majority of the β2AR ECS consists of ECL2, connecting TMs 4 and 5, and ECL3, connecting TMs 6 and 7 (Figure 1a)1,2. ECL2 forms a two-turn α-helix that is displaced away from the ligand binding site entrance (Fig. 1b). Two disulfide bonds stabilize ECL2, one within the loop and one to the end of TM3. A salt bridge formed by Lys3057.32 and Asp192ECL2 connects ECL3-TM7 to ECL2 (superscripts indicate Ballesteros-Weinstein numbering for conserved GPCR residues)16. Carazolol is an inverse agonist that binds in the orthosteric pocket formed by transmembrane segments (TMs) 3, 5, 6, and 7. The only direct interaction between the ECS and carazolol is through an aromatic interaction with Phe193ECL2. Given these specific associations between ECLs, the orthosteric ligand binding site, and TMs involved in activation17, we hypothesized that β2AR extracellular domains and the associated salt bridge rearrange upon activation.
Figure 1. Extracellular domains of carazolol-bound β2AR (PDB: 2RH1).

a, The extracellular surface (ECS) of β2AR showing extracellular loop 2 (ECL2, cyan, Met171-Ala198), extracellular loop 3 (ECL3, dark blue, His296-Glu306), Lys3057.32 (magenta), Asp192 (yellow), and inverse agonist carazolol (green). ECL1 (Met96-Phe108) is part of the ECS but is not colored. b, Intramolecular and ligand binding interactions. Spheres indicate the alpha carbons of residues in direct contact with carazolol (at least one atom within 4 Å distance). Disulfide bonds are shown as yellow sticks. Other colors are the same as in a. Transmembrane helices 1 and 2 removed for clarity. D192 and K305 form the only lysine salt bridge observed in the crystal structure. The solvent accessibility of D192 and K305 was calculated with the NACCESS program (Hubbard & Thornton). The relative accessibilities of D192 and K305 are 35% and 75%, respectively, compared to the accessibility of that residue type in an extended Ala-x-Ala tripeptide30.
To monitor the environment around the Lys305-Asp192 salt bridge by NMR, we selectively carbon-13 labeled lysine side chains in a modified β2AR (β2AR365) by reductive methylation18 (see Scheme 1, Methods Summary, Supporting Methods, Supplementary Figs. 2-4 and Supplementary Table 1). This approach exploits the sensitivity of methyl groups as NMR probes for analysis of large protein structure and dynamics19. Reductive methylation adds two [13C]methyl groups to the ε-NH2 of lysine side chains and the α-NH2 at the receptor amino terminus. The [13C]dimethyllysines serve as conformational probes in two-dimensional 1H-13C correlation NMR experiments. Dimethylation does not alter the lysine positive charge (Scheme 1) and causes little structural perturbation20. We observed no significant changes between the crystal structure of a methylated-β2AR/Fab complex bound to carazolol and that of the non-methylated receptor (Supplementary Fig. 5 and Supplementary Table 2). Reductively [13C]methylated β2AR ([13C]methyl-β2AR) has ligand binding properties identical to unlabeled β2AR, and G-protein coupling is unimpaired (Supplementary Fig. 6).
| [1] |
Intense peaks from dimethylamines (dimethyllysines and the dimethyl-amino terminus) are observed in the 1H-13C NMR spectrum of [13C]methyl-β2AR bound to the inverse agonist carazolol in detergent buffer (Fig. 2, dimethylamine region; Supplementary Fig. 7, full spectral width). We used both HSQC and saturation transfer differencing (STD)-filtered HMQC pulse sequences throughout this work; STD-filtered HMQC improved spectral quality at the expense of longer acquisition times (Supplementary Fig. 8).
Figure 2. Dimethyllysine NMR spectroscopy of [13C]methyl-β2AR and assignment of Lys305.
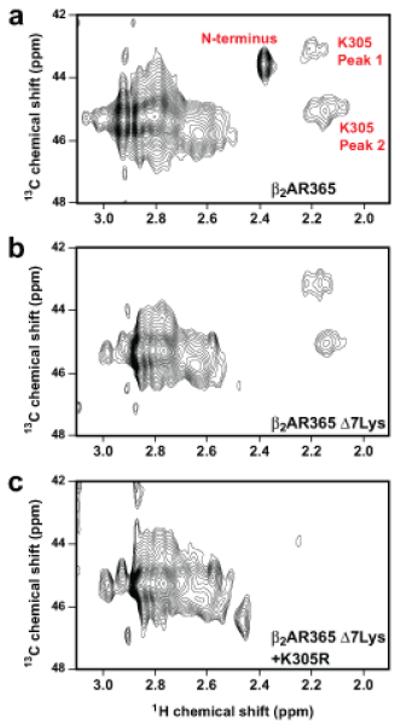
a, Dimethylamine region of STD-filtered HC-HMQC spectrum of carazolol-bound β2AR365, containing 14 Lys and amino terminal FLAG-TEV sequence (Supplementary Fig. 2). b, Spectrum of β2AR365 with seven cytoplasmic Lys to Arg mutations (β2AR365 Δ7Lys) and the amino terminus removed by TEV proteolysis. c, Spectrum of β2AR365 Δ7Lys plus the Lys305Arg mutation and the amino terminus removed by TEV proteolysis.
Several features of the [13C]methyl-β2AR NMR spectrum are notable (Fig. 2a). The sharpest peak is assigned to the dimethyl-amino terminus based on protease digestion (Fig. 2b and Supplementary Fig 9). The remaining peaks are assigned to dimethyllysines. The region is dominated by a cluster of overlapping peaks (centered at 1H chemical shift 2.8 ppm) attributed to solvent exposed, highly mobile lysines. The intensity of this cluster is reduced by ≈50% following mutation of seven cytoplasmic lysines to arginine (Fig. 2b and Supplementary Fig. 10). Two broad dimethyllysine peaks are shifted upfield in the 1H dimension (Fig. 2a, Peaks 1 and 2). These peaks represent the two [13C]methyl groups on Lys305, as determined by mutation of Lys305 to Arg (Fig. 2c and Supplementary Fig. 10). The fine structure features in Peaks 1 and 2 might suggest conformational heterogeneity; however, they are most likely due to relatively low signal-to-noise ratios and subtle baseline distortions.
Lys305 is the only lysine that forms a salt bridge in the β2AR crystal structure, consistent with the unique chemical shifts of Peaks 1 and 2. The presence of two peaks implies that the two methyl groups on Lys305 exist in non-equivalent chemical environments21,22,23. The two peaks merge under conditions of increased temperature and ionic strength, presumably due to weakening of the salt bridge (Supplementary Fig. 11). Reduction of the disulfide bonds stabilizing ECL2 in the β2AR abolishes the Lys305 peaks (Supplementary Fig. 12), demonstrating that the salt bridge is sensitive to conformational changes in the ECS. Taken as a whole, these data show that the Lys305-Asp192 salt bridge is formed in solution as well as in crystal lattices for carazolol-bound β2AR2,24. This conclusion is further supported by measurements of 13C transverse relaxation (T2) times indicating restricted motion of Lys305 compared with other β2AR lysines (Supplementary Fig. 13 and Supplementary Table 3).
The Lys305 peaks are a probe for conformational changes in the receptor ECS. Both peaks are present in the NMR spectrum of unliganded β2AR indicating that the Lys305-Asp192 salt bridge also forms in the basal state (Fig. 3a). Two differences are seen relative to the carazolol-bound state (Fig. 3b). First, Peaks 1 and 2 have a larger upfield shift in the 1H dimension. Second, the 13C chemical shift separation between Peaks 1 and 2 is increased. These data show that carazolol binding alters the chemical environment around Lys305, demonstrating a change in the ECS. In contrast to inverse agonists, neutral antagonists (e.g., alprenolol) do not alter basal receptor activity. As might be predicted based on ligand efficacy, NMR detects no difference in Lys305 chemical shifts between unliganded and alprenolol-bound β2AR (Fig. 3c).
Figure 3. Effect of inverse agonist and antagonist on the [13C]dimethyl-Lys305 NMR resonances.
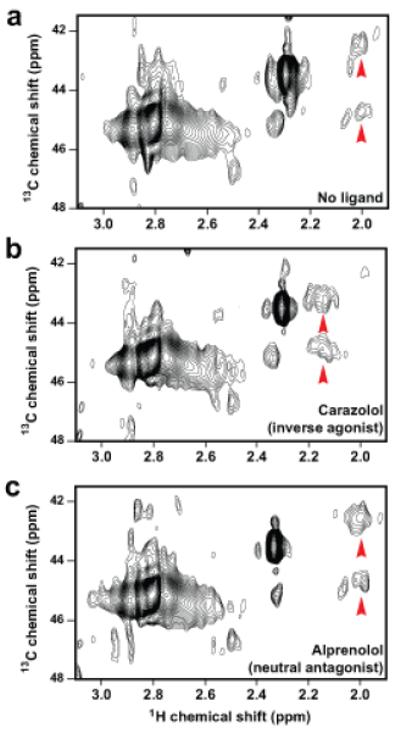
HSQC spectra of a, unliganded β2AR (≈60 μM), b, β2AR bound to inverse agonist carazolol and c, β2AR bound to neutral antagonist alprenolol.
The inverse agonist-induced conformational change (Fig. 3) likely involves Phe193 in ECL2 (Fig. 1b), which forms a favorable edge-to-face interaction with the tricyclic aromatic ring of carazolol in the β2AR crystal structure1. Nearly identical interactions are observed with other inverse agonists: Phe193 and timolol in β2AR24, and the homologous Phe201 and cyanopindolol in β1AR5. By contrast, alprenolol has a single aromatic ring that cannot interact strongly with Phe193 when docked at the carazolol position. Molecular dynamics simulations show that Phe193 adopts the trans conformation pointing toward TM5 in the presence of carazolol, but has increased mobility and is able to assume multiple conformations in the alprenolol-bound state (Supplementary Fig. 14). Phe193 can form close encounters (< 5 Å) with the Lys305 amine when alprenolol is bound. Therefore, the observed upfield chemical shift change of Peaks 1 and 2 in alprenolol-bound receptor relative to carazolol-bound receptor is most likely due to aromatic ring current effects, although we cannot exclude other changes in ECS conformation.
Agonists induce ECS conformational changes that differ from inverse agonists. Adding formoterol, a β2AR agonist with nanomolar affinity, attenuates the Lys305 resonances (Fig. 4a, b). The effect is titratable (Supplementary Fig. 15) and reverses when formoterol is exchanged to carazolol by dialysis (Fig. 4c). Attenuation of Lys305 resonances was also observed with another, structurally distinct high-affinity agonist (Supplementary Fig. 16). These NMR data suggest that the Lys305-Asp192 salt bridge is weakened in the β2AR active state. Loss of interaction with Asp192 would abolish the unique chemical environment of Lys305. Based on the β2AR crystal structure, we estimate that a distance increase of 2.9 Å between the C-alpha carbons of Asp192 and Lys305 is the minimum needed to disrupt the geometrical criteria for a salt bridge established by Kumar and Nussinov25. At equilibrium, the fraction of Lys305 liberated from the salt bridge would be indistinguishable from solvent-exposed lysines (at 2.8 ppm 1H chemical shift), explaining the absence of any new peaks. Alternatively, if agonists induce conformational fluctuations on the millisecond time scale, line broadening would attenuate the signal for Lys305. In either case, we interpret the formoterol-induced conformational change as a relative motion between ECL3-TM7 and ECL2. Conformational changes involving ECL2 are compatible with circular dichroism experiments demonstrating agonist induced changes in the extracellular disulfide bond linking ECL2 and TM3 in the 5-HT4(a) receptor26.
Figure 4. Activation of β2AR by formoterol.

STD-filtered HMQC spectra of a, unliganded β2AR (≈60 μM), b, the same sample bound to a saturating concentration (320 μM) of agonist (R,R)-formoterol, and c, the same sample after exchanging formoterol for inverse agonist carazolol by dialysis. d, Model of β2AR activation by formoterol (see Supplementary Fig. 16). Colored helices, loops, and side chains represent the carazolol-bound crystal structure (PDB: 2RH1). Gray helices and white side chains indicate the active state model. Green sticks indicate (R,R)-formoterol and yellow indicates ECL2. e, Overlay of spectra corresponding to dashed regions shown in panels a-c. The spectrum of unliganded β2AR from panel a is shown in black, agonist-bound β2AR from panel b in green, and inverse agonist-bound β2AR from panel c in red.
Based on our NMR results and computational modeling, we propose that the extracellular ends of TMs 6 and 7 move upon activation (Fig. 4d). Briefly, formoterol-activated β2AR was modeled based on the crystal structure of ligand-free opsin9 and a relaxed conformation of the highly distorted Pro2886.50-induced kink (Supplementary Fig. 17). In this active state model, an inward movement at the extracellular end of TM6 permits the known interaction between Asn2936.55 and the chiral β-hydroxyl of the agonist27. This motion, simultaneous with outward motion at the intracellular end of TM6 towards TM59, agrees with the activation model derived from engineering GPCRs with metal ion binding sites28,29. The TM6 motion necessitates a lateral displacement of TM7 that reorients the Lys3057.32 salt bridge in agreement with NMR spectroscopy (Fig. 4). Inverse agonists may function in part by stabilizing bulky hydrophobic interactions with Phe193ECL2 that block TM6 motion.
In summary, NMR spectroscopy can be used to investigate structural changes in GPCRs, although the isotopic labeling methods employed here are limited to monitoring changes in the environment and dynamics of accessible lysine side chains. We provide direct biophysical evidence for three distinct conformations of the β2AR extracellular surface: one for an unliganded receptor or a neutral antagonist, one for an inverse agonist, and one for an agonist (Fig. 4e). These conformations correspond to distinct functional behavior. Unliganded and alprenolol-bound β2AR are both able to couple to Gs, consistent with the basal activity of the receptor and the efficacy of alprenolol (neutral antagonist). In contrast, the inverse agonist carazolol prevents receptor-Gs coupling. Finally, agonists promote the strongest coupling. Ligands binding to the extracellular surface could therefore modulate receptor function, either by influencing the binding of orthosteric ligands or by direct allosteric modulation of cytoplasmic domain conformation (Supplementary Fig. 1). While the specific salt bridge used to monitor these conformations may not be present in other GPCRs, it is ideally positioned to monitor ECS conformations in the β2AR, and it is likely that our findings regarding ligand-induced changes in the ECS are relevant for other Family A GPCRs.
Methods Summary
NMR spectroscopy of [13C]-methyl β2AR
Human β2AR, tagged with an N-terminal FLAG-TEV sequence, and truncated after residue Gly365 (β2AR365, Supplementary Fig. 2) was expressed in Sf9 insect cells using recombinant baculovirus. Sf9 cell membranes were solubilized with dodecylmaltoside and purified by sequential antibody affinity and alprenolol affinity chromatography, as previously described3. 13C methyl labeling was performed by sequentially adding excess sodium cyanoborohydride followed by [13C]-formaldehyde to purified β2AR. Methylation reagents were removed by extensive dialyisis (unliganded β2AR) or by anion exchange chromatography (carazolol-bound β2AR). For NMR spectroscopy, [13C]-methyl β2AR was dialyzed against buffer containing 20 mM HEPES (pH 7.4), 100 mM NaCl, and 0.1% dodecylmaltoside prepared in 98% D2O and concentrated to a final concentration of 50 to 200 μM. Two-dimensional 1H-13C correlation spectra of [13C]-methyl β2AR were recorded at 800 MHz for approximately eight hours (HSQC) or 24 hours (STD-filtered HMQC) at 25 °C. Both pulse sequences used WATERGATE water suppression. See Supplementary Fig. 8 for all parameters and full details of NMR spectroscopy.
Crystal structure of [13C]methyl-β2AR / Fab5 complex
[13C]methyl-β2AR / Fab5 complex was prepared and crystallized as previously described3. Diffraction images were obtained on a microfocus beam line, and the structure solved by molecular replacement using β2AR-Fab5 (2R4R) as a search model.
Full Methods and any associated references are available in the online version of the paper at www.nature.com/nature.
Methods
Buffers
Buffer A is 20 mM HEPES (pH 7.4), 100 mM NaCl, 0.1% dodecylmaltoside. Buffer B is 20 mM HEPES (pH 7.4), 80 mM NaCl, 0.1% dodecylmaltoside. Buffer C is 20 mM HEPES (pH 7.4), 60 mM NaCl, 0.1% dodecylmaltoside. Buffer D is 20 mM HEPES (pH 7.4), 350 mM NaCl, 0.1% dodecylmaltoside. Buffer E is Buffer A + CaCl2 (2 mM), 0.01% cholesterol hemisuccinate. Buffer F is Buffer A + EDTA (5 mM), 0.01% cholesterol hemisuccinate
Preparation of modified β2 adrenergic receptors for NMR
The coding sequence of wild-type human β2 adrenergic receptor (β2AR) was cloned into the pFastBac1 Sf9 insect cell expression vector (Invitrogen) and modified as previously described3. For small-scale expression trials (≤ 1 L), recombinant baculovirus was made using the Bac-to-Bac system (Invitrogen). For large NMR and crystallography-scale expressions, the β2AR cDNA was subcloned into the pVL1392 transfer vector and recombinant baculovirus made using the BestBac system (Expression Systems, Woodland, CA). All cells were cultured in ESF 921 insect cell medium (Expression Systems). β2AR365 (Supplementary Fig. 2) was expressed in Sf9 insect cells infected with baculovirus and solubilized in 1% n-dodecyl-β-D-maltopyranoside (dodecylmaltoside, Anatrace) according to previously described methods31. M1 FLAG affinity chromatography (Sigma) was used as the initial purification step. FLAG-purified receptor was treated with 100 μM tris(2-carboxyethyl)phosphine followed by two additions of 2 mM iodoacetamide (two times, for 1 hr each on ice) to alkylate reactive cysteines that can cause disulfide aggregation (these and all other reagents were from Sigma unless otherwise noted). Alternatively, β2AR365 was labeled with the cysteine-reactive fluorophore monobromobimane prior to alkylation, to assess ligand-induced conformational changes32. Alkylation was quenched by addition of 5 mM L-cysteine. Functional β2AR365 was then selectively purified by alprenolol-Sepharose chromatography31. The next preparation steps varied depending on the particular NMR sample being prepared.
Preparation of Carazolol-bound [13C]-methyl β2AR365
β2AR365 (purified by alprenolol-Sepharose) was reductively methylated by sequentially adding 10 mM freshly prepared sodium cyanoborohydride, briefly vortexing, and then adding 10 mM 13C-enriched (99%) formaldehyde (CLM-806-1, Cambridge Isotope Labs). We feel that the order of reagent addition is important. We prefer to first set a reducing environment in solution to avoid protein cross-linking by formaldehyde. The reductive methylation reaction was then allowed to proceed overnight (minimum 8 hr) at 4 °C with nutation. A second addition of sodium cyanoborohydride and [13C]formaldehyde was made exactly as before, followed by another 4 hr incubation at 4 °C. [13C]-methyl β2AR365 was then dialysed extensively against Buffer A + 1 μM carazolol, to remove unreacted methylation reagents and exchange alprenolol for carazolol.
Reductive methylation destroys the antigenicity of the M1 FLAG epitope, so we could not use a second M1 FLAG affinity step to concentrate [13C]methyl-β2AR365 to NMR concentrations. The receptor was instead loaded onto Q Sepharose anion exchange resin equilibrated in Buffer B. We estimate the capacity of Q Sepharose to be ≈2.5 mg [13C]methyl-β2AR365 per mL of resin. Binding is largely mediated through the acidic FLAG epitope (amino acid sequence DYKDDDDA), since TEV-cleaved β2AR365 does not bind tightly to Q Sepharose resin. The column was then washed with three column volumes of Buffer C + 1 μM Carazolol, and eluted with Buffer D + 1 μM Carazolol. A one-tenth volume of a saturated cholesterol hemisuccinate solution in Buffer A was added to the eluate to enhance receptor stability. [13C]methyl β2AR365 typically eluted at a concentration of ≈100 μM as determined by measurement of carazolol fluorescence33. N-linked glycosylations were removed by treatment with PNGase F (750 units / mg of β2AR365) for 1 hr at room temperature (New England BioLabs). The sample was dialyzed extensively against Buffer A + 100 nM carazolol, followed by two dialysis steps against a small volume (≈25 mL) of Buffer A prepared in 98% D2O (Cambridge Isotope Labs) + 100 nM carazolol. Receptor was then concentrated to ≈200 μM with a 100 kDa molecular weight cutoff (MWCO) Vivaspin concentrator (Vivascience). It is important to wash the concentrator membrane extensively with water, followed by D2O, to remove as much glycerol as possible that may interfere with NMR spectroscopy.
Final NMR samples (≈270 μL) were loaded into Shigemi microtubes susceptibility matched to D2O (Shigemi Inc., Allison Park, PA) and sealed. Carazolol-bound [13C]-methyl β2AR samples remained stable for over four months with no visible precipitation, degradation of NMR spectral quality, or decrease in bound carazolol fluorescence. This method was used to prepare the samples shown in Main Text Fig. 2a and Supplementary Figs. 7-9 and 13.
Preparation of unliganded [13C]-methyl β2AR365
β2AR365 (purified by alprenolol-Sepharose, 2 mM CaCl2 added) was loaded directly onto M1 resin for a second FLAG affinity step. After loading, the column was washed at 10 mL/hr with six column volumes of Buffer E + 30 μM atenolol. Atenolol is an antagonist with relatively low affinity for the β2AR (Kd ≈ 1 μM)34. This wash step was included to displace the higher affinity antagonist alprenolol (Kd ≈ 1 nM) from β2AR365 by competition. The FLAG M1 column was then washed extensively with Buffer E to remove atenolol and guarantee that all bound ligand was removed. Unliganded β2AR365 was then eluted with Buffer F + FLAG peptide (100 μg/mL). Glycosylations were removed by treatment with PNGase F as described above. Receptor was dialyzed against Buffer A using a 20 kDa MWCO dialysis cassette (Slide-A-Lyzer, Pierce) to ensure removal of FLAG peptide prior to [13C]methylation. FLAG peptide (amino acid sequence DYKDDDDK) has three primary amines that can be [13C]methylated and cause undesirable NMR background.
Unliganded β2AR365 was reductively methylated (as described above), dialyzed against Buffer A to remove labeling reagents, dialyzed against Buffer A prepared in 98% D2O, and concentrated for NMR as described above. This method was used to prepare the samples shown in Main Text Fig. 3 and 4, and Supplementary Figs. 12 and 15. Ligand additions to unliganded [13C]methyl-365N NMR samples were made from ligand stocks dissolved in perdeuterated dimethyl d6-sulfoxide (DLM-10-10, Cambridge Isotope Labs). (R,R)-Formoterol was a kind gift of Sepracor (Marlborough, MA).
Preparation of Carazolol-bound [13C]methyl-β2AR365 mutants for Lysine-305 peak assignment
To facilitate assignment of dimethyllysine Peaks 1 and 2 (Main Text, Fig. 2a), we developed a small-scale expression and purification technique that yields an NMR sample of carazolol-bound β2AR365 (≈2-3 mg) from 1-2 liters of Sf9 cells. We modified β2AR365 to include a carboxyl terminus hexahistidine tag for nickel affinity chromatography31. Six histidine codons were added to the β2AR365 cDNA between the Gly365 and STOP codons (β2AR365-His).
To maximize yield of β2AR365-His, we directly added 200 nM carazolol to the culture media at the time of baculovirus infection. Buffers for all subsequent purification steps also included a minimum of 200 nM carazolol. We have observed that inverse agonists improve cell surface expression and help to stabilize the receptor during solubilization. However, the affinity of β2AR for carazolol (Kd < 0.1 nM) is sufficiently high that binding is essentially irreversible. This precludes the use of alprenolol-Sepharose chromatography as a functional purification step. Instead, β2AR365-His was first purified by FLAG affinity chromatography. Reactive cysteines were alkylated as described above and the protein was dialyzed extensively against Buffer A to remove FLAG peptide. Reductive methylation was performed as described above. [13C]methyl-β2AR365-His was then purified by nickel affinity chromatography (Chelating Sepharose Fast Flow, GE Healthcare) as previously described31. Final NMR dialysis and concentration was performed as described above. This method was used to prepare the samples shown in Main Text Fig. 2b-c, and Supporting Figs. 10 and 11.
Crystallographic data collection and processing
Crystals of reductively methylated β2AR365-Fab5 complex were generated essentially as described in Rasmussen et al. and were isomorphous to the non-methylated receptor-Fab5 complex3. Data collection was carried out using the 10 μm collimated microfocus beamline 23ID-B of the APS. A data set comprising 316° of oscillation data was obtained from a single crystal (see Supplementary Table 2). Due to radiation damage, only 5 to 10° of data (1° per frame) could be measured before the crystal was translated to a new position. Data were processed with HKL200035. Similar to the previous β2AR24/365–Fab5 complex data reduction, global post-refinement of the unit cell parameters was not performed. Rather, the unit cell parameters were obtained from indexing and refinement from one wedge of data, and were subsequently used for processing the remaining data without unit cell constant refinement.
Structure solution and refinement
The structure of the methylated β2AR365–Fab5 complex was solved by initially performing rigid body refinement in CNS36 using the unmethylated β2AR24/365–Fab5 complex structure (PDB code 2R4S) as a single rigid body. This gave R and Rfree values of 0.358 and 0.348, respectively. Multiple rounds of manual rebuilding, positional refinement, grouped temperature factor refinement, and TLS refinement were performed using the PHENIX package37, bringing R and Rfree values down to 0.233 and 0.274, respectively. As in the previous β2AR24/365–Fab5 complex refinement3, only those residues that could be unambiguously assigned were included in the final model. In addition to the residues present in the β2AR24/365–Fab5 structure (PDB 2R4S), receptor residues 35-36, 91, and 307-310 were included in the methylated β2AR365–Fab5 model. The following receptor residues were modeled as alanine due to insufficient electron density to model full sidechains: 36, 39, 42, 49, 53, 55, 63, 69, 77, 112, 114, 120, 122, 131, 147, 156, 209, 227, 232, 263, 279, 287, 308, 309, 321, 324, 326, 332.
Supplementary Material
Acknowledgements
We acknowledge support from National Institutes of Health Grants NS028471 (B.K.K.) and GM56169 (W.I.W.), the Stanford Medical Scientist Training Program (M.P.B), the Lundbeck Foundation (S.G.F.R.), the University of Copenhagen and 7TM Pharma (R.N.), and the Instituto de Salud Carlos III (L.P.).
Footnotes
Supplementary Information is linked to the online version of the paper at www.nature.com/nature
Coordinates and structure factors for [13C]methyl-β2AR / Fab5 are deposited in the Protein Data Bank (accession code 3KJ6).
References
- 1.Rosenbaum DM, et al. GPCR engineering yields high-resolution structural insights into beta2-adrenergic receptor function. Science. 2007;318:1266–73. doi: 10.1126/science.1150609. [DOI] [PubMed] [Google Scholar]
- 2.Cherezov V, et al. High-resolution crystal structure of an engineered human beta2-adrenergic G protein-coupled receptor. Science. 2007;318:1258–65. doi: 10.1126/science.1150577. [DOI] [PMC free article] [PubMed] [Google Scholar]
- 3.Rasmussen SG, et al. Crystal structure of the human beta2 adrenergic G-protein-coupled receptor. Nature. 2007;450:383–7. doi: 10.1038/nature06325. [DOI] [PubMed] [Google Scholar]
- 4.Jaakola VP, et al. The 2.6 angstrom crystal structure of a human A2A adenosine receptor bound to an antagonist. Science. 2008;322:1211–7. doi: 10.1126/science.1164772. [DOI] [PMC free article] [PubMed] [Google Scholar]
- 5.Warne T, et al. Structure of a beta1-adrenergic G-protein-coupled receptor. Nature. 2008;454:486–91. doi: 10.1038/nature07101. [DOI] [PMC free article] [PubMed] [Google Scholar]
- 6.Kobilka BK, Deupi X. Conformational complexity of G-protein-coupled receptors. Trends Pharmacol Sci. 2007;28:397–406. doi: 10.1016/j.tips.2007.06.003. [DOI] [PubMed] [Google Scholar]
- 7.Farrens DL, Altenbach C, Yang K, Hubbell WL, Khorana HG. Requirement of rigid-body motion of transmembrane helices for light activation of rhodopsin. Science. 1996;274:768–70. doi: 10.1126/science.274.5288.768. [DOI] [PubMed] [Google Scholar]
- 8.Altenbach C, Kusnetzow AK, Ernst OP, Hofmann KP, Hubbell WL. High-resolution distance mapping in rhodopsin reveals the pattern of helix movement due to activation. Proc Natl Acad Sci U S A. 2008;105:7439–44. doi: 10.1073/pnas.0802515105. [DOI] [PMC free article] [PubMed] [Google Scholar]
- 9.Park JH, Scheerer P, Hofmann KP, Choe HW, Ernst OP. Crystal structure of the ligand-free G-protein-coupled receptor opsin. Nature. 2008;454:183–7. doi: 10.1038/nature07063. [DOI] [PubMed] [Google Scholar]
- 10.Scheerer P, et al. Crystal structure of opsin in its G-protein-interacting conformation. Nature. 2008;455:497–502. doi: 10.1038/nature07330. [DOI] [PubMed] [Google Scholar]
- 11.Ghanouni P, et al. Functionally different agonists induce distinct conformations in the G protein coupling domain of the beta(2) adrenergic receptor. J Biol Chem. 2001;276:24433–24436. doi: 10.1074/jbc.C100162200. [DOI] [PubMed] [Google Scholar]
- 12.Swaminath G, et al. Probing the beta2 adrenoceptor binding site with catechol reveals differences in binding and activation by agonists and partial agonists. J Biol Chem. 2005;280:22165–71. doi: 10.1074/jbc.M502352200. [DOI] [PubMed] [Google Scholar]
- 13.Yao X, et al. Coupling ligand structure to specific conformational switches in the beta2-adrenoceptor. Nat Chem Biol. 2006;2:417–22. doi: 10.1038/nchembio801. [DOI] [PubMed] [Google Scholar]
- 14.Ahuja S, et al. Helix movement is coupled to displacement of the second extracellular loop in rhodopsin activation. Nat Struct Mol Biol. 2009;16:168–75. doi: 10.1038/nsmb.1549. [DOI] [PMC free article] [PubMed] [Google Scholar]
- 15.Conn PJ, Christopoulos A, Lindsley CW. Allosteric modulators of GPCRs: a novel approach for the treatment of CNS disorders. Nat Rev Drug Discov. 2009;8:41–54. doi: 10.1038/nrd2760. [DOI] [PMC free article] [PubMed] [Google Scholar]
- 16.Ballesteros JA, Weinstein H. Integrated methods for the construction of three-dimensional models and computational probing of structure-function relations in G-protein coupled receptors. Methods Neurosci. 1995;25:366–428. [Google Scholar]
- 17.Nygaard R, Frimurer TM, Holst B, Rosenkilde MM, Schwartz TW. Ligand binding and micro-switches in 7TM receptor structures. Trends Pharmacol Sci. 2009;30:249–59. doi: 10.1016/j.tips.2009.02.006. [DOI] [PubMed] [Google Scholar]
- 18.Zhang M, Vogel HJ. Determination of the side chain pKa values of the lysine residues in calmodulin. J Biol Chem. 1993;268:22420–8. [PubMed] [Google Scholar]
- 19.Tugarinov V, Hwang PM, Ollerenshaw JE, Kay LE. Cross-correlated relaxation enhanced 1H[bond]13C NMR spectroscopy of methyl groups in very high molecular weight proteins and protein complexes. J Am Chem Soc. 2003;125:10420–8. doi: 10.1021/ja030153x. [DOI] [PubMed] [Google Scholar]
- 20.Jentoft JE, Jentoft N, Gerken TA, Dearborn DG. 13C NMR studies of ribonuclease A methylated with [13C]Formaldehyde. J Biol Chem. 1979;254:4366–70. [PubMed] [Google Scholar]
- 21.Gerken TA, Jentoft JE, Jentoft N, Dearborn DG. Intramolecular interactions of amino groups in 13C reductively methylated hen egg-white lysozyme. J Biol Chem. 1982;257:2894–900. [PubMed] [Google Scholar]
- 22.Sherry AD, Teherani J. Physical studies of 13C-methylated concanavalin A. pH- and Co2+-induced nuclear magnetic resonance shifts. J Biol Chem. 1983;258:8663–9. [PubMed] [Google Scholar]
- 23.Abraham SJ, Hoheisel S, Gaponenko V. Detection of protein-ligand interactions by NMR using reductive methylation of lysine residues. J Biomol NMR. 2008;42:143–8. doi: 10.1007/s10858-008-9274-y. [DOI] [PubMed] [Google Scholar]
- 24.Hanson MA, et al. A specific cholesterol binding site is established by the 2.8 A structure of the human beta2-adrenergic receptor. Structure. 2008;16:897–905. doi: 10.1016/j.str.2008.05.001. [DOI] [PMC free article] [PubMed] [Google Scholar]
- 25.Kumar S, Nussinov R. Relationship between ion pair geometries and electrostatic strengths in proteins. Biophys J. 2002;83:1595–612. doi: 10.1016/S0006-3495(02)73929-5. [DOI] [PMC free article] [PubMed] [Google Scholar]
- 26.Baneres JL, et al. Molecular characterization of a purified 5-HT4 receptor: a structural basis for drug efficacy. J Biol Chem. 2005;280:20253–60. doi: 10.1074/jbc.M412009200. [DOI] [PubMed] [Google Scholar]
- 27.Wieland K, Zuurmond HM, Krasel C, Ijzerman AP, Lohse MJ. Involvement of Asn-293 in stereospecific agonist recognition and in activation of the beta 2-adrenergic receptor. Proc Natl Acad Sci U S A. 1996;93:9276–81. doi: 10.1073/pnas.93.17.9276. [DOI] [PMC free article] [PubMed] [Google Scholar]
- 28.Elling CE, et al. Metal ion site engineering indicates a global toggle switch model for seven-transmembrane receptor activation. J Biol Chem. 2006;281:17337–46. doi: 10.1074/jbc.M512510200. [DOI] [PubMed] [Google Scholar]
- 29.Schwartz TW, Frimurer TM, Holst B, Rosenkilde MM, Elling CE. Molecular mechanism of 7TM receptor activation--a global toggle switch model. Annu Rev Pharmacol Toxicol. 2006;46:481–519. doi: 10.1146/annurev.pharmtox.46.120604.141218. [DOI] [PubMed] [Google Scholar]
- 30.Hubbard SJ, Campbell SF, Thornton JM. Molecular recognition. Conformational analysis of limited proteolytic sites and serine proteinase protein inhibitors. J Mol Biol. 1991;220:507–30. doi: 10.1016/0022-2836(91)90027-4. [DOI] [PubMed] [Google Scholar]
- 31.Kobilka BK. Amino and carboxyl terminal modifications to facilitate the production and purification of a G protein-coupled receptor. Anal Biochem. 1995;231:269–71. doi: 10.1006/abio.1995.1533. [DOI] [PubMed] [Google Scholar]
- 32.Yao XJ, et al. The effect of ligand efficacy on the formation and stability of a GPCR-G protein complex. Proc Natl Acad Sci U S A. 2009;106:9501–9506. doi: 10.1073/pnas.0811437106. [DOI] [PMC free article] [PubMed] [Google Scholar]
- 33.Tota MR, Strader CD. Characterization of the binding domain of the beta-adrenergic receptor with the fluorescent antagonist carazolol. Evidence for a buried ligand binding site. J Biol Chem. 1990;265:16891–7. [PubMed] [Google Scholar]
- 34.Baker JG. The selectivity of beta-adrenoceptor antagonists at the human beta1, beta2 and beta3 adrenoceptors. Br J Pharmacol. 2005;144:317–22. doi: 10.1038/sj.bjp.0706048. [DOI] [PMC free article] [PubMed] [Google Scholar]
- 35.Otwinowski Z, Minor W. Processing of X-ray diffraction data collected in oscillation mode. Macromolecular Crystallography, Pt A. 1997;276:307–326. doi: 10.1016/S0076-6879(97)76066-X. [DOI] [PubMed] [Google Scholar]
- 36.Brunger AT, et al. Crystallography & NMR system: A new software suite for macromolecular structure determination. Acta Crystallographica Section D-Biological Crystallography. 1998;54:905–921. doi: 10.1107/s0907444998003254. [DOI] [PubMed] [Google Scholar]
- 37.Adams PD, et al. PHENIX: building new software for automated crystallographic structure determination. Acta Crystallographica Section D-Biological Crystallography. 2002;58:1948–1954. doi: 10.1107/s0907444902016657. [DOI] [PubMed] [Google Scholar]
Associated Data
This section collects any data citations, data availability statements, or supplementary materials included in this article.