Abstract
Lava domes are one of the conspicuous topographic features on volcanoes. The subsurface structure of the lava dome is important to discuss its formation mechanism. In the 1944 eruption of Volcano Usu, Hokkaido, a new lava dome was formed at its eastern foot. After the completion of the lava dome, various geophysical methods were applied to the dome to study its subsurface structure, but resulted in a rather ambiguous conclusion. Recently, from the results of the levelings, which were repeated during the eruption, “pseudo growth curves” of the lava dome were obtained. The curves suggest that the lava dome has a bulbous shape. In the present work, muon radiography, which previously proved effective in imaging the internal structure of Volcano Asama, has been applied to the Usu lava dome. The muon radiography measures the distribution of the “density length” of volcanic bodies when detectors are arranged properly. The result obtained is consistent with the model deduced from the pseudo growth curves. The measurement appears to afford useful method to clarify the subsurface structure of volcanoes and its temporal changes, and in its turn to discuss volcanic processes. This is a point of contact between high-energy physics and volcano physics.
Keywords: muon radiography, structure of lava dome, deformation analysis
Introduction
Tanaka et al. 1), 2) first applied the muon radiography to Asama in 2006 to image the topographical changes of the crater bottom related with its 2000 eruption, and found a low density region that suggests a drain-back-induced porous conduit right below the lava mound. The imaging method by cosmic-ray muon is, in principle, the same as that of medical X-ray radiography. We use attenuation and absorption of muons by materials of geological interest. When a beam of muon is transmitted through any heterogeneous object, it is differentially absorbed, depending upon the varying thickness and density of this object. The image registered on a nuclear emulsion film adjacent to the target material constitutes a radiograph of its interior. It can be used for visualization of inaccessible internal parts. Since cosmic-ray muons are particles generated in the atmosphere, and continuously bombard the earth’s surface from above, we can perform radiography at anytime and anywhere on the earth.
The muon radiography is applied to the 1944 Usu lava dome which extruded as a parasitic cone of Usu, Hokkaido. It was formed not in the crater, but in a flat cornfield at the foot of the volcano. Throughout the period of the dome formation, for more than 17 months, seismometric and geodetic observations were continuously carried out by several pioneering geophysicists. In 1952–54, after its formation, the dome was explored by geophysical and geochemical methods, but its subsurface structure has remained unclear. Recently, Yokoyama 3), 4) analyzed the results of the precise levels along the route traversing the eastern foot of the new dome obtained by Minakami, 5) and deduced quasi growth curves of the lava dome. From these curves, the internal structure of the lava dome was inferred, but they have remained hypothetical. To confirm its validity, the muon radiography is performed.
The 1944 lava dome of Usu
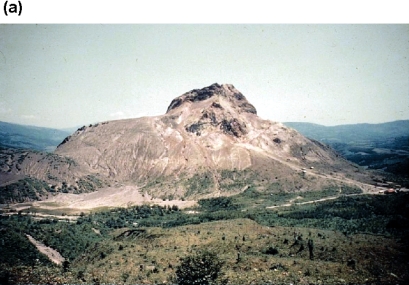
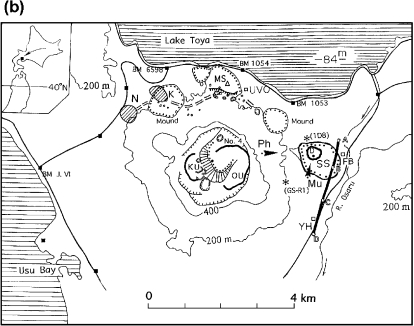
Usu is located 70 km southwest of Sapporo City and erupted four times in the 20-th century —1910, 1944, 1977 and 2000—. Each eruption was observed by then available standard methods. Of these eruptions, only the 1944 eruption produced a lava dome (SS in Fig. 1b), a parasitic cone of Usu, called “Showa-shinzan” (new mountain born in the Showa era in Japanese). Showa-shinzan, in fact, consists of a lava dome and a mound as seen in Fig. 1. Usu has three lava domes, two at the summit formed in 1769 (KU) and 1853 (OU), and Showa-shinzan (SS) on the eastern foot. The dome magmas are all relatively viscous dacite containing 69% SiO2. Yokoyama 6) introduced “macroscopic viscosity” in the discussion of growth rates of lava domes applying the Hagen-Poiseuille Law on the assumption that the dimensions of conduits do not vary with different volcanoes. That viscosity corresponds to those of lavas averaged for the course of dome formation, i.e., their temperature is assumed approx. 1000°C. The macroscpic viscosity of the 1944 lava dome is estimated at approx. 106 Pa.s (Yokoyama, 6) Fig. 1).
Fig. 1.
(a) The 1944 Usu lava dome and mound (Showa-shinzan) seen from the eastern rim of Usu (Ph in the bottom figure) as of 1958. (b) Topographic sketch map of Usu as of 2002. Thick contours show lava domes and contours with dots volcanic mounds. SS; the 1944 lava dome, D; top of the SS dome, MS; the 1910 mound, KU; the 1769 lava dome, OU; the 1853 lava dome. (GS-R1), (1D8); boreholes, K and N; explosion areas of the 2000 eruption. A thick line A-B-C-D shows the route of precise levels. Mu shows the location of the muon detector.
The formation of the 1944 lava dome should be an important example to discuss dome formations generally, because it extruded on an apparently virgin ground where there was no sign of former craters, and its growth was observed instrumentally though not perfectly. The observational data of the 1944 lava dome, the present authors believe, must give us fundamental information for model experiments and theoretical simulations for crustal deformation.
The 1944 eruption activity began with an earthquake swarm on the last day of 1943 at the eastern foot of the volcano, and the doming activity began in May 1944 at Yanagihara (YH in Fig. 1b) and migrated approx. 2 km northward to Fukaba (FB). The ascending magma first uplifted the ground, forming a mound, and apparently contacted the aquifer in June, causing violent phreatic explosions around the point D in Fig. 1b. Finally the magma extruded through the mound to form the lava dome in November 1944 and completed its uplift around October 1945. The activity was observed from start to finish by geodetic and seismometric methods as reported by Minakami et al. 7) Yokoyama and Seino 8) presented a diagram of magma ascent in relation to the 1944 eruption. Hayakawa et al. 9) applied various methods to Showa-shinzan to explore its underground structure in 1952–54, as a project of the Geological Survey of Japan. They tentatively concluded that the upper part of the lava dome is approx. 400 m in diameter at a depth of 200 m below the top (200 m a.s.l.). They succeeded in finding the distribution of seismic wave velocities within the lava dome but could not detect the shape of the deeper part, including the conduit, probably because the deeper part was not voluminous and the conduit was too narrow in comparison with the wave lengths of the applied seismic waves.
Deformation analysis of the lava dome
We find in a few papers, e.g. Fukutomi, 10) Minakami 5) and Minakami et al., 7) the observational reports of seismicity and deformation that accompanied the 1944 eruption. In the following, a growth curve of the lava dome will be discussed on the basis of these papers.
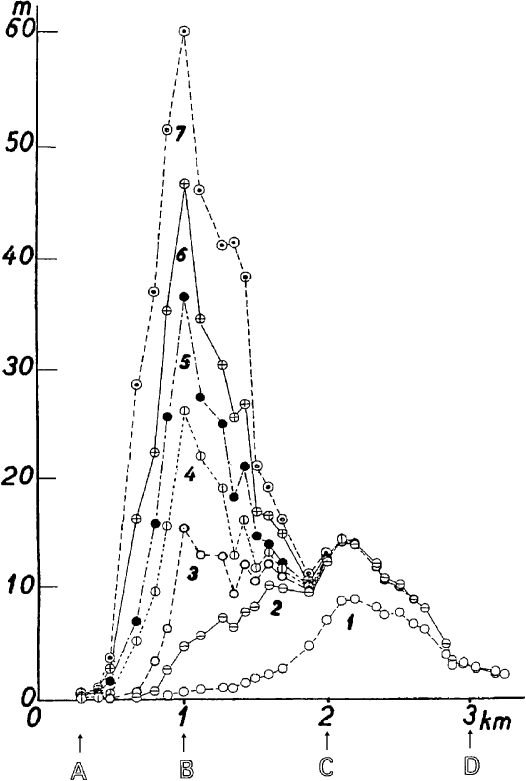
Minakami 5) repeated precise levels along the 3 km long road traversing the eastern foot of Usu, from A to D, in Fig. 1b, and behind Showa-Shinzan in Fig. 1a. The survey was first made on March 29, 1944 and repeated 7 times with averaged intervals of 2 months. The last survey was on May 19, 1945 when the maximum upheaval of the route reached about 60 m and the road was abandoned. The leveling route grazed the deformed area at a distance of approx. 500 m from the center of the dome (D in Fig. 1b). In this paper, the results of the precise levels shall be utilized to figure the growth curves of the 1944 lava dome itself. The results of the precise levels are shown in Fig. 2, where the errors of the surveys were within 1 cm. In the figure, the deformation first took place at Yanagihara (YH in Fig. 1) at the southern part of the route and migrated toward the north. Fukaba (FB) or the point B became the center of inflation from Survey No. 3 until the end of the observations.
Fig. 2.
Results of repeated precise levels at the eastern base of the 1944 dome (SS) after Minakami. 5) The periods of the Survey Nos. 1–7 are indicated at the left of Fig. 3.
In the following, we seek after “pseudo growth curves” from the results of the precise levels, because true curves should be observed along a route passing the eruption site on the dome (D in Fig. 1b). To figure out the growth curves for the dome, we need to know the relationship between the true height change of the dome and the vertical displacements of the leveling route. Yokoyama and Seino 8) discussed the magma movement in the 1944 eruption and estimated an approximate upheaval rates. The true heights of the lava dome at Survey Nos. 5, 6 and 7 were determined by the transit observations. We noticed that the surface upheaved smoothly in general. The relationship, estimated by the least-square method, was that 1 m of upheaval along the leveling route corresponded to approx. 4.2 m upheaval of the point D, that was on the mound in early period and later on the lava dome.
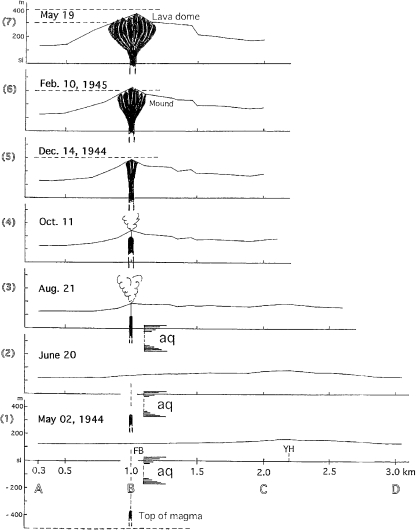
If we assume that the upheaval of the dome takes the form of a circular cone with its vertical axis at the center of the dome, the vertical sections of the dome at any distance should be similar to each other and roughly hyperbolic. Pseudo profiles of the growing mound and lava dome were obtained by magnifying by 4.2 times the displacements of the leveling route, as shown in Fig. 3 where the estimate of the magma column at each stage, in relation with the aquifer levels at borehole GS-R1 and 1D8 (Fig. 1b), is also indicated.
Fig. 3.
Pseudo growth curves of the 1944 dome. The benchmarks on the abscissa are distributed at an interval of approx. 100 m as the same as Fig. 2. Explosion activity was high between Survey Nos. 2 and 3. aq; aquifer, FB; Fukaba, YH; Yanagihara.
In Fig. 3, we do not know the exact diameter of the conduit at each stage, but the explosion craterlets of this volcano seem to provide some information on this point because diameters of conduits are usually smaller than those of explosion openings; The space surrounded by the three craterlets on the mound before the dome extrusion was roughly 60 m across (Minakami et al., 5) Fig. 8) and the opening of No. 4 craterlet (Fig. 1b) of the 1977 eruption formed by a single violent explosion was approx. 100 m across (Yokoyama and Seino, 8) Photo. 1). Thus we may assume the diameter of the magma column was smaller than 100 m.
As seen in Figs. 2 and 3, the mound expanded laterally in proportion as it uplifted vertically until Survey No. 6, and did so noticeably before Survey No. 7. In Fig. 3, the profile No. 1 is almost flat, and the phreatic explosion began 3 days after profile No. 2. The deformation due to magma intrusion is focused prominently in the range of 0.5 km from the center (B). In other words, 250 m upheaval was achieved roughly in a range 1 km in diameter. Profiles Nos. 2–6 are concave upward, but profile No. 7 changes to roughly straight. The survey interval is roughly 60 days in average, until No. 6 and the last interval was 98 days. As shown in Fig. 2, the dome had increased its height roughly uniformly until No. 6.; This means that the magma smoothly ascended through a rather narrow conduit until No. 6, and thereafter the lateral expansion of the upper part took place. At the last stage, No. 7 in Fig. 3, the dome increased its volume by lateral expansion or by actual accumulation of lava.
In a summary, the apparent structure of the 1944 dome is composed of the mound measuring approx. 200-m-relative height and 1-km-basal diameter, and the lava dome approx. 100-m-high above the mound and 300-m-basal diameter on the mound. By the discussion of pseudo growth curves of the lava dome, we reached a model that the lava dome may be bulbous and connected to the conduit, of which diameter is smaller than 100 m. This model remains hypothetical and some independent support has been desired. For this purpose, muon radiography was applied.
Principle of muon surveys
Apart from particles associated with solar flares, the most primary cosmic rays come from outside the solar system but most primary cosmic rays originate within our own galaxy such as rotating neutron stars and supernova remnants. Observations have shown that primary cosmic rays with energy above 10 GeV approach the Earth’s surface isotropically because of galactic magnetic fields causing cosmic rays to travel in spiral paths. These primary cosmic rays can interact with the Earth’s atmosphere to create cascades of secondary cosmic rays, typically consisting of charged mesons. When cosmic ray particles enter the Earth’s atmosphere, they collide with molecules, mainly oxygen and nitrogen, to produce a cascade of lighter particles, a so-called air shower. Typical particles produced in such collisions are charged mesons (e.g. positive and negative particles of pions and kaons). High energy muons are produced through charged meson decays. Muons are the most numerous particles at sea level. Most muons are produced high in the atmosphere and lose about 2 GeV by ionization before reaching the ground. The mean energy of muons at the ground is ~4 GeV. The integral intensity of vertical muons above 1 GeV at sea level is ~70 m−2s−1 sr−1 (sr: steradian). The energy spectrum of cosmic-ray muons depends on the zenith angle θ*. Their energy and angular distribution reflects a convolution of production spectrum, energy loss in the atmosphere and decay. At large zenith angles, low energy muons decay before reaching the surface and high energy pions decay before further interaction with atmospheric nuclei.; Thus the average muon energy increases with zenith angle. For the purpose of surveying the internal structure of a volcano, these nearly horizontal muons can be used, provided that the muon flux is reasonably high and that the size of the detection system is realistic.
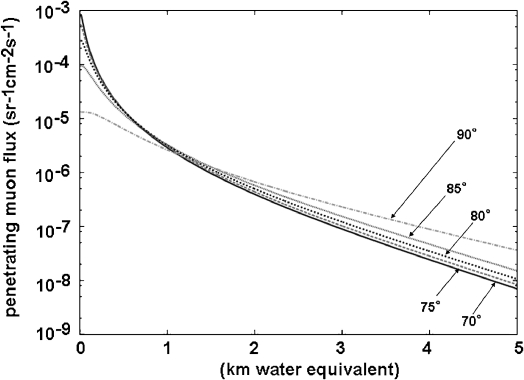
Because the muons interact with electrons and nucleons, the attenuation is directly determined by the density length X (density × path length). Once the density length (X) along the path line is given, the minimum energy (Ec) of the cosmic-ray muons which can penetrate through is determined. By integrating from Ec to infinity we obtain the integrated muon events Nµ(Ec, θ*). Inversely, for a substance with unknown X, a measurement of the muon flux Nµ(Ec, θ*) uniquely determines its density length. Fig. 4 shows the relation between the integrated flux of cosmic-ray muons, Nµ(Ec, θ*) at various zenith angles and thickness of rocks concerned, (density length) X, in units of km of water equivalent.
Fig. 4.
Integrated flux of cosmic-ray muons at various zenith angles penetrating through rocks expressed in km of water equivalent.
Muon detector.
We now consider how to determine the path of muons passing through the lava dome. There are two types of the particle detectors: (a) a segmented scintillation detector and (b) an emulsion chamber (EC) detector. In the former case, a straight line connecting the intersecting points of cosmic-ray muons at two separate position sensitive detectors determines the path of muons. In the latter case, micro-crystals of AgBr are incorporated in the emulsion layers of the detector. When a fast charged particle passes through this layer, a part of the micro-crystals on the particle trajectory records the paths. After the emulsion is later developed, these paths can be analyzed. The processing methods for the EC data are reported by Nakamura et al. 11) and only briefly described here. Tracks from the emulsion films are digitized and read into a computer. Sixteen tomographic charge coupled device (CCD) images are read through a microscope in the emulsion layers of 45 micron thickness, and the tracks in these images are recorded in three dimensions by an image processor. Although the EC detector does not have a real time reading function, it is a particle tracking device completely free from power and is light enough to be carried up on a mountain.
Coordinate system.
Because the size of the detector is negligibly small relative to the dimension of a volcano, in the present measurement, we use a coordinate system in which each point on a plane is determined by angles. The transmission image is therefore mapped in the angular coordinates by the zenith angle and the azimuth angle (θ or ϕ). The minimum resolvable distance (spatial resolution: ΔX, ΔY) at an object is expressed as (ΔX,ΔY) = R × (Δθ,Δϕ), where R is the distance between the detector and the object.
The muon survey of the 1944 lava dome of Usu
Measurement at the lava dome.
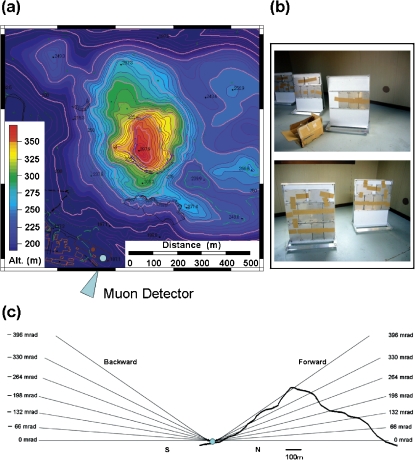
The cosmic-ray observation has been performed from November 2006 to May 2007 (6 months). The long runs were made to clearly image the structure of the object. A muon detector with an area of 6000 cm2 (Fig. 5-b) was placed at a point about 500 m south of the top of the lava dome as shown in Figs. 1 and 5-a. The detector was fixed to an aluminum support frame with θ=100 mrad, which facilitates the effective solid angle that covers the whole target. The effective solid angle in [θ, ϕ] (θ = 90°–θ*) is [from –300 mrad (–17.2°) to +500 mrad (+28.7°), ±400 mrad (±23.0°)]. The detector consists of a set of position sensitive emulsion chambers (EC). Muon tracks within emulsion layers were analyzed by three dimensional image processing to determine the level of energy absorption along different ray paths through the lava dome and the mound. The distance between the detector and the surface of the lava dome is 100–500 m and is short enough in comparison with the decay length of the out-going muon from the lava dome (which is longer than a few tens of km). We can therefore practically neglect the contribution from electromagnetic cascades initiated by decay of muons.
Fig. 5.
(a) Topography of the 1944 Usu lava dome and the location of the cosmic-ray muon detector (arrow). (b) The photographs of the nuclear emulsion photographic films protected by steel plates. (c) The cross-section of the lava dome showing geometrical configurations used in the present measurements. The data of muons arriving from the backward direction are also used to confirm the detection efficiency.
The background tracks were being recorded during the transportation because the emulsion films are constantly irradiated by cosmic rays. In order to identify the true radiographs from the pre-observation background, we set two separately transported emulsion films with a separation distance 0.3 mm at the observation point. Since we can recognize a true event by choosing the track which penetrates through these two film, the background noise level was significantly reduced.
The muon flux arriving from the backward direction, mainly transmitted through air can be used to confirm whether the muon flux recorded in the EC detector is azimuthally isotropic at the observation point. Since cosmic-ray muons do not arrive from the downward direction, we can distinguish “forward-directed” from “backward-directed” muon trails by choosing either positive (+θ) or negative incidence angles (–θ), as shown in Fig. 5-c.
Analysis.
The development and readout of the emulsion chambers was carried out at the scanning laboratory of Nagoya University, Japan. Emulsion films from a chamber were separated and developed immediately to avoid a further radiation background. Tracks from the films were digitized by a film reader, “Super-UTS (SUTS)”, developed by Nakano 12) and read into a computer. The SUTS reads out 16 tomographic CCD images from a microscope in 45 micron thick emulsion layers, and tracks in these images were recognized in three dimensions by an image processor. The angles and positions of recognized tracks were recorded and treated as the pulse height for each track segment was recorded. Pulse height was defined as the number of tomographic CCD images having pixels associated with each recognized track.
By employing the events with a pulse height of higher than 8 for each track segment, raw tracks with a track density of 2×106 cm−2 sr−1 were selected after the ghosts were erased. Track segments in both sides of emulsion layers were connected across the base, and were defined as base tracks. For each base track, a pulse height was calculated. The maximum angle difference in making the base track was set to 0.07 rad. After making the base track, the track density was reduced to about 2×10⁵ tracks·cm−2 sr−1. Finally we connected the particle trajectories that penetrated through two plates to remove fake tracks. The fake parts of the tracks have been recorded before the measurement at the 1944 lava dome. In the present analysis the angular and spatial deviation allowed for the doublet track making were less than 0.01 rad and 3 microns, respectively. Thus the angular resolution of the muons was improved to 10 mrad.
In the reconstructing procedure, various muon paths are created. Because the size of the emulsion chamber is much smaller than the spatial resolution of the vertex point at the target, the path of the muon can be represented by the azimuth and zenith angles with reference to the line perpendicular to the detector plane (θ,ϕ; θ=90°–θ*). The histogram of the Nµ events obtained as a function of (θ,ϕ) can be normalized by the cosmic-ray muons not passing through any substance.
A cosmic-ray muon measurement gives us the knowledge about X (θ,ϕ) which is an ensemble of density length X along the lines through the substance towards the observer. A small change in X due to the existence of either less-dense or more-dense parts inside the uniform substance will cause a difference in Nµ (θ,ϕ); the change in Nµ (θ,ϕ) would inform us of any changes in X. Here, we adopt the ratio n (θ,ϕ)=Nµ (θ,ϕ)/Nµ (θsky,ϕ), which represents the relative cosmic-ray muon intensity, where Nµ (θsky,ϕ) is the azimuthal distribution of cosmic-ray muons above the edge of the mountain Nµ (θ,ϕ) (θ>400 mrad), namely, the intensity of muons that transmitted through the air. In order to examine the small change in n (θ,ϕ) for any change in ρ gcm−3, the experimental data was compared with the result of a simulation that generates cosmic-ray muons that propagated through the lava dome. In this procedure we assumed azimuthally isotropic cosmic-ray muon flux. This is a reasonable assumption for the present measurement, since (a) the cosmic-ray muons penetrating through the lava dome have very high initial energy and therefore the east-west effect was not relevant, and (b) the measured muons through the dome mostly arrived from the north and therefore the east-west effect is not relevant.
The procedure of the Monte-Carlo simulation has been previously discussed by Tanaka et al., 13), 14) and is only briefly introduced here. To perform a particle tracking simulation we defined the geometry of the target from the 1/5000 topographic map surveyed by Geographical Survey Institute in 2000. Throughout this work default physical processes were used in GEANT4: a toolkit for the simulation of the passage of particles through matter. A detail of GEANT4 is reported by Agostinelli et al. 15) In order to simulate the cosmic muon flux, each muon is treated as an individual beam that is generated in front of the emulsion chamber with randomized incident angle. The muon momentum spectrum is based on measurements of the muon flux with a cut off for energies below 1 GeV. Simulation of the incident angle distribution was generated with a minimum deviation from zenith set to 60°. After the interactions, particle tracks are computed. If the particle interacting with the detectors is a muon, the zenith and azimuth angles of the muon track is written to a data file.
Results and discussion.
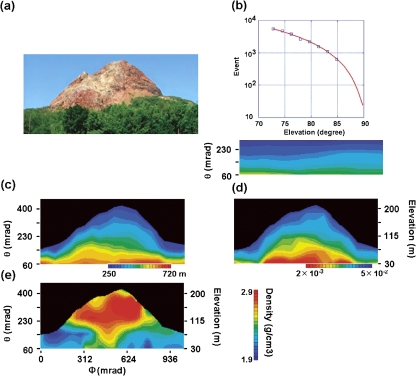
Fig. 6-d shows a transmission image of the cosmic-ray muons transmitted through the 1944 lava dome. For reference, the muons arriving from the backward directions mainly transmitted through the air are also plotted in the same angular region in Fig. 6-b. We can confirm almost azimuthally isotropic cosmic-ray flux. The top panel of Fig. 6-b shows the comparison of the zenith-angle dependence of the total muon count with the numerically estimated angular dependence. Fig. 6-d is related with subsurface structure of the 1944 lava dome, and contains three relatively weak transmission zones (the dark red zones beneath the dome). The transmission of muons depends on the local density structure of the volcanoes. A dense material such as magma interacts more with the muons by absorption. However, the intensity of the transmitted muon is also affected by the volume (geometry) of the material along its passage. The weaker (or stronger) muon transmissions come from a longer (or shorter) path length and/or a higher (or lower) average density along the path. In order to remove this effect, we reconstructed the subsurface crustal density structure (Fig. 6-e) by comparing the transmission image (Fig. 6-d) with the local topographic structure (Fig. 6-c) by referring to the integrated flux of muons at various zenith angles penetrating through a given thickness (Fig. 4). 1) Fig. 6-e is essentially a cross section through the dome parallel to the plane of the detector, on which the average density along all the muon paths is projected. Fig. 6-e is drawn with a vertical spatial resolution of ±15 m and a horizontal resolution of ±15 m. High density region can be seen beneath the dome.
Fig. 6.
Result of cosmic-ray muon imaging of the 1944 Usu lava dome. (a) exterior shape of the lava dome and the mound (now converted with trees) viewed from the detector site Mu, (b) the top panel shows the comparison of the zenith-angle dependence of the total; muon count with the numerically estimated angular dependence. The data for muons arriving from the backward direction are also used to confirm the detector efficiency. The vertical viewing angle for “backward-directed” muons is smaller than that for “forward directed” muons due to a tilted emulsion plane; (c) the volume (path length distribution) of the lava dome estimated by means of the topographies; (d) the cosmic-ray muon transmission image; (e) the average density distribution is projected on the cross sectional plane that is parallel to the detector plane and includes the dome peak. The coordinate at the right side indicates elevation in m.
In our measurements, we have confirmed the following important properties of this technique, which will be useful for future imaging:
During three months of the observations, an average density was determined for a thickness of a few hundred meters with an accuracy of a few %. The vertical and horizontal resolutions were both ± 15 m at 500 m distance. The spatial resolution and density contrast of the internal structure depend on the number of detected muons that pass through the target of interest, and thus they can be improved simply by using a larger detector.
We found that the bulk density of the lava dome was 2.71–2.91 g/cm3 (the error at each data point is 0.17 g/cm3) and the density of the surrounding area was 1.90–2.35 g/cm3 (the error is 0.13 g/cm3). These values are consistent with the density of rock samples of the Usu lava (2.51–2.92 g/cm3) and the gravimetric density of the surrounding area (2.30–2.37 g/cm3). 9)
As shown in Fig. 6(e), it was indicated that high density region beneath the dome is thinner at depths. This region maybe explained by a conduit diameter of 100 ± 15 m at an elevation of 145 mrad and of 50 ± 15 m at an elevation of 60 mrad.
Cosmic-ray muon radiography only resolves the average density distribution along individual muon paths. Therefore, the user should not assume more localized structure along the muon paths can be found. The user should use more than one detector to resolve the three-dimensional density structure. The EC detector is a particle tracking device completely free from power and is light enough to be carried up on a mountain. We can therefore place them relatively easily around the object so that three-dimensional tomographic measurements become realistic. On the other hand, this method is limited to near-surface depths and strongly depends on the local topography. Hence, the detector must be placed on the foot of a topographically prominent feature of interest, because the measurement shall be successful only for the volume located higher than the detector. Emplacement of emulsion chambers deep in a borehole would provide information of deeper parts. We are now developing waterproof emulsion chambers for boreholes.
Concluding remarks
The muon radiography was applied to image the subsurface structure of the 1944 Usu lava dome and confirmed a bulbous shape measuring approx. 300 m in diameter and narrowing downwards. The diameter of the uppermost part of the conduit is estimated at 100±15 m at an elevation of 260 m a.s.l. and 50±15 m at an elevation of 217 m a.s.l. We may say that the two results obtained by the deformation analysis and by the radiographic measurement are consistent despite different cross sections of the dome were targeted in the two studies. The present studies confirmed the shallow internal shape of the lava dome but the deeper parts of the conduit still remain unclear. When we know the dimension of conduits beneath lava domes, we may proceed to quantitative discussion of temperature and viscosity of magmas, which ascend the conduits to form lava domes. It is strongly desirable to apply the radiographic method to the deeper parts by placing the detector deeper.
Acknowledgments
One of the authors (H.K.M. Tanaka) expresses his deep thanks to the staff members of Nagoya University and the Usu Volcano Observatory of Hokkaido University for their help in the muon radiographic observation. This paper greatly benefited from valuable comments by Prof. S. Uyeda and an anonymous referee.
References
- 1).Tanaka, H.K.M., Nakano, T., Takahashi, S., Yoshida, J. and Niwa, K. (2007) Nucl. Instr. and Meth. A 575, 489–497 [Google Scholar]
- 2).Tanaka, H.K.M., Nakano, T., Takahashi, S., Yoshida, J., Takeo, M., Oikawa, J., Ohminato, T., Aoki, Y., Koyama, E., Tsuji, H. and Niwa, K. (2007) Earth Planet. Sci. Lett. 263, 104–113 [Google Scholar]
- 3).Yokoyama, I. (2002) Proc. Jpn. Acad., Ser. B 78, 6–11 [Google Scholar]
- 4).Yokoyama, I. (2004) Ann. Geophys. 47, 1811–1825 [Google Scholar]
- 5).Minakami, T. (1947) Bull. Earthq. Res. Inst. 25, 65–69, 71–75. [Google Scholar]
- 6).Yokoyama, I. (2005) Ann. Geophys. 48, 957–971 [Google Scholar]
- 7).Minakami, T., Ishikawa, T. and Yagi, K. (1951) Bull. Volcanol. 11, 45–157 [Google Scholar]
- 8).Yokoyama, I. and Seino, M. (2000) Earth Planets Space 52, 73–89 [Google Scholar]
- 9).Hayakawa, M. and his co-operators (1957) Jpn. J. Geophys. 1, 13–20 [Google Scholar]
- 10).Fukutomi, T. (1946) Kagaku 16, 75–80 (in Japanese). [Google Scholar]
- 11).Nakamura, T., Ariga, A., Bana, T., Fukuda, T., Fukuda, T., Fujioka, T., Furukawa, T., Hamada, K., Hayashi, H., Hiramatsu, S.et al. (2006) Nucl. Instr. and Meth. A 556, 80–86 [Google Scholar]
- 12).Nakano, T. (1997) Ph.D. Thesis, Nagoya University, Japan [Google Scholar]
- 13).Tanaka, H.K.M., Nagamine, K., Kawamura, N., Nakamura, S.N., Ishida, K. and Shimomura, K. (2003) Nucl. Inst. and Meth. A 507, 657–669 [Google Scholar]
- 14).Tanaka, H.K.M., Nagamine, K., Nakamura, S.N. and Ishida, K. (2005) Nucl. Inst. and Meth. A 555, 164–172 [Google Scholar]
- 15).Agostinelli, S., Allison, J., Amako, K., Apostolakis, J., Araujo, H., Arce, P., Asai, M., Axen, D., Banerjee, S., Barrand, G.et al. (2003) Nucl. Inst. and Meth. A 506250–303 [Google Scholar]


