Abstract
Background
A variety of surrogate markers for genetic features and outcome have been described in chronic lymphocytic leukemia based on gene expression analyses. Previous studies mostly focused on individual markers and selected disease characteristics, which makes it difficult to estimate the relative value of the novel markers. Therefore, in the present study a comprehensive approach was chosen investigating 18 promising, partly novel expression markers in a well characterized cohort of patients with long clinical follow-up and full genetic information (IGHV status, genomic abnormalities).
Design and Methods
Expression markers were evaluated using real-time quantitative reverse transcriptase polymerase chain reaction in CD19+-purified samples from 151 patients. Multivariate analyses were performed to test the markers’ ability to identify patients at genetic risk and as prognostic markers in the context of established prognostic factors.
Results
For individual markers, ZAP70 expression provided the highest rate (81%) of correct assignment of patients at genetic risk (IGHV unmutated, V3-21 usage, 11q- or 17p-), followed by LPL and TCF7 (76% both). The assignment rate was improved to 88% by information from a four-gene combination (ZAP70, TCF7, DMD, ATM). In multivariate analysis of treatment-free survival, IGHV mutation status and expression of ADAM29 were of independent prognostic value besides disease stage. With regards to overall survival, expression of ATM, ADAM29, TCL1, and SEPT10 provided prognostic information in addition to that derived from clinical and genetic factors.
Conclusions
Gene expression markers are suitable for screening but not as surrogates for the information from genetic risk factors. While many individual markers may be associated with outcome, only a few are of independent prognostic significance. With regard to prognosis estimation, the genetic prognostic factors cannot be replaced by the expression markers.
Keywords: chronic lymphocytic leukemia, markers, quantitative RT-PCR
Introduction
The clinical course of chronic lymphocytic leukemia (CLL) is highly variable. Some patients require therapy immediately after diagnosis whereas others survive without treatment for several decades.1–3 In order to develop risk-adapted strategies, prognostic factors are needed which allow the prediction of the individual clinical course. IGHV mutation status and genomic deletions at 11q22-q23 (11q-) and 17p13 (17p-) have been identified as strong and independent prognostic factors.4–8 In addition, rearrangement of the IGHV-gene V3-21 has been associated with an unfavorable clinical outcome irrespective of the IGHV mutation status with survival times of the patients with this rearrangement being comparable to those of patients with unmutated IGHV.9
Based on these findings, gene expression parameters have been investigated for their association with genetic subgroups of CLL to reveal biological mechanisms and to identify potential surrogate markers for prognostic assessment. ZAP70, a ζ associated tyrosine kinase, has been broadly studied and was found to be a surrogate marker for unmutated IGHV status and for poor outcome.10–13 However, there is discordance between ZAP70 expression and IGHV status in about 10 to 25% of cases of CLL. Discordance rates appear to be higher in specific genetic subgroups such as those using V3-21, or with 11q- or 17p-.14,15 Additional potential surrogate markers for IGHV status have been suggested based on global gene expression studies.16–18 Among these, lipoprotein lipase (LPL) showed promising results with regard to estimation of the IGHV mutation status and survival in purified19 as well as in unpurified tumor samples.20,21 Furthermore, a number of other individual markers showed an association with genetic subgroups, clinical course, or the pathogenesis of the disease.22–29
However, systematic comparative analysis is lacking since most of the studies focused on single markers or were based on small and heterogeneous cohorts of patients with incomplete genetic profiles. The aim of the present study was, therefore, to investigate the value of a broad range of novel and established surrogate markers, namely ADAM29, ATM, CLLU1, DMD, GLO1, HCSL1, KIAA0977, LPL, MGC9913, PCDH9, PEG10, SEPT10, TCF7, TCL1, TP53, VIM, ZAP70, and ZNF2, for their ability to predict the genetic risk of patients (defined by IGHV status, V3-21 usage, 11q-, and 17p-) and survival in multivariate analyses including established prognostic factors.
Design and Methods
Patients
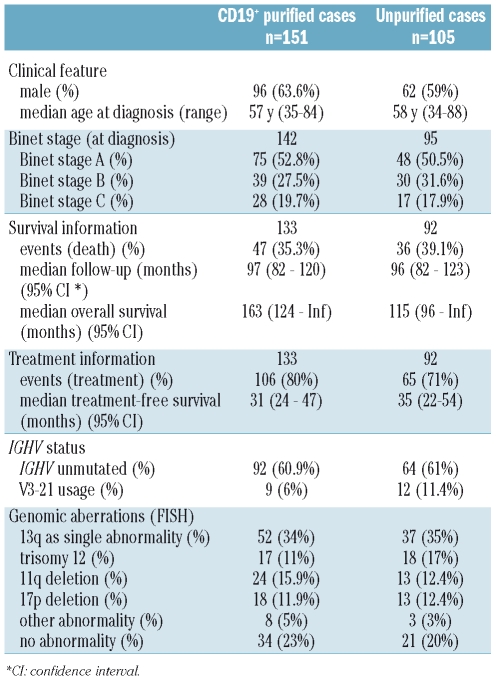
A total of 222 CLL patients were included in the study at our institution. Peripheral blood samples were collected after informed consent. All cases matched the standard diagnostic criteria for CLL, no cases with t(11;14) were included. Real-time quantitative reverse transcriptase polymerase chain reaction (RQ-PCR), IGHV mutation status analysis and fluorescence in situ hybridization (FISH) analysis were performed in all cases. In 151 cases, analyses were performed after CD19+-cell purification using magnetic cell separation (MACS, Miltenyi, Bergisch Gladbach, Germany). In 105 cases, analyses were performed on unpurified peripheral blood mononuclear cell samples after Ficoll density separation. Thirty-four patients overlapped between both cohorts. The clinical characteristics and follow-up were available for 133 CD19+ purified and 92 unpurified cases. Clinical and genetic characteristics are detailed in Table 1. All patients were untreated at the time of analysis and the median time from diagnosis to analysis was 1.2 months. Estimated median overall survival was 139 months after a median follow-up of 98 months in the overall cohort.
Table 1.
Patients’ clinical and genetic characteristics divided into CD19+ purified and unpurified cases. Absolute numbers and % values are shown.
Analysis of genomic aberrations and IGHV status
FISH and IGHV-gene sequencing were performed as previously described.4,7 A sequence homology cut-off of 98% was used to define the IGHV mutation status.
Real-time quantitative reverse transcriptase polymerase chain reaction
RNA was prepared and the RQ-PCR performed as reported elsewhere.15 DNAse I digestion of total RNA was included to avoid contamination with genomic DNA. The TaqMan method (primers and probe) was used for quantification of all genes except for ADAM29, MGC9913, and PCDH9, for which the SYBR Green method was used. The primers for, and characteristics of, the candidate genes are listed in Online Supplementary Table S1. GAPDH was used as an endogenous control. Three peripheral blood samples from healthy donors were used, after CD19+ purification, for standardization.
To test for gene expression levels in non-B cells of peripheral blood, the results for CD19-negative fractions from four CLL patients and three healthy donors were compared to those of the the respective positive fractions (Online Supplementary Table S1).
ZAP70 expression analysis by flow cytometry
For 72 cases included in the CD19+ cohort, ZAP70 expression was measured by four-color flow cytometry (CD5, CD19, CD3/56, ZAP70) according to Crespo et al.,11 as described previously.14 Positivity was defined as a level greater than 20%.11
Statistical analysis
For the attribution of genetic risk, a high risk group (including all patients with an unmutated IGHV status or V3-21 usage or 11q- or 17p-) and a low risk group (IGHV mutated without usage of V3-21 and no 11q- or 17p-) were defined. Prediction of IGHV mutation status and genetic risk group stratification were performed with binary and multinomial logistic regression analysis including the expression levels of all genes. To assess the prediction error of the resulting predictor, ten repetitions of 10-fold cross-validation were used. Multivariate Cox proportional hazards models were used including the expression levels of all genes, Binet stage, age, and the genetic risk groups (IGHV status, V3-21 usage, 11q-, 17p-) for the analysis of overall survival and treatment-free survival times. Backward selection using Akaka’s information criterion (AIC) was applied to exclude redundant or unnecessary variables. For purposes of comparison, a model based on the gene expression factors alone was calculated. To evaluate the prediction accuracy of the two models (the full model including all variables and the model including gene expression factors only), prediction errors over time were calculated using the loss function approach described elsewhere.33,34 A measure of explained variation is derived by comparing the integrated prediction errors with the benchmark prediction error of survival prediction derived from Kaplan-Meier estimates. Kaplan-Meier estimates were used to compute marginal survival curves. Error estimation was done using ten repetitions of 10-fold cross-validation. Survival curves for censored data were estimated according to Kaplan and Meier. An effect was considered statistically significant when (adjusted) P values were less than 5%. All statistical computations were performed with R, version 2.7.0, together with R packages multtest, version 1.20.0, pec, version 1.0.7, nnet, version 7.2-41, and Design, 2.1-1.35
Results
Fourteen out of 18 candidate genes were selected for investigation within a CD19+-purified cohort based on the results of a preliminary analysis of the 18 genes in an unpurified cohort (n=102) as well as on the expression pattern of the genes in CLL and non-CLL cells (Online Supplementary Tables S1 and S2). Four genes that were not overexpressed in non-CLL cells and did not have significant associations with survival or genetic subgroups were omitted. The CD19+ cohort comprised 151 cases and showed a representative distribution with respect to genetic prognostic factors (Online Supplementary Figure S1). In the following, only the results from the CD19+ cohort are reported.
Assignment of genetic risk
Assignment of IGHV mutation status was tested using logistic regression analysis. Best classifications among the candidate genes were obtained for LPL, ZAP70, and TCF7 (data not shown). Correct assignment of the IGHV status was achieved in 83% of all cases when using LPL or ZAP70 for classification, and in 75% when using TCF7 (83%, 82%, and 73%, respectively, when assessed by ten repetitions of 10-fold cross-validation).
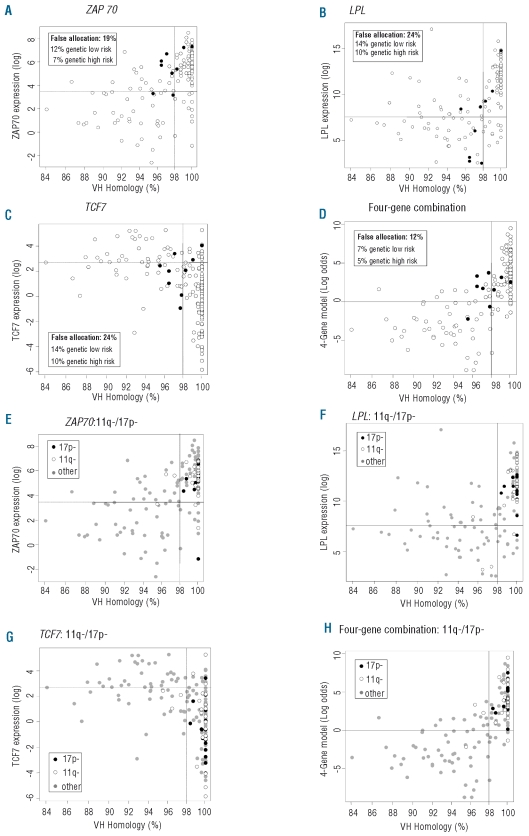
In addition to an unmutated IGHV status, V3-21 usage and deletions at 11q or 17p define poor risk subsets. Accordingly, genetic risk was defined by assigning all patients with an unmutated IGHV status, V3-21 usage, 11q- or 17p- to a high risk group, and patients with mutated IGHV without usage of V3-21, 11q- or 17p- to the low risk group (two-group risk model). According to this model, ZAP70 provided the highest rate of correct classifications (81% of all cases), followed by TCF7 and LPL (76% both) (Figure 1A–C) (81%, 76%, and 75%, respectively, after 10-fold cross-validation). Specifically, recognition of IGHV mutated V3-21-using cases as poor risk subset contributed to the superiority of ZAP70 compared to LPL (Figure 1A–B): the majority of cases with V3-21 gene usage showed high levels of ZAP70 expression, including four of six V3-21-using cases with mutated IGHV. These cases were classified false positive by ZAP70 with regard to the IGHV mutation status but were correctly classified as being at high clinical risk (due to V3-21 usage). In contrast, LPL expression levels correctly predicted IGHV mutation status in seven of the nine cases using V3-21, i.e. mutated cases had predominantly low and unmutated cases high LPL expression and accordingly did not identify V3-21 usage as a marker of high clinical risk.
Figure 1.
Patient distribution (n=151) according to marker expression and IGHV homology for ZAP70 (A, E), LPL (B, F), TCF7 (C, G), and the four-gene combination (D, H). Each circle represents one case. Y-axis: gene expression (logarithmic scale), X-axis: IGHV homology in %. Vertical line: 98% cut-off for the separation of the IGHV mutation subgroups. Horizontal line: gene expression cut-off for the separation of the high risk and low risk groups according to the logistic regression model prediction for the two-group risk model. A-D: all cases, V3-21 using cases indicated by filled circles. False allocations are given in % of the total cohort. E-H: all cases, 17p- and 11q- cases highlighted as shown.
Marker combinations were tested to improve the classification according to the two-group risk model. Based on logistic regression analysis including the expression levels of all genes, a four-gene combination, based on ZAP70, TCF7, DMD, and ATM expression, was identified which provided correct classification in 88% of cases (Figure 1D) (85% after ten repetitions of 10-fold cross-validation).
The rates of discordance between ZAP70 expression levels and IGHV mutation status have been reported to be higher for patients with 11q- and 17p-.14 The relation between IGHV homology and gene expression within the 11q- and 17p- subgroups is detailed in Figure 1E–H for ZAP70, LPL, TCF7, and the four-gene combination according to the two-group risk model. The frequency of IGHV discordances within the 11q- and 17p- subsets was very low for ZAP70, LPL, and TCF7 (3 of 24 patients with 11q-, 1 of 18 patients with 17p-), and even lower for the four-gene combination (2 of 24 patients with 11q-, 0 of 18 patients with 17p-).
Classification of the IGHV mutation status by ZAP70: polymerase chain reaction versus flow cytometry
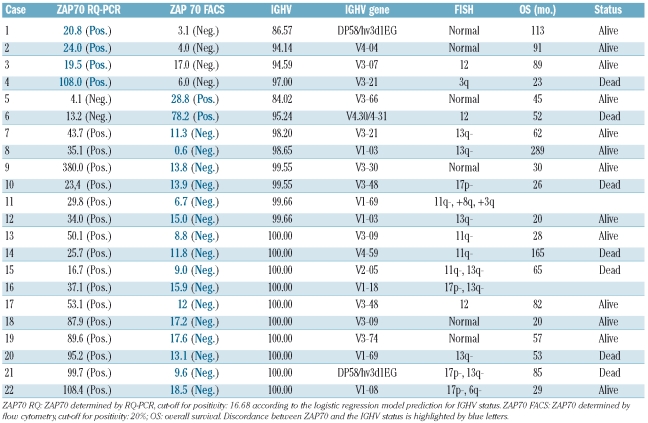
For 72 cases of the purified cohort, ZAP70 protein expression was determined by flow cytometry, as described previously.14 These results could be compared with transcript levels determined by RQ-PCR. Concordant results between flow cytometry and RQ-PCR were observed in 50 (69.4%) of the cases, while the results were discordant in 22 cases (30.6%). The discordant cases are listed in Table 2. Four of these cases showed high (i.e. false positive) mRNA levels by RQ-PCR in IGHV mutated cases including one case using the V3-21 gene. Another two were IGHV mutated cases with high (i.e. false positive) levels by flow cytometry. However, the majority of discordances (n=16) was related to IGHV unmutated cases with high ZAP70 levels by RQ-PCR but low levels (i.e. false negative) by flow cytometry.
Table 2.
Characteristics of cases with discordance of ZAP70 expression as assessed by RQ-PCR and flow cytometry. Sorted by IGHV homology.
Notably, half of these cases harbored one of the high risk aberrations 17p- or 11q- leading to a high proportion of IGHV misclassifications within these specific subsets (4 out of 12 cases for 11q-, 4 out of 9 for 17p-, compared to 10 out of 51 cases without 11q- or 17p-).
Prediction of treatment-free and overall survival
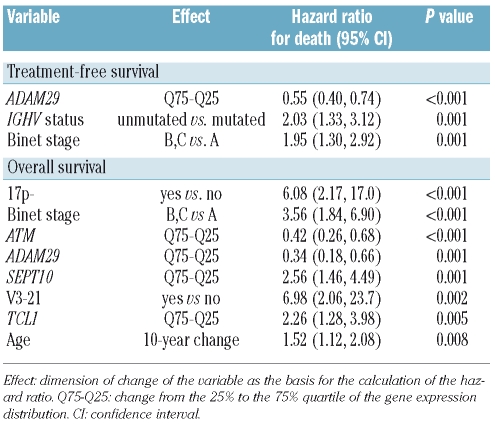
The prognostic value of the expression markers with regards to treatment-free survival and overall survival was studied using multivariate Cox regression analyses including the following variables: expression levels of all 14 candidate genes, clinical factors (age, stage), and the genetic factors (IGHV mutation status, V3-21 usage, 11q-, and 17p-) (full model; Table 3). The best estimation of treatment-free survival was achieved by a model including the variables ADAM29, IGHV mutation status, and Binet stage. Regarding the prediction of overall survival, a combined model consisting of clinical, genetic and gene expression markers was identified (Table 3). The most significant factors in this analysis were 17p-, Binet stage, and ATM expression. IGHV mutation status was not of significance in this model.
Table 3.
Multivariate Cox regression analysis for treatment-free survival and overall survival including gene expression markers, clinical and genetic parameters (full model).
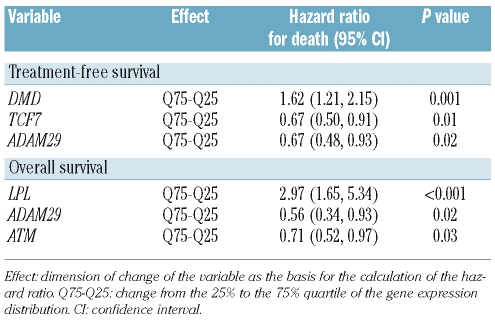
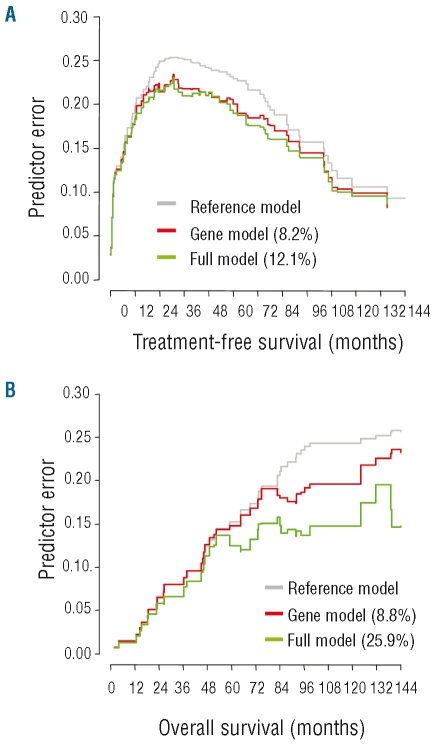
To explore the value of a prognostic model based only on gene expression factors, survival analyses were repeated excluding clinical and genetic factors (Table 4). According to this restricted model, treatment-free survival was best assessed by the expression levels of DMD, TCF7, and ADAM29 with DMD being the strongest factor (Online Supplementary Figure S2). With regards to overall survival, LPL was identified as the strongest prognostic factor (Online Supplementary Figure S3); ADAM29 and ATM were of additional prognostic impact. The prediction accuracy of the restricted model was compared to that of the full model (including genetic and clinical factors) based on their prediction errors in relation to a reference model without co-variables (i.e. Kaplan-Meier estimation) (Figure 2). With regards to treatment-free survival, the restricted and the full models showed similar prediction accuracy, indicating that the models were equivalent. With regards to overall survival, the gene expression model was inferior to the full model, with this latter showing a markedly lower rate of prediction errors.
Table 4.
Multivariate Cox regression analysis for treatment-free survival and overall survival with gene expression markers as the only included variables (restricted model, excluding clinical and genetic factors).
Figure 2.
Prediction error curves for treatment-free survival (A) and overall survival (B) according to the restricted and full prognostic models. Restricted model (red): based on gene expression variables only; full model (green): including clinical and genetic factors; reference curve (gray): Kaplan-Meier estimation without additional variables. Curves below the reference curve indicate models with reduced prediction errors corresponding to higher explained variation values (% given in brackets for both models) and, therefore, higher prediction accuracy.
Discussion
Numerous gene expression factors have been suggested as surrogate markers for genetic risk or prognosis in CLL patients.10–29 In contrast to this progress in the identification of novel prognostic factors, systematic comparative analyses of these markers is lacking, and their significance in the context of established parameters and survival is not well elucidated. A comprehensive approach was chosen by van’t Veer et al., 21 who identified LPL as the best surrogate marker for IGHV mutation status with a prognostic value comparable to that of IGHV mutation status. However, their analyses were performed on non-purified tumor samples, limiting the results of this study since some of the markers (such as ZAP70) are strongly overexpressed in non-CLL cells. In the present study, the value of gene expression markers for the prediction of genetic subgroups and survival was assessed within a series of CD19+-purified samples from patients using multivariate analyses in the context of established prognostic markers. The validity of the cohort for this type of analysis is suggested by the mature follow-up (median 97 months) and a representative prognostic impact of established prognostic factors (Online Supplementary Figure S1). The best prediction of IGHV mutation status was equally achieved by LPL and ZAP70. However, a substantial percentage of patients (17%) were incorrectly assigned, indicating an incomplete overlap. When taking into account V3-21 usage, 11q-, and 17p- as additional poor risk subsets, ZAP70 provided better classification rates compared to LPL, which was mostly due to the assignment of mutated V3-21 cases to poor clinical risk by ZAP70. This specific relation has been described earlier14,15 and contrasts with LPL as detailed in this study. With regards to the prediction of patients at genetic risk, the assignment rate based on TCF7 (also known as TCF-1) was similar to that achieved by LPL. In addition, TCF7 was the strongest marker to be overexpressed in IGHV-mutated CLL, which is a novel finding and was reproduced at the protein level (data not shown). The association of IGHV with TCF7 was superior to that with ADAM29, which is also overexpressed in IGHV-mutated CLL and has been described to improve the performance of LPL for IGHV-mutation status prediction.19 TCF7 is known to be as a T-cell specific transcription factor required for T-cell development, although its role in CLL is unknown. Animal models have suggested that it may have tumor suppressor-like function;36 further functional studies in CLL would, therefore, be useful.
Classification of the IGVH mutation status among patients with 11q- or 17p- is of special interest, since increased misclassification of IGHV status was described within these subsets when using ZAP-70 determined by flow cytometry for classification.14 However, in the present study, misclassification of IGHV status occurred infrequently within these subsets when using gene expression levels of ZAP70, as well as of LPL or TCF7, for classification (<10% of patients with 11q-or 17p-). Importantly, misclassification of patients with 11q-or 17p- occurred very rarely when using the four-marker combination (11q-: 2 of 24, 17p-: 0 out of 18) for IGHV assignment, underscoring the potential benefit of this classifier. However, although technically feasible, standardization of such a four-gene classifier would be challenging given the difficulties in standardization of the individual marker ZAP-70.37–39
Comparison of ZAP70 expression evaluated by FACS with gene expression levels revealed significant discordances between the results of the two methods (approximately 30%). The discordances were mainly IGHV unmutated cases being assigned false negative by FACS, pointing to a decreased sensitivity of the flow cytometric approach. This finding might reflect distinct biological properties of genetically high-risk CLL, such as post-translational down-regulation or enhanced protein degradation leading to reduced amounts of ZAP70 protein compared to mRNA. Alternatively, technical problems of flow cytometric detection might play a role such as usage of frozen samples or difficulties related to antibodies or procedures.14,37–39 The RQ-PCR-based approach might, therefore, offer a sensitive and reproducible alternative.40 However, the practicability of this approach is hampered by the need for cell purification prior to analysis.
Several of the investigated candidate genes have been proposed as novel prognostic factors in CLL.10–13,19–21,23,26,28 Since most of the markers were identified based on their association with IGHV status, correlation with survival in univariate analysis is not unexpected. In multivariate approaches, ZAP70 and LPL showed the potential to improve or substitute the information provided by IGHV status regarding treatment-free survival and overall survival.11,21,39,41 These studies were, however, restricted to a few selected markers and did not account for the prognostic impact of genomic abnormalities and V3-21 usage which were, in contrast, included in the present study. In this study, the information from the candidate genes was not able to replace that from IGHV status and disease stage with regards to predicting treatment-free survival, but expression of ADAM29 added independent prognostic information in the multivariate model. Therefore, ADAM29 expression may be used for refined prediction of disease progression. Interestingly, a model based on the expression of only three genes provided a similar prognostic accuracy as that of the full model, thus offering a simplified tool for estimation of treatment-free survival.
The most validated established factors for prediction of overall survival are disease stage, IGHV mutation status, and 17p-. Multivariate analysis of overall survival including clinical and genetic factors resulted in a combined model predictor consisting of gene expression, clinical variables and genetic variables. This combined model was clearly superior to models based on gene expression factors alone or genetic factors alone (data not shown). Gene expression factors are, therefore, able to improve the estimation of overall survival provided by already established factors. The gene expression factors of additional impact were ATM, ADAM29, TCL1, and SEPT10. The quantitative relation between reduced levels of ATM expression and inferior overall survival is a novel finding and strongly suggests that this gene has a pathogenic role in CLL.
A close association between genomic loss at 11q22-q23 and reduced ATM transcript levels has been described18,29 and can be interpreted as a gene dosage loss, supporting the postulated concept of ATM having a tumor suppressor function in CLL.42–44 Selection of ATM expression instead of genomic deletion at 11q22-q23 in multivariate analysis indicates that quantitative transcript levels might reflect ATM dysfunction more precisely. TCL1 over-expression in mice resulted in a disease resembling CLL, suggesting that TCL1 might be directly involved in CLL transformation.24 The prognostic impact of TCL1 expression points to an ongoing pathogenic influence of TCL1 deregulation during disease progression. SEPT10 was significantly over-expressed in IGHV-unmutated CLL, confirming the findings of Bilban et al.45 Extending those findings, Benedetti et al.46 reported low SEPT10 expression in V3-21 CLL, comparable to that in IGHV-mutated CLL patients. It, therefore, appears that SEPT10 expression might be able to substitute for the survival information derived from IGHV mutation status but not for the information derived from V3-21 usage, as indicated by the multivariate overall survival model. LPL and ZAP70 were not among the selected parameters for the overall survival model in line with previous findings that ZAP70 lost prognostic significance in multivariate analysis when genetic factors were included.14 Before the novel classifier can be recommended for further application, independent validation is required, which should best be performed within prospective clinical trials. The disadvantages of the classifier are its complexity, requiring analysis of a multitude of factors, and the need for cell purification prior to RQ-PCR analyses.
In conclusion, the novel gene expression markers are not a satisfactory surrogate for genetic risk factors but may be used for screening of genetic risk, which is best achieved by a marker combination. With regards to estimation of prognosis, the gene expression factors cannot replace established prognostic factors. However, a limited set of gene expression markers was of independent prognostic value and thus improved the prediction of treatment-free survival and overall survival. The potential value of the markers for future risk stratification strategies will depend on the clinical situation, as illustrated by the differential impact on treatment-free survival and overall survival and the influence of co-variates such as disease stage. The potential pathogenic implications of some genes such as TCL1, ATM, and TCF7 warrant further functional investigation.
Supplementary Material
Footnotes
Funding: DFG (Sti 296/1-1), DJCLS (R08/26f, R05/25), CLL Global Research Foundation.
The online version of this article has a supplementary appendix.
Authorship and Disclosures
DKi: designed and performed research, collected, analyzed and interpreted data, wrote the manuscript; AB: performed statistical analyses; CL, DW and CS: performed research; AB, TZ and AH: performed research, collected data; UJ, PL and RD-F: designed research; HD and SS: designed research, collected, analyzed and interpreted data, wrote the manuscript.
The authors reported no potential conflicts of interest
References
- 1.Rozman C, Montserrat E. Chronic lymphocytic leukemia. N Engl J Med. 1995;333(16):1052–7. doi: 10.1056/NEJM199510193331606. [DOI] [PubMed] [Google Scholar]
- 2.Zwiebel JA, Cheson BD. Chronic lymphocytic leukemia: staging and prognostic factors. Semin Oncol. 1998;25(1):42–59. [PubMed] [Google Scholar]
- 3.Chiorazzi N, Rai KR, Ferrarini M. Chronic lymphocytic leukemia. N Engl J Med. 2005;352(8):804–15. doi: 10.1056/NEJMra041720. [DOI] [PubMed] [Google Scholar]
- 4.Döhner H, Stilgenbauer S, Benner A, Leupolt E, Kröber A, Bullinger L, et al. Genomic aberrations and survival in chronic lymphocytic leukemia. N Engl J Med. 2000;343(26):1910–6. doi: 10.1056/NEJM200012283432602. [DOI] [PubMed] [Google Scholar]
- 5.Hamblin TJ, Davis Z, Gardiner A, Oscier DG, Stevenson FK. Unmutated Ig V(H) genes are associated with a more aggressive form of chronic lymphocytic leukemia. Blood. 1999;94(6):1848–54. [PubMed] [Google Scholar]
- 6.Damle RN, Wasil T, Fais F, Ghiotto F, Valetto A, Allen SL, et al. IgV gene mutation status and CD38 expression as novel prognostic indicators in chronic lymphocytic leukemia. Blood. 1999;94(6):1840–7. [PubMed] [Google Scholar]
- 7.Kröber A, Seiler T, Benner A, Bullinger L, Brückle E, Lichter P, et al. V(H) mutation status, CD38 expression level, genomic aberrations, and survival in chronic lymphocytic leukemia. Blood. 2002;100(4):1410–6. [PubMed] [Google Scholar]
- 8.Oscier DG, Gardiner AC, Mould SJ, Glide S, Davis ZA, Ibbotson RE, et al. Multivariate analysis of prognostic factors in CLL: clinical stage, IGHV gene mutational status, and loss or mutation of the p53 gene are independent prognostic factors. Blood. 2002;100(4):1177–84. [PubMed] [Google Scholar]
- 9.Thorsélius M, Kröber A, Murray F, Thunberg U, Tobin G, Bühler A, et al. Strikingly homologous immunoglobulin gene rearrangements and poor outcome in VH3-21-using chronic lymphocytic leukemia patients independent of geographic origin and mutational status. Blood. 2006;107(7):2889–94. doi: 10.1182/blood-2005-06-2227. [DOI] [PubMed] [Google Scholar]
- 10.Wiestner A, Rosenwald A, Barry TS, Wright G, Davis RE, Henrickson SE, et al. ZAP70 expression identifies a chronic lymphocytic leukemia subtype with unmutated immunoglobulin genes, inferior clinical outcome, and distinct gene expression profile. Blood. 2003;101(12):4944–51. doi: 10.1182/blood-2002-10-3306. [DOI] [PubMed] [Google Scholar]
- 11.Crespo M, Bosch F, Villamor N, Bellosillo B, Colomer D, Rozman M, et al. ZAP-70 expression as a surrogate for immunoglobulin-variable-region mutations in chronic lymphocytic leukemia. N Engl J Med. 2003;348(18):1764–75. doi: 10.1056/NEJMoa023143. [DOI] [PubMed] [Google Scholar]
- 12.Orchard JA, Ibbotson RE, Davis Z, Wiestner A, Rosenwald A, Thomas PW, et al. ZAP-70 expression and prognosis in chronic lymphocytic leukaemia. Lancet. 2004;363(9403):105–11. doi: 10.1016/S0140-6736(03)15260-9. [DOI] [PubMed] [Google Scholar]
- 13.Rassenti LZ, Huynh L, Toy TL, Chen L, Keating MJ, Gribben JG, et al. ZAP-70 compared with immunoglobulin heavy-chain gene mutation status as a predictor of disease progression in chronic lymphocytic leukemia. N Engl J Med. 2004;351(9):893–901. doi: 10.1056/NEJMoa040857. [DOI] [PubMed] [Google Scholar]
- 14.Kröber A, Bloehdorn J, Hafner S, Bühler A, Seiler T, Kienle D, et al. Additional genetic high-risk features such as 11q deletion, 17p deletion, and V3-21 usage characterize discordance of ZAP-70 and VH mutation status in chronic lymphocytic leukemia. J Clin Oncol. 2006;24(6):969–75. doi: 10.1200/JCO.2005.03.7184. [DOI] [PubMed] [Google Scholar]
- 15.Kienle D, Benner A, Kröber A, Winkler D, Mertens D, Bühler A, et al. Distinct gene expression patterns in chronic lymphocytic leukemia defined by usage of specific VH genes. Blood. 2006;107(5):2090–3. doi: 10.1182/blood-2005-04-1483. [DOI] [PubMed] [Google Scholar]
- 16.Rosenwald A, Alizadeh AA, Widhopf G, Simon R, Davis RE, Yu X, et al. Relation of gene expression phenotype to immunoglobulin mutation genotype in B cell chronic lymphocytic leukemia. J Exp Med. 2001;194(11):1639–47. doi: 10.1084/jem.194.11.1639. [DOI] [PMC free article] [PubMed] [Google Scholar]
- 17.Klein U, Tu Y, Stolovitzky GA, Mattioli M, Cattoretti G, Husson H, et al. Gene expression profiling of B cell chronic lymphocytic leukemia reveals a homogeneous phenotype related to memory B cells. J Exp Med. 2001;194(11):1625–38. doi: 10.1084/jem.194.11.1625. [DOI] [PMC free article] [PubMed] [Google Scholar]
- 18.Haslinger C, Schweifer N, Stilgenbauer S, Döhner H, Lichter P, Kraut N, et al. Microarray gene expression profiling of B-cell chronic lymphocytic leukemia subgroups defined by genomic aberrations and VH mutation status. J Clin Oncol. 2004;22(19):3937–49. doi: 10.1200/JCO.2004.12.133. [DOI] [PubMed] [Google Scholar]
- 19.Oppezzo P, Vasconcelos Y, Settegrana C, Jeannel D, Vuillier F, Legarff-Tavernier M, et al. The LPL/ADAM29 expression ratio is a novel prognosis indicator in chronic lymphocytic leukemia. Blood. 2005;106(2):650–7. doi: 10.1182/blood-2004-08-3344. [DOI] [PubMed] [Google Scholar]
- 20.Heintel D, Kienle D, Shehata M, Kröber A, Schwarzinger I, Mitteregger D, et al. High expression of lipoprotein lipase in poor risk B-cell chronic lymphocytic leukemia. Leukemia. 2005;19(7):1216–23. doi: 10.1038/sj.leu.2403748. [DOI] [PubMed] [Google Scholar]
- 21.Van’t Veer MB, Brooijmans AM, Langerak AW, Verhaaf B, Goudswaard CS, Graveland WJ, et al. The predictive value of lipoprotein lipase for survival in chronic lymphocytic leukemia. Haematologica. 2006;91(1):56–63. [PubMed] [Google Scholar]
- 22.Buhl AM, Jurlander J, Jørgensen FS, Ottesen AM, Cowland JB, Gjerdrum LM, et al. Identification of a gene on chromosome 12q22 uniquely overexpressed in chronic lymphocytic leukemia. Blood. 2006;107(7):2904–11. doi: 10.1182/blood-2005-07-2615. [DOI] [PubMed] [Google Scholar]
- 23.Buhl AM, Jurlander J, Geisler CH, Pedersen LB, Andersen MK, Josefsson P, et al. CLLU1 expression levels predict time to initiation of therapy and overall survival in chronic lymphocytic leukemia. Eur J Haematol. 2006;76(6):455–64. doi: 10.1111/j.0902-4441.2005.t01-1-EJH2530.x. [DOI] [PubMed] [Google Scholar]
- 24.Bichi R, Shinton SA, Martin ES, Koval A, Calin GA, Cesari R, et al. Human chronic lymphocytic leukemia modeled in mouse by targeted TCL1 expression. Proc Natl Acad Sci USA. 2002;99(10):6955–60. doi: 10.1073/pnas.102181599. [DOI] [PMC free article] [PubMed] [Google Scholar]
- 25.Herling M, Patel KA, Khalili J, Schlette E, Kobayashi R, Medeiros LJ, et al. TCL1 shows a regulated expression pattern in chronic lymphocytic leukemia that correlates with molecular subtypes and proliferative state. Leukemia. 2006;20(2):280–5. doi: 10.1038/sj.leu.2404017. [DOI] [PubMed] [Google Scholar]
- 26.Scielzo C, Ghia P, Conti A, Bachi A, Guida G, Geuna M, et al. HS1 protein is differentially expressed in chronic lymphocytic leukemia patient subsets with good or poor prognoses. J Clin Invest. 2005;115(6):1644–50. doi: 10.1172/JCI24276. [DOI] [PMC free article] [PubMed] [Google Scholar]
- 27.Kainz B, Shehata M, Bilban M, Kienle D, Heintel D, Krömer-Holzinger E, et al. Overexpression of the paternally expressed gene 10 (PEG10) from the imprinted locus on chromosome 7q21 in high-risk B-cell chronic lymphocytic leukemia. Int J Cancer. 2007;121(9):1984–93. doi: 10.1002/ijc.22929. [DOI] [PubMed] [Google Scholar]
- 28.Nowakowski GS, Lee YK, Bone ND, Morice WG, Barnidge DB, Jelinek DF. Analysis of chronic lymphocytic leukemia cells identifies vimentin as a novel prognostic factor for aggressive disease. Blood . 106(11):707. [Google Scholar]
- 29.Kienle D, Korz C, Hosch B, Benner A, Mertens D, Habermann A, et al. Evidence for distinct pathomechanisms in genetic subgroups of chronic lymphocytic leukemia revealed by quantitative expression analysis of cell cycle, activation, and apoptosis-associated genes. J Clin Oncol. 2005;23(16):3780–92. doi: 10.1200/JCO.2005.02.568. [DOI] [PubMed] [Google Scholar]
- 30.Winkler D, Schneider C, Kröber A, Pasqualucci L, Lichter P, Döhner H, et al. Protein expression analysis of chromosome 12 candidate genes in chronic lymphocytic leukemia (CLL) Leukemia. 2005;19(7):1211–5. doi: 10.1038/sj.leu.2403778. [DOI] [PubMed] [Google Scholar]
- 31.Westfall PH, Young SS. Resampling-Based Multiple Testing: Examples and Methods for P Value Adjustment. J. Wiley & Sons; 1993. p. 50.p. 114. [Google Scholar]
- 32.Pollard KS, van der Laan M. Choice of a null distribution in resampling-based multiple testing. J Stat Plan Inference. 2004;125(1–2):85–100. [Google Scholar]
- 33.Graf E, Schmoor C, Sauerbrei W, Schumacher M. Assessment and comparison of prognostic classification schemes for survival data. Stat Med. 1999;18(17–18):2529–45. doi: 10.1002/(sici)1097-0258(19990915/30)18:17/18<2529::aid-sim274>3.0.co;2-5. [DOI] [PubMed] [Google Scholar]
- 34.Gerds T, Schumacher M. Consistent estimation of the expected Brier score in general survival models with right-censored event times. Biom J. 2006;48(6):1029–40. doi: 10.1002/bimj.200610301. [DOI] [PubMed] [Google Scholar]
- 35.R Development Core Team. R. A language and environment for statistical computing. R Foundation for Statistical Computing; Vienna, Austria: 2007. [Google Scholar]
- 36.Roose J, Huls G, van Beest M, Moerer P, van der Horn K, Goldschmeding R, et al. Synergy between tumor suppressor APC and the β-catenin-Tcf4 target Tcf1. Science. 1999;285(5435):1923–6. doi: 10.1126/science.285.5435.1923. [DOI] [PubMed] [Google Scholar]
- 37.Gachard N, Salviat A, Boutet C, Arnoulet C, Durrieu F, Lenormand B, et al. Multicenter study of ZAP-70 expression in patients with B-cell chronic lymphocytic leukemia using an optimized flow cytometry method. Haematologica. 2008;93(2):215–23. doi: 10.3324/haematol.11622. [DOI] [PubMed] [Google Scholar]
- 38.Le Garff-Tavernier M, Ticchioni M, Brissard M, Salmon C, Raynaud S, Davi F, et al. National standardization of ZAP-70 determination by flow cytometry: the French experience. Cytometry B Clin Cytom. 2007;72(2):103–8. doi: 10.1002/cyto.b.20350. [DOI] [PubMed] [Google Scholar]
- 39.Letestu R, Rawstron A, Ghia P, Villamor N, Boeckx N, Boettcher S, et al. Evaluation of ZAP-70 expression by flow cytometry in chronic lymphocytic leukemia: a multicentric international harmonization process. Cytometry B Clin Cytom. 2006;70(4):309–14. doi: 10.1002/cyto.b.20132. [DOI] [PubMed] [Google Scholar]
- 40.Stamatopoulos B, Meuleman N, Haibe-Kains B, Duvillier H, Massy M, Martiat P, et al. Quantification of ZAP70 mRNA in B cells by real-time PCR is a powerful prognostic factor in chronic lymphocytic leukemia. Clin Chem. 2007;53(10):1757–66. doi: 10.1373/clinchem.2007.089326. [DOI] [PubMed] [Google Scholar]
- 41.Rassenti LZ, Jain S, Keating MJ, Wierda WG, Grever MR, Byrd JC, et al. Relative value of ZAP-70, CD38, and immunoglobulin mutation status in predicting aggressive disease in chronic lymphocytic leukemia. Blood. 2008;112(5):1923–30. doi: 10.1182/blood-2007-05-092882. [DOI] [PMC free article] [PubMed] [Google Scholar]
- 42.Stankovic T, Weber P, Stewart G, Bedenham T, Murray J, Byrd PJ, et al. Inactivation of ataxia telangiectasia mutated gene in B-cell chronic lymphocytic leukaemia. Lancet. 1999;353(9146):26–9. doi: 10.1016/S0140-6736(98)10117-4. [DOI] [PubMed] [Google Scholar]
- 43.Schaffner C, Stilgenbauer S, Rappold GA, Döhner H, Lichter P. Somatic ATM mutations indicate a pathogenic role of ATM in B-cell chronic lymphocytic leukemia. Blood. 1999;94(2):748–53. [PubMed] [Google Scholar]
- 44.Stankovic T, Stewart GS, Fegan C, Biggs P, Last J, Byrd PJ, et al. Ataxia telangiectasia mutated-deficient B-cell chronic lymphocytic leukemia occurs in pregerminal center cells and results in defective damage response and unrepaired chromosome damage. Blood. 2002;99(1):300–9. doi: 10.1182/blood.v99.1.300. [DOI] [PubMed] [Google Scholar]
- 45.Bilban M, Heintel D, Scharl T, Woelfel T, Auer MM, Porpaczy E, et al. Deregulated expression of fat and muscle genes in B-cell chronic lymphocytic leukemia with high lipoprotein lipase expression. Leukemia. 2006;20(6):1080–8. doi: 10.1038/sj.leu.2404220. [DOI] [PubMed] [Google Scholar]
- 46.Benedetti D, Bomben R, Dal-Bo M, Marconi D, Zucchetto A, Degan M, et al. Are surrogates of IGHV gene mutational status useful in B-cell chronic lymphocytic leukemia? The example of Septin-10. Leukemia. 2008;22(1):224–6. doi: 10.1038/sj.leu.2404867. [DOI] [PubMed] [Google Scholar]
Associated Data
This section collects any data citations, data availability statements, or supplementary materials included in this article.


