Abstract
At a time when the Health Effects Institute, Centers for Disease Control, and Environmental Protection Agency are creating an Environmental Public Health Tracking Program on Air Pollution Effects in the USA, it seemed useful to share the experience acquired since 1999 by the Apheis project (Air Pollution and Health—A European Information System), which has tracked the effects of air pollution on health in 26 European cities and continues to do so as the new Aphekom project. In particular, this paper first describes the continuing impact of air pollution on health in Europe, how the Apheis project came to be and evolved, what its main objectives and achievements have been, and how the project benefited its participants. The paper then summarizes the main learnings of the Apheis project.
Keywords: Apheis, Aphekom, Public health surveillance, Air pollution
Introduction
At a time when the Health Effects Institute, Centers for Disease Control, and Environmental Protection Agency are creating an Environmental Public Health Tracking (EPHT) Program on air pollution effects in the USA, it seemed useful to share the experience acquired since 1999 by the Apheis project (Air Pollution and Health—A European Information System)1, which has tracked the effects of air pollution on health in 26 European cities and continues to do so as the new Aphekom project.
This paper first describes the continuing impact of air pollution on health in Europe, how the Apheis project came to be and evolved, what its main objectives and achievements were, and how the project benefited its participants. The paper then summarizes the main learnings of the Apheis project that are relevant to the EPHT Program.
The need for tracking
Air pollution continues to threaten public health
Numerous studies and the lack of effective policies reveal that air pollution continues to threaten public health in Europe today. As but a few examples:
A study (Künzli et al. 2000) published in The Lancet revealed that roughly 40,000 people were dying every year from the effects of air pollution in three European countries alone, costing them some €50 billion annually (Sommer et al. 2000).
The cost–benefit analysis of Clean Air For Europe (CAFE; European Commission 2005) estimated 3.7 million years of life lost each year (based on the year 2000) associated with exposure to PM2.5 across the European Union’s 25 countries, or 348,000 estimated premature deaths in Europe every year; 100,000 cases of respiratory or cardiac hospital admissions; 30 million respiratory medication use days; and several hundred million restricted-activity days each year.
On December 12, 2007, according to its press release, “The European Parliament adopted a second-reading legislative report which provides the maximum concentration levels for PM2.5. The report is the basis of an agreement with the Council on a directive on air quality (CAFE Directive).”
Commenting on the proposed CAFE Directive, scientists had previously said, “As it stands, this new Directive would mark a serious reduction in public health protection from air pollution within the Member States, with health impacts amounting to thousands of premature deaths per year.” (Declaration on Need for Stricter European Regulation of Air Pollution, ISEE–ISEA and IRS Munich and Paris, September 4, 2006)
Key users lack vital information
Before the Aphea research project (Short-Term Effects of Air Pollution and Health: A European Approach) began in 1993, European policy makers who directly influenced the reduction of air pollution and its impact on health relied mainly on American research for their information because little European data was available. They also relied on individual studies that did not use common methodology. As a result, they could not compare research findings and draw synthetic conclusions.
The Aphea project addressed these problems by providing new, reliable European research data on the effects of air pollution on public health and by instituting a standardized, common methodology across different countries (Katsouyanni et al. 1996, 2001).
However, being limited in time, Aphea was not designed to provide information for environmental health professionals on an ongoing basis. In addition, policy makers, healthcare providers, patient organizations, and the general public lacked both information on the impact of air pollution on health and the communications tools that deliver that information to them—all tailored to their specific needs.
The Apheis approach
Given this situation, we designed the Apheis project to help all these audiences make better-informed decisions about the political, professional, and personal issues they face in this area. For this purpose, Apheis sought to expand knowledge and understanding among these audiences of the impact of urban air pollution on health by providing them with an up-to-date, easy-to-use information resource on the subject.
The plan: 26 centers across Europe gathered and analyzed information on an ongoing basis, and communicated it to key audiences
Apheis developed a public health surveillance system (Teutsch and Churchill 1994) to provide information at regular intervals on the effects of air pollution on health tailored to the needs of its audiences.
For this purpose, Apheis built on previous experience acquired in France, creating information systems on air pollution and public health through the ERPURS project (Medina et al. 1997), which has monitored the effects of air pollution on public health in the Paris metropolitan area since 1994, and through the subsequent PSAS program, which began in 1997 (Quénel et al. 1999; Host et al. 2007).
The Apheis public health surveillance system specifically: quantified the effects of air pollution on public health at the local and European levels; assessed the importance of factors that can influence concentration–response (C–R) functions; and delivered standardized, periodic reports on the impact of air pollution on public health.
Apheis 1
During its first phase starting in 1999, Apheis achieved two key objectives:
First, it defined the best indicators for health impact assessment (HIA) of the effects of air pollution in Europe. For this purpose, Apheis created five advisory groups in the fields of public health, health impact assessment, epidemiology, exposure assessment, and statistics. These groups drafted guidelines that defined the best indicators for public health surveillance and provided standardized protocols for data collection and analysis.
Second, it identified those entities best able to implement the surveillance system in the 26 cities in 12 European countries participating in the project (Fig. 1); understood how the different entities could work together on the local, national, and European levels; and assessed each entity’s ability to implement an HIA of particulate pollution using the guidelines drafted by the advisory groups (Medina et al. 2001).
Fig. 1.
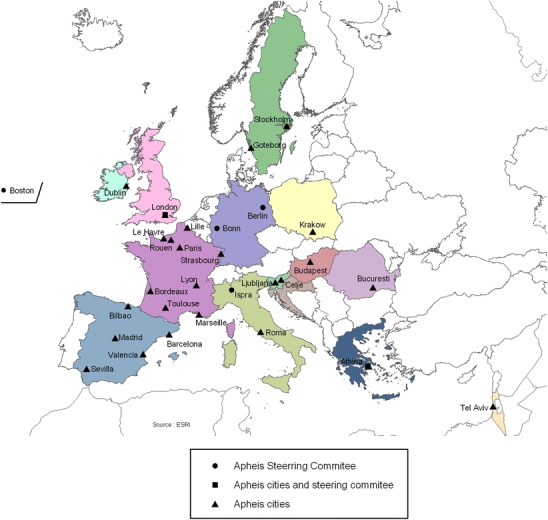
The Apheis network
Apheis 2
During its second phase, Apheis implemented its organizational model (Fig. 2). Among other tasks, Apheis also used its public health surveillance system to conduct an HIA of PM10 and black smoke (BS), applying the above guidelines to gathering and analyzing pertinent data. For the HIA, Apheis provided all the centers with HIA methods and tools, and a template for the city-by-city HIA reports.
Fig. 2.
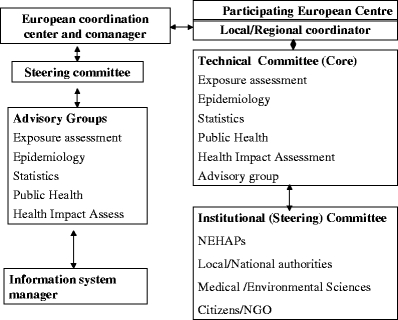
Apheis general organizational model and functions
This first HIA found that between 500 and 1,000 premature deaths could be postponed annually if, all other things being equal, short-term exposure to outdoor concentrations of PM10 were reduced by 5 μg/m3 in Apheis cities. The expected benefits of reduction in mortality in the long term were greater: the HIA estimated that, all other things being equal, between 3,400 and 7,700 premature deaths could be postponed annually if long-term exposure to outdoor concentrations of PM10 had been reduced by 5 μg/m3 in each city. Apheis published the findings of this work in its second-year report (Medina et al. 2002) and in a scientific paper (Medina et al. 2004).
Apheis 3
In its third phase, in 2003–2004, Apheis started developing a communications strategy and updated its HIAs through its public health surveillance system.
Developing an Apheis communications strategy
“The DETR (UK Department of the Environment, Transport and the Regions) has had little success ensuring that anyone takes notice of the information provided.” – Dr. Erik Millstone, Science and Technology Policy Unit, Sussex University
As already stated, the Apheis project sought to meet the information needs of a wide range of individuals and organizations concerned with the impact of air pollution on health in Europe and, as a first step, to meet the needs of those individuals who influence and set policy in this area on the European, national, regional, and local levels. Like other providers of scientific information, however, Apheis had reason to believe that its many audiences, policy advisors and makers in particular, were making little use of the scientific reports it produces.
To ensure it met the needs of policy advisors and makers, Apheis decided to develop a communications strategy based on learning directly from the members of this key audience their needs and the usefulness to them of the Apheis 2 report. For this purpose, Apheis interviewed 32 individuals who influence or set policy on air pollution and health in the UK and Spain and who are active in the fields of public health and the environment.
Through this research, Apheis sought to describe this audience’s information needs as accurately as possible, and then produce recommendations for developing communications tools that would help the audience’s members best understand, absorb, process, and act on the information Apheis provides.
Our research showed in particular that (Fig. 3) policy advisors and makers generally are unlikely to use the scientific reports we develop as is, different from scientists. It also showed that a long, complex chain comprising many players leads from the scientists to whom we distribute our reports directly, and who use them, to the policy makers who ultimately have the greatest effect on public health, but who only receive our reports indirectly and use them rarely, if at all. Lastly, we learned that each of our two audiences of scientific and policy users has different problems to solve, different levels of scientific knowledge and different cultures, and different ways of processing information for themselves and for pass-on users, meaning each audience has different information needs.
Fig. 3.
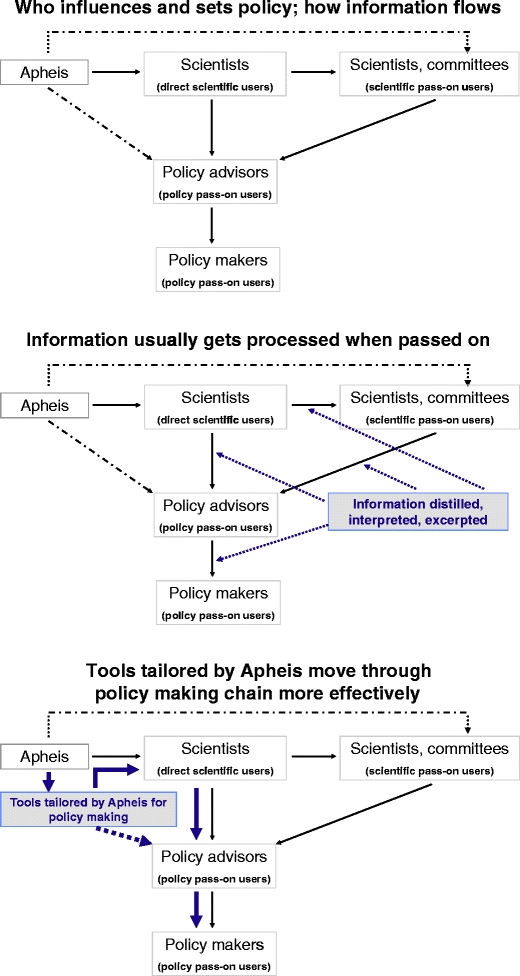
Apheis communication strategy
Based on this evidence, we concluded that Apheis needed to act proactively to apply this knowledge to the way it shapes and delivers its information and messages by developing a range of communications tools that goes beyond our comprehensive scientific reports to include summary reports, brochures, presentations, and Q&As whose focus, content, and form are tailored to the separate information needs of scientific and policy users. In addition, Apheis needed to ensure that the information required by policy advisors and makers actually reaches them.
Taking these steps greatly enhanced the way Apheis communicated with the key audiences that set policy on air pollution in Europe, and thus helped Apheis contribute better to improving public health.
Updating the Apheis health impact assessment
Tables 1 and 2 summarize the HIA scenarios developed in Apheis 3. Once again, Apheis provided all its centers with HIA methods and tools, and a template for the city-by-city HIA reports.
Table 1.
Summary of data components used for health impact assessment on short-term exposure in Apheis 3
| Summary SHORT-TERM HIA | |||||||
|---|---|---|---|---|---|---|---|
| Health indicator | ICD | Tool | RR (95% IC) for 10 μg/m3 increase | Scenarios | References | ||
| Attributable cases | ICD9 | ICD10 | Daily mean | ||||
| ST HIA for all Apheis cities | |||||||
| Black smoke | All-ages, all-cause mortality (excluding external causes) | <800 | A00–R99 | PSAS-9 Excel spreadsheet | 1.006 (1.004–1.009) | WHO 2004 | |
| All ages, cardiovascular mortality | 390–459 | I00–I99 | 1.004 (1.002–1.007) | WHO 2004 | |||
| All ages, respiratory mortality | 460–519 | J00–J99 | 1.006 (0.998–1.015) | Reduction to 50 μg/m3 | WHO 2004 | ||
| All ages, cardiac hospital admissions | 390–429 | I00–I52 | 1.011 (1.004–1.019) | Reduction to 20 μg/m3 | Apheis 3, 2004 | ||
| All ages, respiratory hospital admissions | 460–519 | J00–J99 | 1.0030 (0.9985–1.0075) | Reduction by 5 μg/m3 | Apheis 3, 2004 | ||
| PM10 very short-term | All ages, all-cause mortality (excluding external causes) | <800 | A00–R99 | PSAS-9 Excel spreadsheet | 1.006 (1.004–1.008) | WHO 2004 | |
| All ages, cardiovascular mortality | 390–459 | I00–I99 | 1.009 (1.005–1.013) | WHO 2004 | |||
| All ages, respiratory mortality | 460–519 | J00–J99 | 1.013 (1.005–1.021) | Reduction to 50 μg/m3 | WHO 2004 | ||
| All ages, cardiac hospital admissions | 390–429 | I00–I52 | 1.006 (1.003–1.009) | Reduction to 20 μg/m3 | Apheis 3, 2004 | ||
| All ages, respiratory hospital admissions | 460–519 | J00–J99 | 1.0114 (1.0062–1.0167) | Reduction by 5 μg/m3 | Apheis 3, 2004 | ||
| PM10 cumulative short-term (40 days) | All-ages, all-cause mortality (excluding external causes) | <800 | A00–R99 | PSAS-9 Excel spreadsheet | 1.01227 (1.0081–1.0164) | Reduction to 50 μg/m3 | A. Zanobetti et al. 2002 |
| All ages, cardiovascular mortality | 390–459 | I00–I99 | 1.01969 (1.0139–1.0255) | Reduction to 20 μg/m3 | A. Zanobetti et al. 2003 | ||
| All ages, respiratory mortality | 460–519 | J00–J99 | 1.04206 (1.0109–1.0742) | Reduction by 5 μg/m3 | A. Zanobetti et al. 2003 | ||
| Complementary ST HIA for some Apheis cities | |||||||
| PM10 with shrunken estimates | All ages, all-cause mortality (excluding external causes) | <800 | A00–R99 | PSAS-9 Excel spreadsheet | RRs calculated from betas and SEM of Apheis shrunken estimates for each city | Reduction to 50 μg/m3 | Apheis 3, 2004 |
| Reduction to 20 μg/m3 | |||||||
| Reduction by 5 μg/m3 | |||||||
Table 2.
Summary of data components used for health impact assessment on long-term exposure in Apheis 3
| Summary LONG-TERM HIA | |||||||
|---|---|---|---|---|---|---|---|
| Health indicator | ICD 9 | ICD10 | Tool | RR (95% CI) for 10 μg/m3 increase | Scenarios | References | |
| LT HIA for all-cities report | |||||||
| Attributable cases | Annual mean | ||||||
| PM10 | All-cause mortality (excluding external causes) | <800 | A00–R99 | PSAS-9 Excel spreadsheet | Trilateral and Apheis 2 1.043 (1.026–1.061) | Reduction to 40 μg/m3 | Kunzli et al. 2000 |
| Reduction to 20 μg/m3 | |||||||
| Reduction by 5 μg/m3 | |||||||
| PM2.5 | All-cause mortality | 0–999 | A00–Y98 | PSAS-9 Excel spreadsheet | Average Pope, 2002 | ||
| 1.06 (1.02) | Reduction to 20 μg/m3 | C.A. III Pope | |||||
| Cardiopulmonary mortality | 401–440 and 460–519 | I10–I70 and J00–J99 | 1.09 (1.03) | Reduction to 15 μg/m3 | C.A. III Pope | ||
| Lung cancer | 162 | C33–C34 | 1.14 (1.04) | Reduction by 3.5 μg/m3 | C.A. III Pope | ||
| Gain in life expectancy | Annual mean | ||||||
| PM2.5 | Age >30 only | Average Pope, 2002 | |||||
| All-cause mortality | 0–999 | A00 | AirQ | 1.06 (1.02) | Reduction to 20 μg/m3 | C.A. III Pope | |
| Cardiopulmonary mortality | 401–440 and 460–519 | I10 | 1.09 (1.03) | Reduction to 15 μg/m3 | C.A. III Pope | ||
| Lung cancer | 162 | C33 | 1.14 (1.04) | Reduction by 3.5 μg/m3 | C.A. III Pope | ||
Key HIA findings
During Apheis 3, we updated the estimates of the effects of air pollution on health. We established new all-ages respiratory C–R functions suitable for HIA. We introduced methodological innovations to improve the estimated impacts of short-term changes in exposure to air pollution. And we calculated reduction of life expectancy, beside the absolute number of cases, to estimate the health impacts of long-term exposure to air pollution.
In the 23 cities measuring PM10, totaling almost 36 million European inhabitants, Apheis 3 revealed that, all other things being equal, if exposure to outdoor concentrations of raw PM10 2 was reduced to 20 µg/m3 in each city:
More than 2,500 premature deaths (including some 1,700 cardiovascular and 400 respiratory deaths) could potentially be postponed annually when the impact estimation was limited to 2 days of follow-up.
The short-term impact cumulated over 40 days was more than twice as large, amounting to over 5,200 total deaths (including some 3,400 cardiovascular and 1,300 respiratory deaths).
Long-term effects of pollution reduction were higher. Our HIA estimated that reduction of long-term exposure to corrected PM10 3 would result in postponing more than 21,300 premature deaths annually.
Stated otherwise, for both total and cause-specific mortality, the benefit of reducing converted PM2.5 4 levels to 15 µg/m3 was more than 30% greater than for a reduction to 20 µg/m3. However, even at 15 µg/m3, a significant health impact was expected.
In terms of life expectancy, all other things being equal, if the annual mean of PM2.5 converted from PM410 did not exceed 15 µg/m3 in the 23 cities measuring PM10, the expected gain in life expectancy of a 30-year-old person would range, on average, between 2 and 13 months due to reduced risk of death from all causes. An example of the impact in terms of life expectancy in Seville is shown in Fig. 4.
Fig. 4.
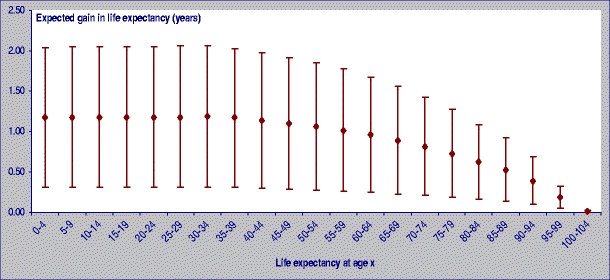
Expected gain in life expectancy if PM2.5 annual mean levels would not exceed 15 µg/m3 in Seville
For those wanting to know the contribution of air pollution to the total burden of mortality in the Apheis cities, particulate pollution contributed in a non-negligible manner to this burden. All other things being equal, when only considering very short-term exposure, the proportion of all-cause mortality attributable to a reduction to 20 μg/m3 in raw PM10 levels would be 0.9% of the total burden of mortality. This proportion would be greater (1.8%) for a cumulative short-term exposure up to 40 days. Effects of long-term reduction in corrected PM10 levels would account for 7.2% of the burden of mortality.
For long-term exposure to PM2.5 converted from corrected PM10, all other things being equal, the proportion of all-cause mortality attributable to a reduction to 20 μg/m3 in converted PM2.5 levels would be 4% of the total burden of mortality (Boldo et al. 2006).
Apheis also noted that, from a public health perspective, the health impact of daily exposure to air pollution in the long run is greater than the exposure to air pollution peaks (Fig. 5).
Fig. 5.
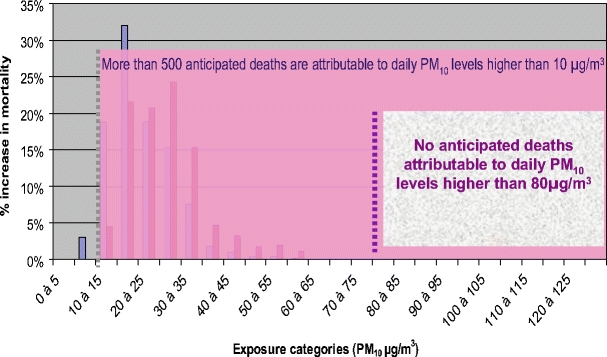
Distribution of PM10 daily mean levels and increase in daily mortality Paris, France 2004
Interpretation
In order to provide a conservative, overall picture of the impact of urban air pollution on public health in Europe, like its predecessor Apheis 2, the Apheis 3 project used a limited number of air pollutants and health outcomes for its HIAs.
Apheis 3 also established a basis for comparing methods and findings between cities, and explored important HIA methodological issues through sensitivity analyses to gain a better sense of the overall uncertainty of our estimates (WHO 2000, 2001; Le Tertre et al. 2005).
Below we discuss these methodological considerations as they apply to exposure assessment, health outcomes and baseline rates, and C–R functions.
Exposure assessment
Our HIA findings depended directly on the levels of particulate pollution measured. These levels vary widely as a function of the number and location of the monitoring sites, the analytical methods used, and the sites selected for our HIA.
In order to harmonize and compare the information relevant to exposure assessment by the 26 Apheis cities, the exposure measurements used in Apheis 3 were interpreted in accordance with the Apheis guidelines on exposure assessment. In particular, we verified the total number and type of monitoring stations and the number of stations used for HIA purposes, the measurement methods, the use of a correction and/or conversion factor, and data quality.
Measurement intervals for air quality indicators
Because the C–R functions selected for HIAs of short-term exposure use the 24-h average measurement interval, the Apheis guidelines recommended 24-h averages for PM10, PM2.5, and BS, and the Apheis cities complied with the given recommendations for all monitoring stations. For HIAs of long-term exposure, the C–R functions selected used annual levels, so the Apheis cities did likewise.
Number of stations and site selection
Altogether, 142 monitoring stations were selected for HIAs in accordance with the Apheis site-selection criteria. In a few cities, only one or two stations were used, but these were background stations and could only partially reflect the population exposure. In three cities, 28 stations were classified as directly traffic-related and should theoretically be excluded from HIA calculations. However, the data from these stations was used for HIA because: (1) local experts considered the data from the stations was the most representative of the population’s exposure in those cities; (2) C–R functions used for HIA of short-term exposure used these direct traffic-related stations, but studies selected for HIAs of long-term exposure did not use these stations.
Measurement methods
The Apheis centers reported the PM10/PM2.5/BS/total suspended particulate (TSP) measurement methods in full, and used automatic PM10 measurement methods (the β-ray absorption method and the tapered oscillating microbalance method, TEOM). PM2.5 measurements were done only by TEOM. Reflectometry is the commonly used measurement method for BS. TSP was measured by the β-ray absorption method in one city and by the gravimetric method in another city.
Local or, by default, European correction factors for PM10 were used for the purpose of long-term HIAs in order to compensate for losses of volatile particulate matter. In general, local conversion factors were slightly lower than the European factor of 1.3 recommended by the EC Working Group on Particulate Matter.
Besides this correction factor, conversion factors (local or European) were given for calculating PM10 from TSP measurements as well as for PM2.5 data calculated from PM10 measurements. The default factor of 0.7 for PM2.5 was recommended by the Apheis Exposure Assessment working group. In most of the Apheis cities that could compare both the annual mean levels of PM2.5 measured directly and PM2.5 converted from PM10 calculated using the European conversion factor (0.7), the annual mean level of PM2.5 measured directly was a little lower than the annual mean level of PM2.5 converted from PM10 calculated using the European conversion factor.
In conclusion, the assessment of exposure data in Apheis 3 was sufficiently reliable overall for our HIA purposes.
Health outcomes
The Apheis centers provided a full description of the health indicators used for Apheis 3, the type of sources, the coverage, the existence of a quality-control program, the type of coding used, and the completeness of the data.
Mortality data
For mortality data we used the national, regional, or local mortality registries for all the cities. In Apheis 3, cause-specific mortality was included beside all-cause mortality to enrich the mortality picture. But all-cause mortality remains our first choice because it is more robust, not subject to misclassification, and easier to obtain.
Because most of the cities applied a quality-control program and because there is a low percentage of missing data for all-cause mortality, we consider that erroneous entries in the selection of cause of death did not affect the comparability of the data between cities.
Hospital admissions data
To estimate the acute effects of short-term exposure to air pollution on hospital admissions, in each city we selected hospital admissions for residents with discharge diagnoses of respiratory diseases (ICD9 = 460–519; ICD10 = J00–J99) and cardiac diseases (ICD9 = 390–429; ICD10 = I00–I52). Whenever possible, only emergency admissions were selected as being more specifically related to air pollution, and discharge diagnoses were used in all cases because they are more reliable.
All the cities obtained hospital admissions data from registries. The completeness of the registries on hospital admissions was quite high; 95% or more in 18 of the 22 cities.
All the registries run a quality-control program, and completeness in the diagnosis for the cause of admission was high, with a percentage of missing data of 1% or lower for 19 of the 22 registries.
The main problem for comparability was the difference in availability of information in the registries, because some cities used emergency admissions while others that lacked this information used general admissions.
Methodologically speaking, statistical analyses of the Aphea 2 cities showed no significant heterogeneity in the estimated relative risk (RR) of hospital admissions between cities that reported general hospital admissions and cities that reported emergency hospital admissions only (Atkinson et al. 2001; Le Tertre et al. 2002).
Nevertheless, there is an issue for HIA if general admissions are used rather than emergency admissions and the same RR is applied. We should investigate the possibility of using a correction factor from emergency admissions and apply it to general admissions. There is also a need to examine this and other approaches on how to best handle the difficult situation of HIA when baseline data is unknown, missing, or collected in different ways.
The analysis of health-data quality and availability concluded that, for local use in each city, the selected data was reliable. When comparing findings between cities, the data was fully comparable for the selected categories of mortality. Nevertheless, even if most of the cities had hospital data from registries that use a quality-control program, such comparability was limited for the incidence of hospital admissions. The incidence rates for emergency and total admissions (Fig. 6) appeared not to be fully comparable. Consequently, we presented data for hospital admissions and the resulting HIAs in the city-by-city reports only. The follow-on Aphekom project is investigating the influence of healthcare and health-monitoring systems on morbidity data for HIAs.
Fig. 6.
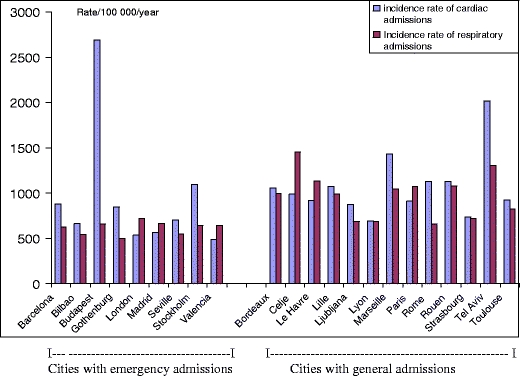
Incidence rates for hospital admissions in 22 cities (nine with emergency admissions, 13 with general admissions)
Concentration–response functions
Most HIAs, including ours, use overall estimates from multi-center studies. But in some cases, people prefer to use city-specific estimates when they conduct an HIA in a city where an epidemiological study has been done that provides local E–R functions. Apheis discussed the alternative use of city-specific estimates, and the statistical advisory group conducted a sensitivity analysis using different effect estimates (Le Tertre et al. 2005).
Sensitivity analysis using different types of estimates
The Apheis statistical advisory group conducted a sensitivity analysis in some cities using different effect estimates (observed city-specific, shrunken city-specific, pooled, mixture of shrunken city-specific and adjusted for effect modifiers) to calculate the number of premature deaths in each city. The study concluded that, although the sum for 21 European cities of the deaths attributable to PM10 is not strongly influenced by the method used to estimate RRs, this is not true at the city level.
Applied to a single city, the different estimates tested presented benefits and limits. Based on these limitations, the authors recommended the use of the shrunken estimate in cities for which this option was available. Use of this shrunken estimate enabled deriving the overall estimate at the local level by combining information from the city-specific estimate and the overall estimate, and can be considered as a weighted mean between these two estimates. Use of this shrunken estimate also reduced the variability of the local estimate by incorporating information from other cities. However, a key disadvantage of using such an estimate is that it can only be applied in cities that are part of the initial multi-center analysis.
Figure 7 shows the estimated density for each of the shrunken estimators (i.e., in each city). Superimposed is the estimated distribution of the pooled estimate (i.e., overall), based on the random effects model and the estimated mixture distribution of the Empirical Bayes estimates across all the cities.
Fig. 7.
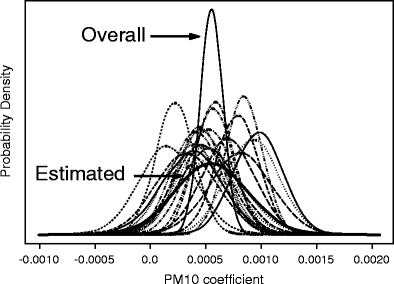
Probability densities of PM10 shrunken coefficients for mortality in each of the 21 cities and resulting estimated mixture distribution from all cities. Also shown is the probability density of the pooled over all cities (using random effects model) coefficient
Substantial departures from the population mean (overall) estimate can be seen in several cities. The underlying distribution of the Empirical Bayes estimates displays the same mean as the pooled estimate, but it is more flat, reflecting the heterogeneity between cities. Consequently, the corresponding 95% credible interval for the RR for total mortality associated with a 10 µg/m3 increase in PM10 (0.994, 1.014) is larger than the one derived from the pooled estimate (1.002–1.006).
The statistical advisory group recommended using an estimated mixture distribution of the shrunken estimates that will give the same central estimate as the overall pooled one but with a larger confidence interval, avoiding excessive certainty suggested by naïve approaches to risk assessment. Use of this type of estimate was proposed at the city level in future HIAs.
When building our own C–R functions on respiratory admissions of all ages, we used the Aphea 2 methodology (Katsouyanni et al 2001) based on time-series analysis, taking into account the problems with generalized additive models raised by the National Mortality and Morbidity Air Pollution Study (Dominici et al. 2002) and investigating the sensitivities of the estimated pollution effects by using alternative smoothing techniques, parametric and non-parametric, and by using a range of smoothing parameters. Since we used aggregated data in Apheis, we preferred using a time-series approach instead of case-crossover analysis. In addition, only a time-series approach can take overdispersion into account (Lu and Zeger 2007).
Starting in June 2008, Apheis continued investigating important methodological issues and uncertainties surrounding HIA findings in the new EC co-funded project called Aphekom.
Achievements of the Apheis project
The Apheis project has created an active public health and environmental network that facilitates the flow of information between environmental and health professionals. It has developed expertise across Europe. It has guided and optimized the measurement of air pollutants by local air-quality-monitoring networks so these networks meet the needs of public health monitoring.
Apheis has also contributed to training environmental health professionals. It has provided information to evaluate the effectiveness of different scenarios for reducing air pollution levels on local, national, and European levels.
Lastly, Apheis has gained recognition from local and national authorities as able to provide sound scientific advice on health risks related to air pollution. And Apheis has interested cities in joining the Apheis network who were not previously involved in the Apheis project.
Impact of the Apheis project
Implications for EU policy making
To contribute to the discussions between the European Council and the Parliament on new limit values for PM2.5, the Apheis project estimated the potential benefits in terms of deaths that could be postponed in 26 European cities by reducing PM2.5 annual levels to 25, 20, 15, and 10 μg/m3, respectively. In particular, reducing annual mean levels of PM2.5 to 15 μg/m3 could postpone three times more premature deaths in the Apheis cities than a reduction to 25 μg/m3 (13,200 vs. 4,400 deaths; Fig. 8). This factor could grow from three times to five times if PM2.5 levels were reduced to 10 μg/m3 (22,200 vs. 4,400 deaths). Apheis also made a sensitivity analysis to check the changes in HIA estimates using other C–R functions or other correction factors for the ratio of PM2.5/PM10. The main conclusions here remained the same (Ballester et al. 2008).
Fig. 8.
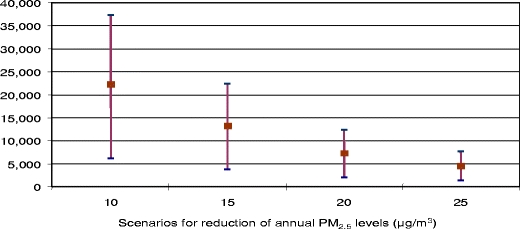
Potential postponements in total annual deaths (central estimate and 95% CI) among people age 30 years and over in the 26 Apheis cities for different decreases in annual PM2.5 levels
Impact of the project on the centers’ work and on local policy making
Impact on the centers’ work
The Apheis centers learned the philosophy, methods, and tools of the HIA approach.
The Apheis project improved the scoping, appraisal, and reporting of HIA stages.
The project provided an opportunity to harmonize existing local and national approaches to HIA. And Apheis enabled many cities to conduct enlarged local, regional, and national HIAs. Feedback we received told us that Apheis “stimulated us to go further with both national and local HIAs” and obtain funding for this purpose (according to the centers in Stockholm and Gothenburg, Sweden and in Andalusia, Spain).
Apheis locally fostered dialog between environment and health professionals. Apheis also led to the exchange of know-how in different fields at the EU level. And the Apheis project enabled centers to meet with international experts and create lasting relationships, contributing to “A significant impact due to the international dimensions of the project” (Bucharest, Romania).
Involvement in the Apheis project made local findings more credible. And Apheis provided the centers with “a stimulus from the outside” that facilitated local work on air pollution and health. As an example, “Involvement in the Apheis project increased the prestige of our team” (Madrid, Spain).
The Apheis centers valued being able to compare findings with those of other cities: “Use of international benchmarking was a good starting point for a science-based discussion of the overall and local results” (Hamburg, Germany).
Apheis provided an opportunity to apply HIA to other fields, e.g., domestic heating (Vienna, Austria), and opened doors for related HIA projects (Stockholm and Gothenburg, Sweden).
The Enhis and Enhis 2 projects applied Apheis methodology to develop an online tool for the HIA of urban air pollution using European databases and/or local data.
Impact on local policy making
Apheis findings contributed to local, regional, and national environmental health action plans. And local centers were asked to speak to local and national authorities. According to feedback, with Apheis “We can show people and policy makers a clear result about impact of air pollution on health.” “Apheis findings are very helpful in the current discussion on reducing air pollution in big cities” (Ljubljana, Slovenia). “Apheis findings, beside other results on the impact of air pollution on health, led the Spanish Government to approve the new Law on Air Quality” (Valencia, Spain).
Apheis raised awareness through the mass media and NGOs. In particular, HIA findings were easier to communicate than other findings (Stockholm and Gothenburg, Sweden). “The results of Apheis were always attractive for journalists, much more than telling them about RRs or ORs (odd ratios). So HIA provides a very useful tool for informing the public” (Athens, Greece). “The picture with air pollution influence on life expectancy had a huge impact in the Netherlands. It was very helpful to translate scientific information into pictures” (Rotterdam, Netherlands). “The assessment of long-term impact of air pollution, especially years of life lost, was extremely useful for us” in terms of communication (Budapest, Hungary).
“Apheis creates a good framework in which results can be properly assessed and compared with others from similar and different places” (Bilbao, Spain). “We used the Apheis information for benchmarking, which is very important for civil servants and politicians who want to know if they have unique problems or if problems are similar in other cities” (Rotterdam, Netherlands).
Problems remained
While Apheis sought to increase awareness of the impact of air pollution on health, there has generally been little change in behavior. In some countries, Apheis findings had little impact because of higher national priorities (Israel) and because other sources of information on the effects of air pollution on health were available (Rome, London).
In addition, centers were concerned by the EU’s lack of willingness to fund a European system for monitoring the effects of air pollution on health on a continuous basis.
Conclusions for the EPHT Program and other projects
Based on our experience with the Apheis project, we believe the following steps are key to the success of the EPHT Program on air pollution:
Build a collaborative network from the bottom up to stimulate cooperation and facilitate decision making on the local, national, and higher regional levels. In particular, we suggest that all network members contribute actively to the program’s work and be encouraged to take ownership by being consulted on all important decisions.
Use standardized protocols and tools for data collection (short and long term) and HIA analysis. It is essential that everyone use the same definitions for the geographical areas studied, the exposure measurements used, the health indicators selected, and the analytical methods used for HIAs to ensure comparability of methods and findings between cities.
Because this is a public health program and not a research project, it is important to keep things simple to ensure feasibility and compliance in the long term. But it is equally important to use rigorous methods and keep the quality of work high, while discussing sources of uncertainties with stakeholders.
Local committees should be involved from the outset. In particular, we feel it is important that all potential stakeholders be involved from the project’s inception by informing them of the program’s progress and getting their input on the project as it evolves.
Ongoing cross-fertilization should be fostered between multiple disciplines and regions to create skilled, local teams; enrich know-how and the quality of its findings; and explore HIA methodological issues. In particular, this means sharing experiences among the program’s participants by organizing meetings, thematic workshops, and forums for discussing specific issues in methodology.
Finally, however, remember that public health findings continue to have a limited impact on policy making, since decision makers are influenced by other factors they consider to be more important when setting policy. Hence, the EPHT Program might consider putting more emphasis on how to package public health findings convincingly for the needs of government policy makers and influencers. And for this purpose, use the knowledge and expertise of skilled communication-strategy professionals.
Acknowledgments
Open Access
This article is distributed under the terms of the Creative Commons Attribution Noncommercial License which permits any noncommercial use, distribution, and reproduction in any medium, provided the original author(s) and source are credited.
Footnotes
Apheis is co-funded by the Pollution-Related Diseases Program of the DG SANCO of the European Commission (contract nos. SI2.131174 [99CVF2-604], SI2.297300 [2000CVG2-607], and SI2.326507 [2001CVG2-602]) and participating institutes.
For HIAs of short-term exposure, we used raw PM10 and BS levels measured directly at monitoring stations.
For HIAs of long-term exposure, because the exposure-response functions used are taken from a publication that used gravimetric methods (Pope et al. 2002), for consistency we had to correct the automatic PM10 measurements used by most of the cities by a specific correction factor (local or, by default, the European factor of 1.3) in order to compensate for losses of volatile particulate matter.
For most of the cities, PM2.5 measurements were not available, and PM2.5 levels had to be calculated from PM10 measurements. For this purpose, a conversion factor (local or, by default, the European factor of 0.7) was used.
The Apheis Collaborative Network
Athens: Antonis Analitis, Giota Touloumi, and Klea Katsouyanni, Department of Hygiene and Epidemiology, University of Athens, Athens, Greece
Barcelona: Lucía Artazcoz, Antoni Plasència, Manuel Gonzalez-Cabré, and Natalia Valero, Municipal Institute of Public Health, Barcelona, Spain
Bilbao: Koldo Cambra, Eva Alonso, Francisco Cirarda, and Teresa Martínez, Health Department, Bask Government, Vitoria-Gasteiz, Spain
Brussels: Catherine Bouland, Institute for the Management of the Environment, Brussels, Belgium
Bucharest: Emilia Maria Niciu, Institute of Public Health, Bucharest, Romania
Budapest: Anna Paldy, Eszter Erdei, and Janos Bobvos, Jozsef Fodor National Center for Public Health, National Institute of Environmental Health, Budapest, Hungary
Cracow: Krystyna Szafraniec, Epidemiology and Preventive Medicine, Jagiellonian University, Cracow, Poland
Dublin: Pat Goodman and Luke Clancy, Saint James Hospital, Dublin, Ireland
Hamburg: Michael Schümann, Institute of Medicine, Biometry and Epidemiology, Herman Neus, Department of Science and Health, Hamburg, Germany
France, PSAS project: Agnès Lefranc, Sylvie Cassadou (coordinators, Institut de Veille Sanitaire), Pascal Fabre, Hélène Prouvost, Christophe Declerq (Lille), David Borrelli (Strasbourg), Sophie Larrieu (Bordeaux), Laurence Pascal (Marseille, Toulouse), Jean François Jusot (Lyon), Myriam d’Elf (Rouen, Le Havre), Sabine Host, Benoit Chardon (Paris), and Alain Le Tertre, Institut de Veille Sanitaire, Saint Maurice
Ljubljana/Celje: Tina Gale, Peter Otorepec, and Mateij Gregoric, Institute of Public Health, Ljubljana, Republic of Slovenia
London: Richard Atkinson and Ross Anderson, Saint George’s Hospital Medical School, London, UK
Madrid: Mercedes Martínez, Belén Zorrilla, Elena Boldo, Laura Lopez, and José Frutos, Madrid Regional Government, Madrid, Spain
Prague: Vladimira Puklova and Helena Kazmarova, National Institute of Public Health, Prague, Czech Republic
Rome: Ursula Kirchmayer and Paola Michelozzi (Local Health Authority Roma E), Rome, Italy
Seville: Inmaculada Aguilera, Silvia Toro, Antonio Daponte, and Piedad Martin-Olmedo, Andalusian School of Public Health, Granada, Spain
Rotterdam: Reind Van Doorn and Ingrid Walda, Municipal Health Service, Rotterdam, The Netherlands
Stockholm/Gothenburg: Bertil Forsberg, Bo Segerstedt, and Lars Modig, Department of Public Health and Clinical Medicine, Umeå University, Umeå, Sweden
Tel-Aviv: Sarah Hellmann, Ayana Goren, and Rony Braunstein, Department of Epidemiology and Preventive Medicine, Tel-Aviv University, Tel-Aviv, Israel
Valencia: Ferrán Ballester, Carmen Iñíguez (Valencian School of Studies for Health), and José Luis Bosch (City Council), Valencia, Spain.
Vienna: Hanns Moshammer and Manfred Neuberger, Institute for Environmental Health, University of Vienna, Austria.
Steering Committee
Ross Anderson, Saint George’s Hospital Medical School, London, UK
Emile De Saeger, Nikolaos Stilianakis, Joint Research Centre, Ispra, Italy
Klea Katsouyanni, Department of Hygiene and Epidemiology, University of Athens, Athens, Greece
Michal Krzyzanowski, WHO European Centre for Environment and Health, Bonn Office, Germany
Hans-Guido Mücke, Federal Environmental Agency, WHO Collaborating Centre, Berlin, Germany
Joel Schwartz, Harvard School of Public Health, Boston, USA
Coordinator
Sylvia Medina, Institut de Veille Sanitaire, Saint-Maurice, France
s.medina@invs.sante.fr
References
- Atkinson RW, Anderson HR, Sunyer J, Ayres J, Baccini M, Vonk JM, Boumghar A, Forastiere F, Forsberg B, Touloumi G, Schwartz J, Katsouyanni K. Acute effects of particulate air pollution on respiratory admissions: results from APHEA 2 project. Air Pollution and Health: a European Approach. Am J Respir Crit Care Med. 2001;164(10 Pt 1):1860–1866. doi: 10.1164/ajrccm.164.10.2010138. [DOI] [PubMed] [Google Scholar]
- Ballester F, Medina S, Boldo E, Goodman P, Neuberger M, Iñiguez C, Künzli N. Apheis network. Reducing ambient levels of fine particulates could substantially improve health: a mortality impact assessment for 26 European cities. J Epidemiol Community Health. 2008;62(2):98–105. doi: 10.1136/jech.2007.059857. [DOI] [PubMed] [Google Scholar]
- Boldo E, Medina S, LeTertre A, Hurley F, Mücke HG, Ballester F, Aguilera I, Eilstein D, on behalf of the Apheis group Apheis: health impact assessment of long-term exposure to PM2.5 in 23 European cities. Eur J Epidemiol. 2006;21(6):449–458. doi: 10.1007/s10654-006-9014-0. [DOI] [PubMed] [Google Scholar]
- Dominici F, McDermott A, Zeger SL, Samet JM. On the use of generalized additive models in time-series studies of air pollution and health. Am J Epidemiol. 2002;156(3):193–203. doi: 10.1093/aje/kwf062. [DOI] [PubMed] [Google Scholar]
- European Commission (2005) CAFE CBA: Baseline Analysis 2000 to 2020. http://ec.europa.eu/environment/air/cafe/activities/pdf/cba_baseline_results2000_2020.pdf
- Host S, Larrieu S, Pascal L, Blanchard M, Declercq C, Fabre P, Jusot J-F, Chardon B, Le Tertre A, Wagner V, Prouvost H, Lefranc A (2008) Short-term Associations between fine and coarse particles and cardiorespiratory hospitalizations in six French cities. Occup Environ Med 65(8):544–545 (Aug) [DOI] [PubMed]
- Katsouyanni K, Schwartz J, Spix C, et al. Short-term effects of air pollution on health: a European approach using epidemiologic time-series data: the APHEA protocol. J Epidemiol Community Health. 1996;50(suppl 1):S12–S18. doi: 10.1136/jech.50.Suppl_1.S12. [DOI] [PMC free article] [PubMed] [Google Scholar]
- Katsouyanni K, Touloumi G, Samoli E, et al. Confounding and effect modification in the short-term effects of ambient particles on total mortality: results from 29 European cities within the APHEA2 project. Epidemiology. 2001;12:521–531. doi: 10.1097/00001648-200109000-00011. [DOI] [PubMed] [Google Scholar]
- Künzli N, Kaiser R, Medina S, et al. Public-health impact of outdoor and traffic-related air pollution: a European assessment. Lancet. 2000;356:795–801. doi: 10.1016/S0140-6736(00)02653-2. [DOI] [PubMed] [Google Scholar]
- Le Tertre A, Quenel P, Eilstein D, Medina S, Prouvost H, Pascal L, Boumghar A, Saviuc P, Zeghnoun A, Filleul L, Declercq C, Cassadou S, Le Goaster C. Short-term effects of air pollution on mortality in nine French cities: a quantitative summary. Arch Environ Health. 2002;57(4):311–319. doi: 10.1080/00039890209601414. [DOI] [PubMed] [Google Scholar]
- Le Tertre A, Schwartz J, Touloumi G. Empirical Bayes and adjusted estimates approach to estimating the relation of mortality to exposure of PM(10) Risk Anal. 2005;25(3):711–718. doi: 10.1111/j.1539-6924.2005.00606.x. [DOI] [PubMed] [Google Scholar]
- Lu Y, Zeger SL. On the equivalence of case-crossover and time series methods in environmental epidemiology. Biostatistics. 2007;8(2):337–344. doi: 10.1093/biostatistics/kxl013. [DOI] [PubMed] [Google Scholar]
- Medina S, Le Tertre A, Quénel P, et al. Air pollution and doctors’ house calls: results from the ERPURS system for monitoring the effects of air pollution on public health in Greater Paris, France, 1991–1995. Environ Res. 1997;75(1):73–84. doi: 10.1006/enrs.1997.3773. [DOI] [PubMed] [Google Scholar]
- Medina S, Plasència A, Artazcoz L, Quénel P, Katsouyanni K, Mücke HG, De Saeger E, Krzyzanowsky M, Schwartz J, the contributing members of the APHEIS group . APHEIS monitoring the effects of air pollution on public health in Europe. Scientific report 1999–2000. Saint-Maurice: Institut de Veille Sanitaire; 2001. [Google Scholar]
- Medina S, Plasència A, Artazcoz L, Quénel P, Katsouyanni K, Mücke H-G, De Saeger E, Krzyzanowsky M, Schwartz J, the contributing members of the APHEIS group . APHEIS health impact assessment of air pollution in 26 European cities. Second year report 2000–2001. Saint-Maurice: Institut de Veille Sanitaire; 2002. [Google Scholar]
- Medina S, Plasencia A, Ballester F, Mücke HG, Schwartz J, the contributing members of the APHEIS group Apheis: public health impact of PM10 in 19 European cities. J Epidemiol Community Health. 2004;58:831–836. doi: 10.1136/jech.2003.016386. [DOI] [PMC free article] [PubMed] [Google Scholar]
- Pope CA 3rd, Burnett RT, Thun MJ et al (2002) Lung cancer, cardiopulmonary mortality, and long-term exposure to fine particulate air pollution. JAMA 287(9):1132–1141 (Mar 6) [DOI] [PMC free article] [PubMed]
- Quénel P, Cassadou S, Declercq C, Eilstein D, Filleul L, Le Goaster C, Le Tertre A, Medina S, Pascal L, Prouvost H, Saviuc P, Zeghnoun A. Surveillance des effets sur la santé liés à la pollution atmosphérique en milieu urbain. Saint-Maurice: Institut de Veille Sanitaire; 1999. [Google Scholar]
- Sommer H, Künzli N, Seethaler R et al (2000) Economic evaluation of health impacts due to road traffic-related air pollution. Expert Workshop on Assessing the Ancillary Benefits and Costs of Greenhouse Gas Mitigation Strategies, 27–29 March 2000, Washington, D.C.
- Teutsch SM, Churchill RE, editors. Principles and practice of public health surveillance. New York: Oxford University Press; 1994. [Google Scholar]
- WHO (2000) Evaluation and use of epidemiological evidence for Environmental Health Risk Assessment. WHO Regional Office for Europe, Copenhagen (EUR/00/5020369)
- WHO (2001) Quantification of health effects of exposure to air pollution. WHO, Regional Office for Europe, Copenhagen (EUR/01/5026342)
- WHO (2004) Health aspects of air pollution - answers to follow-up questions from CAFE report on a WHO working group meeting. Bonn, Germany, 15–16 January 2004. WHO Regional Office for Europe, Copenhagen 2004 (EUR/04/5046026)
- Zanobetti A, Schwartz J, Samoli E et al (2002) The temporal pattern of mortality responses to air pollution: a multicity assessment of mortality displacement. Epidemiology 13(1):87–93 (Jan) [DOI] [PubMed]
- Zanobetti A, Schwartz J, Samoli E et al (2003) The temporal pattern of respiratory and heart disease mortality in response to air pollution. Environ Health Perspect 111(9):1188–93 (Jul) [DOI] [PMC free article] [PubMed]


