

Abstract
Analyses of gene expression datasets from multiple individuals and species promise to illuminate the mode of evolution of gene expression. However, complementary complexities challenge this enterprise. Characterization of the genetic variation underlying gene expression can easily be compromised by lack of environmental control. Conversely, the breadth of conclusions from studies of environmental effects have been limited by use of single strains. Controlled studies have hinted at extensive gene-by-environment interaction. Thus, both genetics and environment are key components to models of the evolution of gene expression. We review the literature on the genetics of gene expression evolution (G), the environmental response literature (E), and the literature on gene expression as a G x E interaction to make this conceptual point.
As genomic sequence accumulates for organisms across the tree of life, a central goal remains to map the relationship of genotype to phenotype. One of the earliest accessible phenotypes consists of the timing, quantity, and sequence of mRNA transcribed. Thus, describing within-species diversity (polymorphism) and between species variation (divergence) in mRNA levels at a genomic scale can provide insight into phenotypic evolution. Microarrays and high-thoroughput mRNA sequence census techniques have enabled the scientific community to amass a extensive data on gene expression variation, yet transcriptomic research has yet to deliver a clear picture of the evolutionary process leading to extant patterns of variation.
Interpreting the evolutionary dynamics of gene expression data will require a) development of clear hypotheses for the patterns of gene expression variation expected under varying evolutionary models, and b) evaluation of the fit of observed gene expression variation to the predictions of competing hypotheses. Generating explicit, testable predictions will be simplified by construction of evolutionary models specifying the roles of fundamental processes like mutation and selection in shaping variation. Furthermore, testing between models for the genetic evolution of gene expression requires accounting for the environmentally plastic nature of gene expression. Variation in gene expression due to environmental differences sometimes exceeds that due to genetic variation1. Moreover, recent studies hint that gene-by-environment (GxE) interactions might constitute a larger proportion of gene expression variation than previously appreciated. Thus, the evolution of gene expression phenotypes might be best modeled as genotypic responses to environmental stimuli or norms of reaction. Here we review selected literature on genetic evolution and environmental plasticity of gene expression to suggest productive avenues for future research.
Genetics of gene expression evolution
Divergent hypotheses about the origin and maintenance of gene expression variation within populations and between species have drawn support from varying types of data. First, we review the approaches and logic used to illuminate the mode of genetic evolution of gene expression.
Neutral accumulation of genetic variation
A model of the unbounded neutral evolution of gene expression predicts that genetic distance and expression divergence will be correlated, and will accumulate linearly with time. In primate and mouse brain tissue harvested from post-mortem adult and healthy adult specimens respectively, average squared difference in expression across all genes was linearly correlated with estimated time since species divergence2. In Brassicaceae leaf tissue harvested from plants grown on 0.8% agar with MS salts, a comparison of the square root of the sum of the squared differences in mean expression across all genes to evolutionary distance as revealed by comparative genomic hybridizations yielded a monotonic relationship between evolutionary distance and expression variation3. Realistically, all genes in a single lineage are unlikely to experience identical evolutionary pressures4, thus a single genomic correlation likely obscures the idiosyncratic evolutionary history of expression in individual genes or pathways. On a gene-by-gene basis, a small, statistically significant correlation has been found between expression polymorphism and expression divergence in primates2, mice2, and in fish5. However, this mild correlation between genetic distance or expression polymorphism and expression divergence leaves much more to be revealed regarding how population genetic variation in gene expression assorts to between-species divergence. Such a relationship is potentially consistent with many evolutionary models incorporating either neutral stochastic drift or natural selection.
Polymorphism, divergence, and selection
Under stabilizing selection, genes are predicted to exhibit consistent expression within and across taxa, and under directional selection, genes are predicted to exhibit little expression polymorphism, but large divergence. Ranking of gene expression polymorphism and divergence has been used to identify genes whose expression is potentially under stabilizing and directional selection, between humans, chimpanzees, and rhesus macaques in liver, kidney and heart tissue collected after death from natural causes or euthanasia6. Across tissues, genes ranked as evolutionarily stable exhibited enrichment for transcription factors, metabolic, and housekeeping genes with conserved function. Similar criteria were applied to multiple lines of Drosophila melanogaster and two sister species grown in uncrowded conditions on standard cornmeal media over a developmental transition7, to identify stabilizing and directional selection. Genes were classified as evolving under stabilizing selection when the observed expression differences lay outside a shared error distribution around a common mean for all lines. Conversely, genes were inferred to have experienced lineage-specific directional selection when expression measurements fell within a common distribution for D. melanogaster, but varied between Drosophila species. Using these criteria, 67% of developmentally changing genes were evolutionarily stable across species, including many transcription factors and signal transducers. In contrast, 25% of developmentally changing genes were consistent with lineage-specific directional selection. However, a puzzling consequence of this pair of complementary tests is that the number of genes categorized as under selection versus drift depends utterly upon the statistical precision of the gene expression dataset.
Mutational variance and the genetics of gene expression evolution
A more biologically motivated parameterization of neutral evolution projects the variance added by mutation (mutational variance) each generation onto the time elapsed since the divergence of two taxa, to derive a neutral expectation for their expression divergence. Mutational variances have been estimated from extant polymorphism7, from mutational variances measured for other phenotypes8, from expression divergence of non-coding sequence suspected to be neutral2, and from mutation accumulation studies 9-11. Rifkin and coauthors, for instance, compare gene expression divergence for those genes inconsistent with their statistical tests for selection to a neutral model, parameterized using measured polymorphism in D. melanogaster as an estimate for mutational variance7. This test classifies 7% of developmentally changing genes across Drosophila as consistent with a neutral drift model, and 0.9% as inconsistent with the drift model. The abundance of genes under selection identified by both tests applied by Rifkin and coauthors is consistent with findings from another study, parameterized with a mutational variance selected from a range encompassing those measured for other phenotypes8. Predicted expression divergence in this study was generally greater than observed gene expression differences across subspecies of fruit flies and mice, and species of fruit flies, mice, and primates, suggesting a widespread role for stabilizing selection.
Measuring mutational variance
Empirical estimates of mutational variance for gene expression provide a more direct method for parameterizing neutral models. One possible estimate for mutational variance arises from the differential expression of expressed pseudogenes between diverging lineages2. However, pseudogenes that have retained activity as well as strong sequence conservation over long timescales might not be evolving neutrally8. More pertinently, gene expression variation introduced by mutation can be directly estimated from mutation accumulation studies. These studies measure the effects of mutation on phenotype by evolving organisms under permissive laboratory conditions with frequent population bottlenecks to retain novel mutations even at a fitness cost. Such experiments yield mutational variances for gene expression phenotypes in the range of 10−5 increase in trait variance per generation9-11. This variance is lower than that observed for many morphological phenotypes, but nevertheless higher than polymorphism in gene expression observed among natural isolates9, 10. As natural isolates accumulating genetic differences over millennia show less variation than arises in the lab over relatively few generations, mutation accumulation studies imply that models of neutral drift are inconsistent with gene expression evolution over long time scales.
Quantitative genetic modeling of the genetics of gene expression evolution
Growing numbers of population datasets might soon elucidate microevolutionary processes involved in gene expression evolution (see Box 1). Models more closely reflecting the range of evolutionary processes hypothesized to drive gene expression evolution will increase our power to discriminate between evolutionary hypotheses and clarify the data types required to evaluate them. Quantitative genetics models developed for the analysis of polygenic traits 12-15 have not yet been comprehensively applied to the evolution of gene expression. A range of models describing expression divergence between duplicate genes16-18 provide a valuable start in this direction, but remain limited by simplifying assumptions about selection. Likewise, the unbounded accumulation of gene expression variation over extended evolutionary time under strict neutrality lacks any force constraining expression levels within a physiologically reasonable range8. A reasonable null hypothesis for future models of gene expression evolution might be one of bounded neutral drift where basic transcriptional or genetic constraints impose an upper limit on expression, and expression levels drift stochastically between this upper limit and a lower limit of expression, perhaps zero.
Population variation in gene expression and experimental power.
Early studies in organisms from yeast to humans surveying population polymorphism in gene expression have reported widely varying results for the number of genes whose expression varied between individuals5, 45, 60, 74-91, making the formulation of general rules problematic92. Some of the putative discrepancies undoubtedly arise because these studies employ varying criteria for calling genes differentially expressed, and generally have not scaled their results to account for experimental power to detect differences. The precision of measurement and experimental design of a gene expression study determines the degree to which it is possible to reliably estimate gene expression levels; the more reliably one can estimate expression level, the more likely one is to be able to call a small observed difference significant93. To draw comparisons across studies, it is therefore critical that authors report not only the significant differences that were detected, but also the experimental power employed. For example, early work in the fruit fly classified genes as male-biased or female-biased based on the sex in which the gene had greater expression under typical culture conditions, demonstrating that a higher proportion of the significantly differentially expressed genes were male-biased than female-biased85. In contrast, a recent study featuring higher power has revealed that the magnitude of expression differences between the sexes are greater for male-biased than female-biased genes, but that the total number of expression differences detected at high power are roughly equal for genes with male-biased and female-biased expression 94. Although these results might at first appear contradictory, they are in fact consistent, once statistical power is understood. Thus, interpretation of biological patterns of variation in gene expression data must be carefully cognizant of the limitations imposed by the statistical power applied.
A second step towards explicitly modeling the underlying processes requires focusing on units smaller than whole genomes. While genes embedded in the same pathway are likely to share some sources of transcriptional variance, efforts to describe the dynamics of genetic evolution of gene expression should begin by exploring models that allow different genes to follow differing selective trajectories. This approach permits a more realistic and complete description of the forces acting on expression levels of different genes. It also is consistent our current understanding of sequence evolution of genes, where diverse evolutionary models fit data from different loci4. Assessing the support for the differing models by capitalizing on multiple independent sources of data from mutation accumulation studies to surveys of expression to comparison with molecular evolutionary trees will accelerate insight into the genetic evolution of gene expression.
However, analyzing the genetic evolution of gene expression as a static phenotypic trait risks misattributing environmental variation to genetic sources. Inferring genetic evolution from expression differences in the absence of environmental control is particularly likely to be challenging for cross-species comparisons, where extensive differences in social, cultural, and ecological environments shape many aspects of development. Recent work comparing transcriptional profiles of mouse livers illuminates this point: mice were fed diets consisting of human prepared food or a fruit-vegetable-yogurt primate facility diet19. Genes detected as differentially expressed between the livers of mice fed chimpanzee diets versus human diets overlapped with genes differentially expressed in comparisons between chimpanzee and human livers by a proportion greater than expected by chance. The conservation of transcriptional plasticity to diet between mice, chimpanzees, and humans is itself remarkable, but this result importantly implies that design of gene expression experiments and interpretation of their conclusions must take environmental effects into account in order to make sound inferences about the nature of evolution of gene expression.
Environmental effects on gene expression
Environmental effects on gene expression have been measured for many abiotic factors including chemical composition20-24, light levels25, acoustic signals26, temperature changes20, 27, 28, altitude29, and gravitational forces30-32. Effects of biotic factors in the environment have also been revealed, including responses to food availability33, 34, injury or threat of predation35, 36, infection37-40, captivity41, and social interactions 42, 43. Because gene expression level can be highly plastic to environment, a thorough interpretation of gene expression variation requires evaluation of environmental axes of expression variation. In particular, one concern common to all gene expression studies is the need to account for influences of past and present environments on expression levels (Box 2).
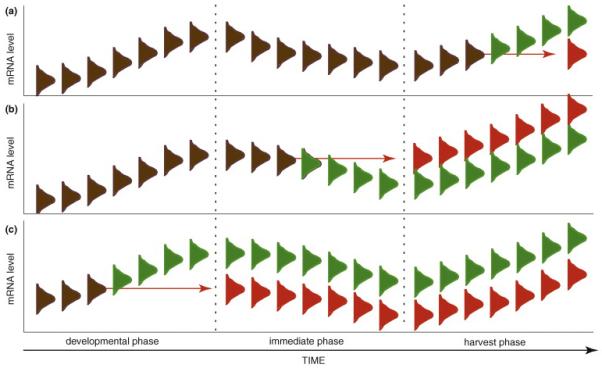
Three scenarios demonstrating the importance of the complete environmental history of the mRNA sample to measurement of gene expression level.
Temporally changing environments can be characterized as acting on gene expression over diverse time scales, including developmental environments, environments immediately preceding tissue harvest, and harvest and measurement environments. In Figure I, bell curves represent genetic variation. In each panel, two samples exhibit identical genetic potential for gene expression (brown), but experience an environmental perturbation at one of these three environmental timescales that causes significant variation in gene expression levels (green vs. red). Time scales of environmental variation are represented on the x-axis. The far right represents the final measured mRNA levels, which can differ substantially due to all perturbations.
(a) mRNA harvest
The harvest procedure creates an environment that frequently results in rapid transcriptional responses. Slight differences in treatment or timing of the harvest procedure among samples can result in extensive differences in genome-wide gene expression. For example, storing unfrozen tissue on ice for varying durations or cooling it at varying rates can lead to extensive differential expression.
(b) Immediate environment
All aspects of the immediate environment of the organism prior to sampling can impact expression measurements. The scale over which immediate environments influence gene expression varies widely with the stimulus. For example, in an experiment on fish, the social environment of an individual fish over the day before sampling could influence brain gene expression independently from the social interactions occurring in the moment before sampling. Other environmental effects can completely reset with environmental change so that the current environment is the only one that is relevant. Thus, the salinity of the environment of the fish immediately before harvest is likely to have more impact on gene expression levels than small fluctuations in the preceding week. Differences between the immediate environments of two sampled fish, including differences in salinity experienced in the prior minute or amount of aggression experienced in the prior day, could increase measured variation in gene expression.
(c) Developmental environment
Environmental conditions extending throughout the developmental history of the organism sampled can contribute to gene expression differences observed, even when immediate environment and mRNA harvest are perfectly controlled. For instance, age and nutritional environment often codetermine organismal size. Thus, using size as a proxy for developmental stage could lead to extensive variation in gene expression between younger organisms that have experienced better nutrition and more aged organisms that have experienced worse nutrition during development.
Effects of the environment during development
Environmental conditions during early life can act as developmental switches directing phenotypically plastic responses along particular trajectories44. While activation of a particular developmental pathway is likely mediated by transcription as it occurs, variation in gene expression between mature alternative phenotypes later in life can retain a signature of the early environment. The influence of rearing environments including diet for fruit flies (D. melanogaster) and wild versus hatchery conditions for Atlantic salmon (Salmo salar) on later gene expression levels exemplify the enduring effects of developmental environments on gene expression45, 46.
Developmental environments might be particularly likely to shape lifelong gene expression when they influence genomic imprinting. For instance, the quality of maternal care in rats (Rattus norvegicus) alters chromatin imprinting, impacting gene expression and behavioral states later in life47. Humans exposed to famine prenatally during WWII show significant differences in DNA methylation compared to unexposed same-sex siblings48. This altered methylation is thought to induce long-term changes in expression patterns, which might underlie an association between early gestational famine and disease48. While much remains unknown about the influences of developmental environments on genomic imprinting, what is known argues that meticulous control of developmental environment is critical for correctly attributing the sources of gene expression variation.
Effects of the immediate environment
Rapid and extensive gene expression responses induced by environmental perturbation directly before sampling illustrate the importance of controlling for the influence of the immediate environment. In budding yeast, cells exposed to a panel of environmental stressors (including heat shock, ethanol shock, osmotic shock, pH extremes, starvation, oxidative stress, reductive stress, and DNA damage) differentially express of up to a third of the genome20, 49. Multicellular organisms also rapidly alter expression levels in response to immediate environmental stimuli. For example, rats (R. norvegicus) exposed to threat of predation for ten minute intervals35 and female swordtails (Xiphophorus nigrensis) exposed to varying short-term social stimuli show differences in brain gene expression42. In responding to the abiotic environment, A. thaliana seedlings differentially express genes in response to simulated shade within an hour25, and Japanese flounder (Paralichthys olivaceus) exposed to polycyclic aromatic hydrocarbons for three days show altered liver gene expression50. The time scale on which it is necessary to consider environmental contributions to gene expression variation will vary with the phenotype under study (Box 2), but standardizing immediate environments between samples is critical for extracting the clearest possible signal for the differences of interest.
Effects of harvest
Gene expression variation can also be easily introduced during measurement. For many expression analyses, harvest environments include tissue harvest technique and storage, RNA extraction, reverse transcription, labeling and hybridization. Reverse transcription and labeling introduce known biases into measured expression profiles that can be countered by designing experiments in which fluorophores are flipped in a balanced design51-53. Variation in harvest environments as small as different centrifuge temperatures during spin-down of yeast cultures, or differing numbers Drosophila pooled during sacrifice, introduces significant differences in measured expression levels. One study investigating the effect of gravitropism on A. thaliana controlled for the effect of a mechanical perturbation on gene expression: Moseyko and coauthors examined expression in roots of plants positioned horizontally for 30 minutes, and also in control plants rotated a complete 360 degrees over 10 seconds, then left undisturbed for 30 minutes before sampling54. This control manipulation was too short in duration to activate the known gravitropic response pathway, yet the mechanical rotation affected the expression of 192 genes compared to undisturbed plants left in a vertical position54. Given the vulnerability of expression data to such experimental effects, minimizing manipulation or perturbation of the environments experienced by organisms during sampling, and ensuring that all samples under comparison share the exactly the same inevitable sources of error, is critical to measurement of a robust signal of the transcriptional profile for a distinct environmental context.
Environment & gene expression evolution
The environment operates on phenotypes jointly as an “agent of development”, shaping the expression of traits, and as an “agent of selection”, filtering the genotypes surviving to produce the next generation 44. The degree to which plasticity in gene expression impacts organismal fitness across environments is a pressing unknown. The fitness effects of plasticity in the expression of a gene in a particular environment could fall anywhere along a continuum, between no impact and tight selective constraint, around an adaptive optimum. Depending on the fitness costs and benefits involved55, selection might be expected to optimize gene expression phenotypes for high fitness in the environments that trigger them. Such responses could range from condition-specific changes narrowly tuned to particular environments to general responses to any perceived environmental perturbation. Indeed, both highly specific and more global expression responses have been documented20. Non-adaptive environmental variation in expression could arise if the physical effects of the environmental change directly impact the transcriptional process or indirectly alter expression through epistatic interactions. Condition-specific epistasis has been identified among duplicate genes in yeast, suggesting that altered environments can shift the wiring of transcriptional networks to yoke together genes that do not interact under all conditions56. Thus, uncovering the source of plastic expression phenotypes might be complicated by deviations from the annotated sets of interacting genes identified under rich laboratory conditions.
Evolved plastic responses also influence evolutionary trajectories by affecting organismal fitness in novel environments. Transcriptional plasticity in a novel environment could result in beneficial, deleterious, or negligible effects on fitness, due to chance or due to a hisyory of past encounters with similar environmental challenges. Much of the theory developed to explore the evolution of phenotypic plasticity under varying formulations of the costs and benefits of plasticity in both stably fluctuating environments and novel environments is relevant to gene expression phenotypes44, 57, 58 though the role of properties like epistasis and mutational accessibility of divergent gene expression states might require additional clarification for transcriptional plasticity. Moreover, statistical methods and theory developed to deal with morphological traits demonstrating plasticity over a variable environment can prove useful in analyzing gene expression (Box 3).
Modeling Environmental Plasticity in Gene Expression as a Continuous Trait.
Understanding the influence of genotype-by-environment interactions on gene expression is a critical goal for disciplines from human medicine to the ecology of our changing planet, yet our ability to make inferences about gene expression responses to environmental gradients are limited by analysis methods that often unnecessarily discretize what might be best understood as continuous norm of reaction. Treatment of gene expression levels measured and statistically estimated at discrete values of an environmental gradients as separate, possibly correlated traits discards significant information by suppressing the relationships among the values of the environmental gradient at which expression was sampled. An alternative possibility would be to assign a flexible functional form to the relationship between environment and expression level. Measurements could then be applied to statistically estimate the optimal functional parameterization using the methods developed for function-valued traits95. Comparison of these function-valued responses would provide a much more direct approach toward characterizing the gene expression response of an organism to the environment and therefore toward characterizing GxE interactions as well. A function-valued approach for cyclical analysis of gene expression during a developmental time course in the yeast cell cycle provided an improved error-rate classification 96. Incorporating a function-valued trait approach has been shown to increase the statistical power to discern differences, such as those that could be attributable to genetics, environment, or gene-by-environment interactions in QTL analyses97. Moreover, precise parameterization of gene expression as a function-valued trait has the potential to shift the focus of expression studies from simple identification of which genes are up and down to instead how genetic differences modulate the way organisms respond to environmental conditions.
Genetic variation arising from mutation might provide variation in environmental plasticity in expression. A long-term product of this variation is the potential for species to evolve novel environmental plasticity. A more direct, short-term product of this variation is gene-by-environment interaction, in which different genotypes show varying transcriptional responses to identical environments. Thus, to truly understand the evolution of gene expression requires dealing with expression variation not just as a product of genetic variation, nor simply as a product of environmental variation, but as a product jointly of genes and environment.
Gene x Environment interactions and gene expression
There is little reason to believe that genetic and environmental variation in gene expression combine in a simple additive fashion (e.g. as depicted in Box 2 Figure I). Rather, a growing literature implicates interactions between the two. The resulting “reaction norm” describes expression of a single genotype across a range of environments. These patterns might vary from allele to allele within populations, or from gene to gene between species.
Figure 1. Gene expression evolution under models of stabilizing selection, directional selection and neutral drift.

Grey bell curves represent population genetic variation in the level of expression of a gene in a particular environment. Red curves represent fitness in relation to gene expression level. Black lines represent exemplar mutants that survive or die (red cross) each generation. Identical mutations generated under varying selective conditions produce different final expectations for the mean and variance of distributions of gene expression levels.
A) Stabilizing selection: The production of new genetic variants is balanced by selection against variants at the extremes of the distribution of gene expression levels.
B) Directional selection: Selection preferentially eliminates genetic variants at one end of the distribution, leading to shifting of the distribution mean until a new balance is achieved or a new selective regime is entered.
C) Neutral drift: Under unbounded neutrality, mutational biases and sampling dynamics determine evolutionary trends. If all expression levels are equally fit, expected variance will increase with time. Depending on population sizes, chance sampling effects could lead to occasional loss of variation and consequential distributional shifts. The expected mean of the distribution will remain unchanged.
Within populations, allelic polymorphism for gene expression reaction norms results in varying transcriptional responses for genotypes across environments59. Varying reaction norms for gene expression phenotypes have been revealed in natural populations by investigation of the genetic basis of prominent macroscopic phenotypes. For instance, European flounder (Platichthys flesus) sampled from high-saline North Sea and brackish Baltic Sea populations show variation in plastic gene expression response to high- and low-salinity conditions in the immediate environment60. A significant interaction between developmental food source and genetic background on both gene expression and behavioral norms of reaction was demonstrated in wild-derived inbred lines of fruit flies (D. melanogaster) responding to alcohol odor cues61. In this study, complementation tests for two genes showed that gene expression gene-by-environment interactions influenced behavioral reaction norms for an olfactory response, thus linking transcriptional and behavioral plasticity61. In contrast, studies investigating gene expression polymorphism in honey bees (Apis mellifera) expressing variable susceptibility to mite infection62, and in fire ants (Solenopsis invicta) forming single or multiple queen colonies based on genetic identity of their social environment63, detected significant effects of genetic background and environmental conditions on gene expression, but few genes showing an interaction between the two. Whether lack of evidence for gene-by-environment interactions stands as evidence of absence will only be answered by further sampling at greater depth. However, ruling out the importance of such interactions requires applying high power for revealing small differences to exhaustively sample a broad range of ecologically-relevant environments.
Genetic manipulations can identify the cellular mechanisms underlying accommodation to the current environment by precisely perturbing genetic networks and then measuring the resulting impact on gene expression reaction norms64. Tightly controlling genetic variation in order to investigate the mechanistic basis and adaptive benefits of gene by environment interactions provides insight into how genomes cope with variable environmental challenges, but misses information about the evolutionary process encoded in the existing natural genetic variation for norms of reaction.
Exploring the reaction norms of natural isolates for well-studied model organisms in a laboratory setting facilitates the balancing of these two goals. The detailed annotation and genome resources available for model organisms allow investigation of the nature and the limits of gene expression norms of reactions. Quantitative linkage studies exploring the genetic control of plastic expression levels, across varying carbon sources for yeast and varying temperature regimes for C. elegans, suggest that large gene-by-environment interactions might be mainly due to trans-acting polymorphisms59, 65. Gene-by-environment interactions assessed across a broad sample of yeast strains showed that existing genetic variation for transcriptional plasticity is biased towards genes that are dispensable to cell survival in rich conditions and towards genes with paralogs in the genome66. Thus, mutations influencing environment-specific expression might persist primarily in robust gene networks that are somewhat buffered against environmental perturbation by genetic redundancy or dispensability with regards to fitness66. However, even “non-essential” genes can impact fitness in the right environment. Recent work screening the set of yeast gene deletion strains across 400 environments reveals a fitness effect for 97% of genes, highlighting again that essentiality is defined specifically with regard to particular environmental contexts67. Therefore, it will often be more informative and insightful to think of alleles for gene expression as each contributing (additively or non-additively) to a norm of reaction across environments, rather than to a static expression level or fitness.
A natural consequence of population genetic variation in norms of reaction and the filtering of those responses by selection or drift is divergence of reaction norms between species. Thus, differences in gene expression between species might also be best described as joint functions of their genetic and environmental divergence. Between-species comparisons of gene expression profiles have typically been used to discern the impact of evolutionary distance on gene expression divergence or to define common gene expression signatures of shared biological processes or constraints68. Relatively few studies have investigated the differential responses to environmental variation due to evolved species differences in gene expression reaction norms. Several notable exceptions provide perspective on the insight available from evaluating norms of reaction across species.
Comparing gene expression reaction norms for cold tolerance in the wild crucifer Thlaspi arvense to A. thaliana demonstrated some conserved responses to cold between the species, as well as novel cold-regulated pathways potentially responsible for T. arvense’s greater cold tolerance69. Comparison of transcriptional profiles of the soybean cyst nematode (Heterodera glycines) to published data from C. elegans across varying life stages suggests that the arrested development of the infective juvenile life stage of the soybean cyst nematode is metabolically distinct from developmental arrest in C. elegans70. Such comparisons of norms of reactions between species provide a valuable picture of diverse gene expression responses of divergent species in their corresponding ecology; however, comparative evolutionary inferences drawing on published datasets is challenged by variation in species-specific requirements and characteristics, as well as the difficulty of standardizing experimental culture conditions between experiments across laboratories. Cross-laboratory comparisons of gene expression require strict adherence to common protocols to limit the additional uncontrolled variation introduced by slight experimental differences.
In some cases, variation in culture conditions is introduced within laboratories to contrast reaction norms of species with varying biological requirements. Jiao and coauthors measured differential gene expression during light-regulated seedling development in rice (Oryza sativa) and A. thaliana71. They identified shared metabolic pathways regulated by light as well as species differences in light responses of organ-specific expression profiles. However, even in a common laboratory setting, necessary environmental variation for culturing the two species creates a discrepancy between the reaction norms being compared. While evolved expression differences between species certainly include different habitat use or ecological niches, we gain the most power in discriminating the source of evolved gene expression differences by comparing species in identical environments.
Two studies have taken advantage of the similar ecology of closely related species to directly compare between-species norms of reaction in common environments. A detailed analysis of the influence of the toxin 2,3,7,8-tetraclorodibenzo-p-dioxin (TCDD) on the hepatic gene expression profiles of rats and mice raised under identical conditions, revealed both conserved and species-specific gene expression responses to TCDD consistent with physiological data72. Tirosh and coauthors exploited the similar habitats of four yeast species to perform between-species comparisons across five common environmental conditions and identify a common regulatory motif enhancing sensitivity of gene expression to perturbation, potentially contributing to expression divergence between species73.
In considering gene expression norms of reaction, both within populations and between species, one final key issue is the relationship between the power of a given study and the number of gene-by-environment interactions detected (Box 1). The more reliably one can estimate gene expression levels across replicates, the higher power a study will have to call small interaction effects significant. For example, a comparison of two strains of yeast in two environments with high replication59 detected ten times more transcripts showing strain-condition interactions than a comparison of six strains of yeast in four environmental conditions with lower replication66. The contrast here illustrates a basic tension in quantifying genetic variation for transcriptional plasticity in nature: whether to increase replication of few genotypes in few environments or to better represent the range of genetic or environmental variation possible at a cost to sensitivity for detecting small differences. Developing statistical methods for comparison of gene expression reaction norms as function-valued traits might help keep research efforts focused on effect sizes rather than power-dependent p-values, improving comparability across experiments as well as increasing statistical power (Box 2). Ultimately, more comprehensive sampling is required across taxa, populations, and environments. This goal grows increasingly attainable as methods for measuring gene expression across diverse species decrease in cost and increase in accessibility.
Conclusion
As new technologies make comprehensive description of gene expression levels more accessible, it is critical that gene expression phenotypes be considered as a function of a particular environmental context as well as the product of a genotype. Specifically, attributing the sources of variation in gene expression phenotypes, whether within populations or between species, requires controlling for the effect of environmental variation in development, immediate environment, and RNA harvest. Applying environmentally contextualized gene expression datasets to questions regarding the evolution of gene expression will be aided by a clear understanding of the underlying implications of varying evolutionary models. In particular, identifying and collecting the most informative sources of data for describing gene expression evolution will be assisted by parameterization of quantitative models of phenotypic evolution13 under varying selective regimes on a gene-by-gene basis. Thus, clarifying the process by which genetic variation is realized in its environmental context brings us one step closer to a more complete understanding of the phenotypic evolution of diversity.
Acknowledgements
We thank A. Adomas, F. Lopez-Giraldez, K. Prudic, and Z. Zhang for helpful conversations regarding these issues and A. Stoehr, Z. Wang, and E. Westerman for feedback on earlier drafts, and apologize to colleagues whose work has not been cited because of limited space. This work was supported by funding and a Junior Faculty Fellowship from Yale University and the NIH T32 GM007499 Training Program in Genetics.
Footnotes
Publisher's Disclaimer: This is a PDF file of an unedited manuscript that has been accepted for publication. As a service to our customers we are providing this early version of the manuscript. The manuscript will undergo copyediting, typesetting, and review of the resulting proof before it is published in its final citable form. Please note that during the production process errors may be discovered which could affect the content, and all legal disclaimers that apply to the journal pertain.
References
- 1.Gibson G. The environmental contribution to gene expression profiles. Nat Rev Genet. 2008;9:575–581. doi: 10.1038/nrg2383. [DOI] [PubMed] [Google Scholar]
- 2.Khaitovich P, et al. A neutral model of transcriptome evolution. PLOS Biology. 2004;2:682–689. doi: 10.1371/journal.pbio.0020132. [DOI] [PMC free article] [PubMed] [Google Scholar]
- 3.Broadley M, et al. Evidence of neutral transcriptome evolution in plants. New Phytologist. 2008;180:587–593. doi: 10.1111/j.1469-8137.2008.02640.x. [DOI] [PubMed] [Google Scholar]
- 4.Posada D, Crandall K. Selecting the best-fit model of nucleotide substitution. SYSTEMATIC BIOLOGY. 2001;50:580–601. [PubMed] [Google Scholar]
- 5.Oleksiak M, et al. Variation in gene expression within and among natural populations. Nature Genetics. 2002;32:261–266. doi: 10.1038/ng983. [DOI] [PubMed] [Google Scholar]
- 6.Blekhman R, et al. Gene Regulation in Primates Evolves under Tissue-Specific Selection Pressures. PLoS Genetics. 2008;4:e1000271. doi: 10.1371/journal.pgen.1000271. [DOI] [PMC free article] [PubMed] [Google Scholar]
- 7.Rifkin S, et al. Evolution of gene expression in the Drosophila melanogaster subgroup. NATURE GENETICS. 2003;33:138–144. doi: 10.1038/ng1086. [DOI] [PubMed] [Google Scholar]
- 8.Lemos B, et al. Rates of divergence in gene expression profiles of primates, mice and flies: stabilizing selection and variability among functional categories. Evolution. 2005;59:126–137. [PubMed] [Google Scholar]
- 9.Denver DR, et al. The transcriptional consequences of mutation and natural selection in Caenorhabditis elegans. Nature Genetics. 2005;37:544–548. doi: 10.1038/ng1554. [DOI] [PubMed] [Google Scholar]
- 10.Rifkin SA, et al. A mutation accumulation assay reveals a broad capacity for rapid evolution of gene expression. Nature. 2005;438:220–223. doi: 10.1038/nature04114. [DOI] [PubMed] [Google Scholar]
- 11.Landry CR, et al. Genetic properties influencing the evolvability of gene expression. Science. 2007;317:118–121. doi: 10.1126/science.1140247. [DOI] [PubMed] [Google Scholar]
- 12.LANDE R. NATURAL-SELECTION AND RANDOM GENETIC DRIFT IN PHENOTYPIC EVOLUTION. EVOLUTION. 1976;30:314–334. doi: 10.1111/j.1558-5646.1976.tb00911.x. [DOI] [PubMed] [Google Scholar]
- 13.Johnson T, Barton N. Theoretical models of selection and mutation on quantitative traits. PHILOSOPHICAL TRANSACTIONS OF THE ROYAL SOCIETY B-BIOLOGICAL SCIENCES. 2005;360:1411–1425. doi: 10.1098/rstb.2005.1667. [DOI] [PMC free article] [PubMed] [Google Scholar]
- 14.TURELLI M. PHENOTYPIC EVOLUTION, CONSTANT COVARIANCES, AND THE MAINTENANCE OF ADDITIVE VARIANCE. EVOLUTION. 1988;42:1342–1347. doi: 10.1111/j.1558-5646.1988.tb04193.x. [DOI] [PubMed] [Google Scholar]
- 15.LANDE R. GENETIC-VARIATION AND PHENOTYPIC EVOLUTION DURING ALLOPATRIC SPECIATION. AMERICAN NATURALIST. 1980;116:463–479. [Google Scholar]
- 16.Gu X, et al. Rapid evolution of expression and regulatory divergences after yeast gene duplication. PROCEEDINGS OF THE NATIONAL ACADEMY OF SCIENCES OF THE UNITED STATES OF AMERICA. 2005;102:707–712. doi: 10.1073/pnas.0409186102. [DOI] [PMC free article] [PubMed] [Google Scholar]
- 17.Li W-H, et al. Expression divergence between duplicate genes. Trends in Genetics. 2005;21:602–607. doi: 10.1016/j.tig.2005.08.006. [DOI] [PubMed] [Google Scholar]
- 18.Oakley TH, et al. Comparative Methods for the Analysis of Gene-Expression Evolution: An Example Using Yeast Functional Genomic Data. Mol Biol Evol. 2005;22:40–50. doi: 10.1093/molbev/msh257. [DOI] [PubMed] [Google Scholar]
- 19.Somel M, et al. Human and Chimpanzee Gene Expression Differences Replicated in Mice Fed Different Diets. PLoS ONE. 2008;3:e1504. doi: 10.1371/journal.pone.0001504. [DOI] [PMC free article] [PubMed] [Google Scholar]
- 20.Gasch A, et al. Genomic expression programs in the response of yeast cells to environmental change. Molecular and Cellular Biology. 2000:11. doi: 10.1091/mbc.11.12.4241. [DOI] [PMC free article] [PubMed] [Google Scholar]
- 21.Gong P, et al. Transcriptomic analysis of RDX and TNT interactive sublethal effects in the earthworm Eisenia fetida. BMC GENOMICS. 2008;9:S15. doi: 10.1186/1471-2164-9-S1-S15. [DOI] [PMC free article] [PubMed] [Google Scholar]
- 22.Royland JE, Kodavanti PRS. Gene expression profiles following exposure to a developmental neurotoxicant, Aroclor 1254: Pathway analysis for possible mode(s) of action. Toxicology and Applied Pharmacology. 2008;231:179–196. doi: 10.1016/j.taap.2008.04.023. [DOI] [PubMed] [Google Scholar]
- 23.Donofrio NM, et al. Global gene expression during nitrogen starvation in the rice blast fungus, Magnaporthe grisea. Fungal Genetics and Biology. 2006;43:605–617. doi: 10.1016/j.fgb.2006.03.005. [DOI] [PubMed] [Google Scholar]
- 24.Poupardin R, et al. Cross-induction of detoxification genes by environmental xenobiotics and insecticides in the mosquito Aedes aegypti: Impact on larval tolerance to chemical insecticides. Insect Biochemistry and Molecular Biology. 2008;38:540–551. doi: 10.1016/j.ibmb.2008.01.004. [DOI] [PubMed] [Google Scholar]
- 25.Devlin PF, et al. A Genomic Analysis of the Shade Avoidance Response in Arabidopsis. Plant Physiol. 2003;133:1617–1629. doi: 10.1104/pp.103.034397. [DOI] [PMC free article] [PubMed] [Google Scholar]
- 26.Sun W, et al. Noise exposure-induced enhancement of auditory cortex response and changes in gene expression. Neuroscience. 2008;156:374–380. doi: 10.1016/j.neuroscience.2008.07.040. [DOI] [PMC free article] [PubMed] [Google Scholar]
- 27.Oufir M, et al. Gene expression in potato during cold exposure: Changes in carbohydrate and polyamine metabolisms. Plant Science. 2008;175:839–852. [Google Scholar]
- 28.Podrabsky JE, Somero GN. Changes in gene expression associated with acclimation to constant temperatures and fluctuating daily temperatures in an annual killifish Austrofundulus limnaeus. J Exp Biol. 2004;207:2237–2254. doi: 10.1242/jeb.01016. [DOI] [PubMed] [Google Scholar]
- 29.Cheviron ZA, et al. Transcriptomic variation and plasticity in rufous-collared sparrows (Zonotrichia capensis) along an altitudinal gradient. Molecular Ecology. 2008;17:4556–4569. doi: 10.1111/j.1365-294X.2008.03942.x. [DOI] [PubMed] [Google Scholar]
- 30.Boonyaratanakornkit JB, et al. Key gravity-sensitive signaling pathways drive T cell activation. FASEB J. 2005;19:2020–2022. doi: 10.1096/fj.05-3778fje. [DOI] [PubMed] [Google Scholar]
- 31.Kaur P, et al. Gene expression polymorphisms and ESTs associated with gravitropic response of subterranean branch meristems and growth habit in Leymus wildryes. Plant Science. 2008;175:330–338. [Google Scholar]
- 32.Nichols HL, et al. Proteomics and genomics of microgravity. Physiol. Genomics. 2006;26:163–171. doi: 10.1152/physiolgenomics.00323.2005. [DOI] [PubMed] [Google Scholar]
- 33.Ryu M-H, et al. Differential regulation of hepatic gene expression by starvation versus refeeding following a high-sucrose or high-fat diet. Nutrition. 2005;21:543–552. doi: 10.1016/j.nut.2005.01.001. [DOI] [PubMed] [Google Scholar]
- 34.Salem M, et al. Effect of starvation on global gene expression and proteolysis in rainbow trout (Oncorhynchus mykiss) BMC GENOMICS. 2007;8:328. doi: 10.1186/1471-2164-8-328. [DOI] [PMC free article] [PubMed] [Google Scholar]
- 35.Roseboom PH, et al. Predator threat induces behavioral inhibition, pituitary-adrenal activation and changes in amygdala CRF-binding protein gene expression. Psychoneuroendocrinology. 2007;32:44–55. doi: 10.1016/j.psyneuen.2006.10.002. [DOI] [PMC free article] [PubMed] [Google Scholar]
- 36.Reymond P, et al. Differential Gene Expression in Response to Mechanical Wounding and Insect Feeding in Arabidopsis. The Plant Cell. 2000;12:707–719. doi: 10.1105/tpc.12.5.707. [DOI] [PMC free article] [PubMed] [Google Scholar]
- 37.McGrath K, et al. Repressor-and Activator-Type Ethylene Response Factors Functioning in Jasmonate Signaling and Disease Resistance Identified via a Genome-Wide Screen of Arabidopsis Transcription Factor Gene Expression. Plant Physiology. 2005 doi: 10.1104/pp.105.068544. [DOI] [PMC free article] [PubMed] [Google Scholar]
- 38.Roberge C, et al. Genome-wide survey of the gene expression response to saprolegniasis in Atlantic salmon. Molecular Immunology. 2007;44:1374–1383. doi: 10.1016/j.molimm.2006.05.005. [DOI] [PubMed] [Google Scholar]
- 39.Hauton C, et al. Changes in immune gene expression and resistance to bacterial infection in lobster (Homarus gammarus) post-larval stage VI following acute or chronic exposure to immune stimulating compounds. Molecular Immunology. 2007;44:443–450. doi: 10.1016/j.molimm.2006.02.018. [DOI] [PubMed] [Google Scholar]
- 40.Johannesson H, et al. Phase-specific gene expression underlying morphological adaptations of the dimorphic human pathogenic fungus, Coccidioides posadasii. Fungal Genetics and Biology. 2006;43:545–559. doi: 10.1016/j.fgb.2006.02.003. [DOI] [PubMed] [Google Scholar]
- 41.Kennerly E, et al. A gene expression signature of confinement in peripheral blood of red wolves Canis rufus. MOLECULAR ECOLOGY. 2008;17:2782–2791. doi: 10.1111/j.1365-294X.2008.03775.x. [DOI] [PubMed] [Google Scholar]
- 42.Cummings M, et al. Sexual and social stimuli elicit rapid and contrasting genomic responses. Proceedings of the Royal Society B: Biological Sciences. 2008;275:393–402. doi: 10.1098/rspb.2007.1454. [DOI] [PMC free article] [PubMed] [Google Scholar]
- 43.Renn SCP, et al. Fish and chips: functional genomics of social plasticity in an African cichlid fish. Journal of Experimental Biology. 2008;211:3041–3056. doi: 10.1242/jeb.018242. [DOI] [PMC free article] [PubMed] [Google Scholar]
- 44.West-Eberhard MJ. Phenotypic Plasticity and the Origins of Diversity. Annual Review of Ecology and Systematics. 1989;20:249–278. [Google Scholar]
- 45.Aubin-Horth N, et al. Interaction of rearing environment and reproductive tactic on gene expression profiles in Atlantic salmon. Journal of Heredity. 2005;96:261–278. doi: 10.1093/jhered/esi030. [DOI] [PubMed] [Google Scholar]
- 46.Sambandan D, et al. Phenotypic Plasticity and Genotype by Environment Interaction for Olfactory Behavior in Drosophila melanogaster. Genetics. 2008;179:1079–1088. doi: 10.1534/genetics.108.086769. [DOI] [PMC free article] [PubMed] [Google Scholar]
- 47.Weaver ICG, et al. Nature Neuroscience. Nature Publishing Group; 2004. Epigenetic programming by maternal behavior; pp. 847–854. [DOI] [PubMed] [Google Scholar]
- 48.Heijmans BT, et al. Persistent epigenetic differences associated with prenatal exposure to famine in humans. Proceedings of the National Academy of Sciences. 2008;105:17046–17049. doi: 10.1073/pnas.0806560105. [DOI] [PMC free article] [PubMed] [Google Scholar]
- 49.Causton H, et al. Remodeling of Yeast Genome Expression in Response to Environmental Changes. MOLECULAR BIOLOGY OF THE CELL. 2001;12:323–337. doi: 10.1091/mbc.12.2.323. [DOI] [PMC free article] [PubMed] [Google Scholar]
- 50.Nakayama K, et al. Toxicogenomic analysis of immune system-related genes in Japanese flounder (Paralichthys olivaceus) exposed to heavy oil. Marine Pollution Bulletin. 2008;57:445–452. doi: 10.1016/j.marpolbul.2008.02.021. [DOI] [PubMed] [Google Scholar]
- 51.Townsend J, Taylor J. Designing experiments using spotted microarrays to detect gene regulation differences within and among species. Methods in enzymology. 2006;395:597–617. doi: 10.1016/S0076-6879(05)95031-3. [DOI] [PubMed] [Google Scholar]
- 52.Jin W, et al. The contributions of sex, genotype and age to transcriptional variance in Drosophila melanogaster. NATURE GENETICS. 2001;29:389–395. doi: 10.1038/ng766. [DOI] [PubMed] [Google Scholar]
- 53.Adomas A, et al. Multi-targeted priming for genome-wide gene expression assays. in prep. [DOI] [PMC free article] [PubMed] [Google Scholar]
- 54.Moseyko N, et al. Transcription Profiling of the Early Gravitropic Response in Arabidopsis Using High-Density Oligonucleotide Probe Microarrays. Plant Physiology. 2002;130:720–728. doi: 10.1104/pp.009688. [DOI] [PMC free article] [PubMed] [Google Scholar]
- 55.DeWitt T, et al. Costs and limits of phenotypic plasticity. TRENDS IN ECOLOGY & EVOLUTION. 1998;13:77–81. doi: 10.1016/s0169-5347(97)01274-3. [DOI] [PubMed] [Google Scholar]
- 56.Musso G, et al. The extensive and condition-dependent nature of epistasis among whole-genome duplicates in yeast. GENOME RESEARCH. 2008;18:1092–1099. doi: 10.1101/gr.076174.108. [DOI] [PMC free article] [PubMed] [Google Scholar]
- 57.Via S, Lande R. Genotype-environment interactions and the evolution of phenotypic plasticity. Evolution. 1985;39:505–522. doi: 10.1111/j.1558-5646.1985.tb00391.x. [DOI] [PubMed] [Google Scholar]
- 58.Ghalambor CK, et al. Adaptive versus non-adaptive phenotypic plasticity and the potential for contemporary adaptation in new environments. Functional Ecology. 2007;21:394–407. [Google Scholar]
- 59.Smith E, Kruglyak L. Gene-environment interaction in yeast gene expression. PLoS Biology. 2008;6:810–824. doi: 10.1371/journal.pbio.0060083. [DOI] [PMC free article] [PubMed] [Google Scholar]
- 60.Larsen P, et al. Adaptive differences in gene expression in European flounder (Platichthys flesus) Molecular Ecology. 2007;16:4674–4683. doi: 10.1111/j.1365-294X.2007.03530.x. [DOI] [PubMed] [Google Scholar]
- 61.Sambandan D, et al. Phenotypic Plasticity and Genotype by Environment Interaction for Olfactory Behavior in Drosophila melanogaster. GENETICS. 2008;179:1079. doi: 10.1534/genetics.108.086769. [DOI] [PMC free article] [PubMed] [Google Scholar]
- 62.Navajas M, et al. Differential gene expression of the honey bee Apis mellifera associated with Varroa destructor infection. BMC GENOMICS. 2008;9:301. doi: 10.1186/1471-2164-9-301. [DOI] [PMC free article] [PubMed] [Google Scholar]
- 63.Wang J, et al. Genome-Wide Expression Patterns and the Genetic Architecture of a Fundamental Social Trait. PLOS GENETICS. 2008:4. doi: 10.1371/journal.pgen.1000127. [DOI] [PMC free article] [PubMed] [Google Scholar]
- 64.Lyons TJ, et al. Genome-wide characterization of the Zap1p zinc-responsive regulon in yeast. PROCEEDINGS OF THE NATIONAL ACADEMY OF SCIENCES OF THE UNITED STATES OF AMERICA. 2000;97:7957–7962. doi: 10.1073/pnas.97.14.7957. [DOI] [PMC free article] [PubMed] [Google Scholar]
- 65.Li Y, et al. Mapping determinants of gene expression plasticity by genetical genomics in C. elegans. PLOS Genetics. 2006;2:2155–2161. doi: 10.1371/journal.pgen.0020222. [DOI] [PMC free article] [PubMed] [Google Scholar]
- 66.Landry CR, et al. Genome-wide scan reveals that genetic variation for transcriptional plasticity in yeast is biased towards multi-copy and dispensible genes. Gene. 2006;366:343–351. doi: 10.1016/j.gene.2005.10.042. [DOI] [PubMed] [Google Scholar]
- 67.Hillenmeyer M, et al. The Chemical Genomic Portrait of Yeast: Uncovering a Phenotype for All Genes. Science. 2008;320:362. doi: 10.1126/science.1150021. [DOI] [PMC free article] [PubMed] [Google Scholar]
- 68.Zhou X, Gibson G. Cross-species comparison of genome-wide expression patterns. GENOME BIOLOGY. 2004:5. doi: 10.1186/gb-2004-5-7-232. [DOI] [PMC free article] [PubMed] [Google Scholar]
- 69.Sharma N, et al. Exploiting the wild crucifer Thlaspi arvense to identify conserved and novel genes expressed during a plant’s response to cold stress. Plant Molecular Biology. 2007;63:171–184. doi: 10.1007/s11103-006-9080-4. [DOI] [PubMed] [Google Scholar]
- 70.Elling A, et al. Divergent evolution of arrested development in the dauer stage of Caenorhabditis elegans and the infective stage of Heterodera glycines. Genome Biology. 2007;8:R211. doi: 10.1186/gb-2007-8-10-r211. [DOI] [PMC free article] [PubMed] [Google Scholar]
- 71.Jiao Y, et al. Conservation and Divergence of Light-Regulated Genome Expression Patterns during Seedling Development in Rice and Arabidopsis [W] The Plant Cell Online. 2005;17:3239–3256. doi: 10.1105/tpc.105.035840. [DOI] [PMC free article] [PubMed] [Google Scholar]
- 72.Boverhof DR, et al. Comparative toxicogenomic analysis of the hepatotoxic effects of TCDD in Sprague Dawley rats and C57BL/6 mice. Toxicological Sciences. 2006;94:398–416. doi: 10.1093/toxsci/kfl100. [DOI] [PubMed] [Google Scholar]
- 73.Tirosh I, et al. A genetic signature of interspecies variations in gene expression. Nat Genet. 2006;38:830–834. doi: 10.1038/ng1819. [DOI] [PubMed] [Google Scholar]
- 74.Fay J, et al. Population genetic variation in gene expression is associated with phenotypic variation in Saccharomyces cerevisiae. Genome Biology. 2004:5. doi: 10.1186/gb-2004-5-4-r26. [DOI] [PMC free article] [PubMed] [Google Scholar]
- 75.Townsend J, et al. Population genetic variation in genome-wide gene expression. Molecular and Cellular Biology. 2003;20:955–963. doi: 10.1093/molbev/msg106. [DOI] [PubMed] [Google Scholar]
- 76.Aubin-Horth N, et al. Masculinized dominant females in a cooperatively breeding species. Molecular Ecology. 2007;16:1349–1358. doi: 10.1111/j.1365-294X.2007.03249.x. [DOI] [PubMed] [Google Scholar]
- 77.Aubin-Horth N, et al. Alternative life histories shape brain gene expression profiles in males of the same population. Proceedings of the Royal Society B-Biological Sciences. 2005;272:1655–1662. doi: 10.1098/rspb.2005.3125. [DOI] [PMC free article] [PubMed] [Google Scholar]
- 78.Cavalieri D, et al. Whole genome expression analysis of colony morphology in vineyard isolates of Saccharomyces cerevisiae. Yeast. 2001;18:S110–S110. [Google Scholar]
- 79.Cavalieri D, et al. Manifold anomalies in gene expression in a vineyard isolate of Saccharomyces cerevisiae revealed by microarray analysis. Proceedings of the National Academy of Sciences. 2000;97:12369–12374. doi: 10.1073/pnas.210395297. [DOI] [PMC free article] [PubMed] [Google Scholar]
- 80.Cheung VG, et al. Natural variation in human gene expression assessed in lymphoblastoid cells. Nat Genet. 2003;33:422–425. doi: 10.1038/ng1094. [DOI] [PubMed] [Google Scholar]
- 81.Enard W, et al. Intra- and interspecific variation in primate gene expression patterns. SCIENCE. 2002;296:340–343. doi: 10.1126/science.1068996. [DOI] [PubMed] [Google Scholar]
- 82.Grozinger C, et al. Pheromone-mediated gene expression in the honey bee brain. Proceedings of the National Academy of Science of the United States of America. 2003;100:14519–14525. doi: 10.1073/pnas.2335884100. [DOI] [PMC free article] [PubMed] [Google Scholar]
- 83.Lai Z, et al. Natural Variation in Gene Expression Between Wild and Weedy Populations of Helianthus annuus. Genetics. 2008;179:1881–1890. doi: 10.1534/genetics.108.091041. [DOI] [PMC free article] [PubMed] [Google Scholar]
- 84.Llinas M, et al. Comparative whole genome transcriptome analysis of three Plasmodium falciparum strains. NUCLEIC ACIDS RESEARCH. 2006;34:1166–1173. doi: 10.1093/nar/gkj517. [DOI] [PMC free article] [PubMed] [Google Scholar]
- 85.Meiklejohn C, et al. Rapid evolution of male-biased gene expression in Drosophila. Evolution. 2003;100:9894–9899. doi: 10.1073/pnas.1630690100. [DOI] [PMC free article] [PubMed] [Google Scholar]
- 86.Oleksiak M, et al. Natural variation in cardiac metabolism and gene expression in Fundulus heteroclitus. Nature Genetics. 2005;37:67–72. doi: 10.1038/ng1483. [DOI] [PMC free article] [PubMed] [Google Scholar]
- 87.Michalak P, et al. Gene expression polymorphism in Drosophila populations. Molecular Ecology. 2007;16:1179–1189. doi: 10.1111/j.1365-294X.2007.03201.x. [DOI] [PubMed] [Google Scholar]
- 88.Spielman RS, et al. Common genetic variants account for differences in gene expression among ethnic groups. Nature Genetics. 2007;39:226–231. doi: 10.1038/ng1955. [DOI] [PMC free article] [PubMed] [Google Scholar]
- 89.Whitehead A, Crawford D. Variation in tissue-specific gene expression among natural populations. Genome Biology. 2005;6 doi: 10.1186/gb-2005-6-2-r13. [DOI] [PMC free article] [PubMed] [Google Scholar]
- 90.Whitfield C, et al. Gene Expression Profiles in the Brain Predict Behavior in Individual Honey Bees. Science. 2003;302:296–299. doi: 10.1126/science.1086807. [DOI] [PubMed] [Google Scholar]
- 91.Salmi M, et al. Profile and Analysis of Gene Expression Changes during Early Development in Germinating Spores of Ceratopteris richardii. Plant Physiology. 2005 doi: 10.1104/pp.105.062851. [DOI] [PMC free article] [PubMed] [Google Scholar]
- 92.Whitehead A, Crawford D. Variation within and among species in gene expression: raw material for evolution. Molecular Ecology. 2006;15:1197–1211. doi: 10.1111/j.1365-294X.2006.02868.x. [DOI] [PubMed] [Google Scholar]
- 93.Clark T, Townsend J. Quantifying variation in gene expression. Molecular ecology. 2007;16:2613–2616. doi: 10.1111/j.1365-294X.2007.03354.x. [DOI] [PubMed] [Google Scholar]
- 94.Ayroles J, et al. Systems genetics of complex traits in Drosophila melanogaster. Nature Genetics. doi: 10.1038/ng.332. in press. [DOI] [PMC free article] [PubMed] [Google Scholar]
- 95.Griswold C, et al. Hypothesis testing in comparative and experimental studies of function-valued traits. Evolution. 2008;62:1229–1242. doi: 10.1111/j.1558-5646.2008.00340.x. [DOI] [PubMed] [Google Scholar]
- 96.Leng X, Muller H. Classification using functional data analysis for temporal gene expression data. Bioinformatics. 2006;22:68–76. doi: 10.1093/bioinformatics/bti742. [DOI] [PubMed] [Google Scholar]
- 97.Wu R, Lin M. Functional mapping: how to map and study the genetic architecture of dynamic complex traits. Nature reviews. Genetics(Print) 2006;7:229–237. doi: 10.1038/nrg1804. [DOI] [PubMed] [Google Scholar]