

Abstract
Since the inception of global gene expression profiling platforms in the mid‐1990s, there has been a significant increase in publications of differentially expressed genes in the process of epileptogenesis. In particular for mesial temporal lobe epilepsy, the presence of a latency period between the first manifestation of seizures to chronic epilepsy provides the opportunity for therapeutic interventions at the molecular biology level. Using global expression profiling techniques, approximately 2000 genes have been published demonstrating differential expression in mesial temporal epilepsy. The majority of these changes, however, are specific to laboratory or experimental conditions with only 53 genes demonstrating changes in more than two publications. To this end, we review the current status of gene expression profiling in epileptogenesis and suggest standard guidelines to be followed for greater accuracy and reproducibility of results.
Keywords: epileptogenesis, gene expression, hippocampus, serial analysis of gene expression, temporal lobe epilepsy
INTRODUCTION
The understanding of epilepsy as a complex interaction between numerous excitatory and inhibitory neuronal connections influenced at the molecular level rightly brings about focus to global changes in the entire transcriptome in the epileptogenic process. Annotating the individual genomic changes at specific time points delivers only a snapshot of a much larger process. The development of global gene expression profiling platforms has revolutionized molecular biological research, allowing vast amounts of information to be identified, catalogued and measured. Genomic changes are seen in concert giving the potential for a broader understanding of the disease process.
The late 1990s heralded the development of several important technological advances in molecular biological research. DNA microarray and serial analysis of gene expression (SAGE) were introduced allowing comparisons of global gene expression utilizing differing conditions in laboratory experimentation. This has allowed the relatively new field of comparative genomics to flourish 43, 54. With respect to the brain, patterns of gene expression have been reported as early as 1999 with comparative libraries generated between malignant glioma tissue and normal brain for SAGE, and between sleep–wake cycles for microarray 40, 55. From this point there has been an explosion of genomic information with steadily increasing reports generated during development and aging 38, 94, 106, malignant brain processes 37, 101, neurodegenerative disorders 41, 58, behavioral 12, 45 and anatomical studies (18). Studies into epileptogenesis have also expanded since the first global gene expression studies into epilepsy in 2001 29, 42. For this reason we will review the published papers and discuss the usefulness of global transcriptome analyses with regards to epileptogenesis.
EPILEPSY AND EPILEPTOGENESIS
Epilepsy is a disorder of the brain characterized by an enduring predisposition to generate epileptic seizures and by the neurobiological, cognitive, psychological and social consequences of this condition. An epileptic seizure is a transient occurrence of signs and/or symptoms caused by the abnormal excessive or synchronous neuronal activity in the brain (27). It includes seizures occurring in the absence of a recognized cause as well as events occurring in patients with antecedent stable (non‐progressing) central nervous system insults (unprovoked seizures), but excludes seizures occurring in a close temporal relationship with an acute systemic, toxic or metabolic insult, which is expected to be the underlying cause (provoked seizures) (28).
Within the broad classification of epilepsy, mesial temporal lobe epilepsy (MTLE) is the most common location‐related epilepsy. This may be lesional or non‐lesional, with the great majority of non‐lesional MTLE being associated pathologically with hippocampal sclerosis (HS). There remains much debate in the neurological world regarding HS as a cause or consequence of seizures. Pathological evidence has shown the presence of HS in brains of dementia patients without clinical epilepsy 19, 104. In addition, MTLE patients with dual pathology may have HS that is: (i) a non‐specific result of the primary epileptogenic lesion and not in itself epileptogenic; (ii) secondary to the primary epileptogenic lesions but also epileptogenic; or (iii) a primary HS that coexists with another epileptogenic lesions (109). Proponents of the initiating hit theory of epilepsy argue that the progressive nature of MTLE demonstrates HS as a consequence of the seizure process. Typically a variable latent period between the initial precipitating incident and habitual unprovoked seizures is present, followed by a silent period between the first habitual unprovoked seizure and the onset of intractability. This strongly suggests that the pathology is progressive (5). Worsening HS creates a cycle whereby increased seizure severity and frequency lead to further neuropathological changes and hence worsening clinical seizures. Several theories for the cause of HS have been proposed, with the most commonly quoted being febrile convulsions. Other theories include vascular injuries and developmental abnormalities. It is this process of progression to seizures of worsening severity with increasing frequency that is termed epileptogenesis (Figure 1).
Figure 1.
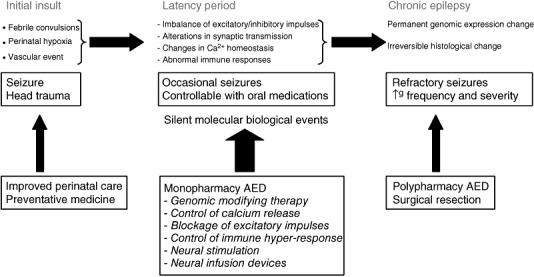
Initial hit theory of epileptogenesis. Abbreviations: AED = anti‐epileptic drug.
HS was first described in 1825 by Bouchet and Cazauvieil (8). It is a pathological diagnosis although advances in neuroimaging through magnetic resonance imaging had allowed the use of radiology as a supporting or diagnostic tool. The pathological diagnosis consists of atrophy of the hippocampal formation with loss of neurones and reactive gliosis in CA1, CA4 and the dentate gyrus. In CA4, there is a loss of polymorphic neurons and pyramidal neurons. CA3 shows some neuronal loss, but CA1 always shows significant neuronal loss that may be very severe. There is a variable degree of gliosis seen in these subregions and occasional vessel sclerosis has been described. Loss of granule cells in the dentate gyrus is variable, as is gliosis. Granule cell distribution is often disrupted and various patterns including dual lamination or dispersion are described. Sprouting of the mossy fiber system in the dentate gyrus is apparent with Timm's stain with many believing that this sprouting leads to aberrant reinnervation resulting in the hyperirritable lesion that constitutes the epileptogenic hippocampus. Within all these changes, CA2 is relatively spared (68) (Figure 2).
Figure 2.
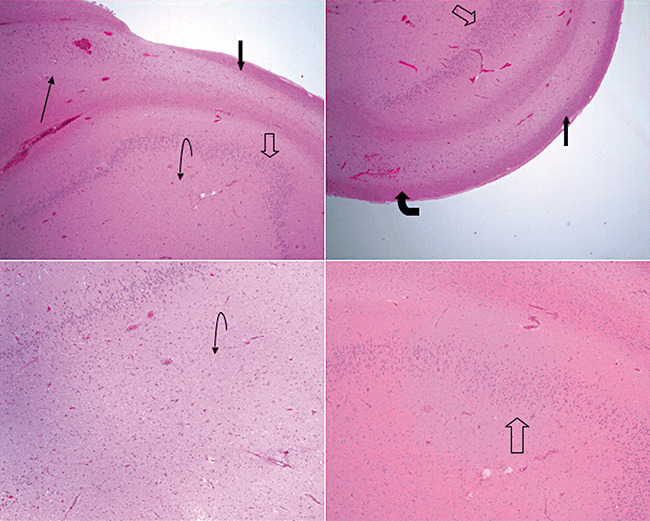
(L‐top) Low power (2.5×) view demonstrating normal subiculum into CA1; (R‐top) Low power (2.5×) view demonstrating CA1 sclerosis and sparing of CA2; (L‐bottom) Low power (2.5×) view demonstrating neuronal loss in CA3/4; (R‐bottom) Medium power (5×) view with dispersion of dentate gyrus. (arrow: subiculum, block arrow: CA1, curved block arrow: CA2, curved arrow: CA3/4, arrow outline: dentate gyrus).
Treatment of non‐lesional MTLE continues to be a challenge for the epileptologist. Monodrug therapy is initially implemented however this may progress quickly to multidrug therapy because of continued poor seizure control. Targeted surgical excision of the epileptogenic zone in carefully selected medically refractory patients has been shown to improve outcome with 44% to 72% of patients remaining seizure free compared with 4.3% to 12% of patients on further trials of anti‐epileptic medications 6, 108, 111. Despite these figures, there remains a large proportion of epileptic patients who continue to suffer unpredictable recurrent seizures. Understanding the molecular biological changes underlying the process of epileptogenesis is crucial to the development of newer, more effective treatment regimes.
GLOBAL EXPRESSION PROFILING PLATFORMS
SAGE and DNA microarray generate large libraries of mRNA sequences enabling researchers to generate differential gene expression lists in disease states by statistical comparison of transcript frequencies between two or more conditions. Both originally described in 1995, the platforms have been extensively used in the study of human disease with millions of tags analyzed and compared with easily accessible online tag libraries. Massively parallel signature sequencing (MPSS) was developed in 2000 as an alternative quantitative open‐ended platform and has risen in popularity as a research tool. A brief description of each platform follows and comparison of their relative advantages or disadvantages can be seen in Table 1.
Table 1.
Global platforms comparison. Abbreviations: MA = microarray; MPSS = massively parallel signature sequencing; SAGE = serial analysis of gene expression.
| SAGE | MA | MPSS | |
|---|---|---|---|
| Global expression profiling platforms | Yes | Yes | Yes |
| Prior knowledge of genome required | No | Yes | No |
| Specificity | 80% | Near 100% | 95% |
| (14 nucleotide sequence) | (?Selection bias) | (17 nucleotide sequence) | |
| Sequencing error | 1% | <1% | 7% |
| Unique transcipts/genes | Yes | No | No |
| Quantification | Yes | Yes | Yes |
| Dataset size | 20–60 000 tags | Preselected tags | >1 000 000 sequences |
| Low abundance genes | Not sequenced | Sequenced | Sequenced |
| Starting mRNA concentration | High | High | DNA megacloning |
| (2.5–5 μg) | |||
| Cost | +++ | + | + |
| Online comparative libraries | Available | Available | Available |
SAGE
SAGE as originally described is based on two basic assumptions: (i) that a short nucleotide sequence tag (9–10 base pairs) contains sufficient information to uniquely identify a given transcript; and (ii) concatenation or linking of the so‐identified short sequence tags allows the efficient analysis of transcripts in a serial manner by the sequencing of multiple tags within a single clone (103).
Practically, the genome of interest is interrogated from a defined four‐base pair position, classically the NlaIII site. An anchoring enzyme binds to this defined complementary position and acquires adjacent short mRNA sequences (9–10 base pairs) that, based on the first assumption earlier, allows specific mapping of these transcripts to genomic libraries. Proportionate amplification of different transcripts gives a realistic quantification of gene expression for the particular experiment or disease condition 67, 103.
SAGE has been utilized extensively in the study of human disease. In the first 5 years since its inception, close to five million tags had been analyzed using this method (102). It has been used in cancer, cardiovascular and immunological studies 74, 76, 77. Large online SAGE libraries are now freely available to the public, with access to raw SAGE sequence data, precomputed tag extractions and several modest analysis tools. SAGEmap currently contains over two million tags from 47 SAGE libraries and is currently available at http://www.ncbi.nlm.nih.gov/sage (56).
In terms of data analysis, SAGE is extremely efficient with a complete genome investigation allowing both whole activated and inactivated pools of gene analysis in a quantitative and qualitative manner. It does not rely on previously identified sequences or genes, thus allowing analysis and identification of novel previously unidentified genes/express sequence tags (ESTs) 20, 66, 67, 103.
Several possible key pitfalls have been identified in the SAGE technique. A high amount of starting mRNA is required that is often prohibitive and not feasible, especially in difficult to obtain human specimens or complex experimental procedures. In addition, the cost of SAGE is high and may preclude repeat experimentation to verify collected data. Although SAGE studies the entire genome, the use of a four‐base pair anchoring enzyme relies on the fact that the majority of mRNA sequences contain an anchoring site on average every 256 base pair stretch (44 = 256). The reality is a small proportion of mRNA will not include this anchoring site, leading to a loss of some small fraction of mRNA from the analysis that is extremely difficult to quantify. Clearly the use of a 10‐base pair sequence to map gene assignment may cause issues in terms of specificity and sensitivity. It is not uncommon for multiple genes to share the same tag or for a single gene to be mapped by multiple tags.
There have been several modifications to the original SAGE technique aimed at addressing the potential pitfalls. MicroSAGE and SAGE‐Lite were developed to allow lower amounts of starting mRNA to be used allow significantly smaller amounts of human or animal specimens to be examined 76, 78, whereas LongSAGE and Robust‐LongSAGE were developed to improve tag or gene mapping by generating tags of 21 base pairs as opposed to 14 35, 85, 105.
Microarray
Microarrays are ordered samples of DNA with each sample representing a particular gene. These arrays are then assayed for changes in gene expression following experimental treatment or in different disease states. It allows simultaneous monitoring of thousands of genes, thus providing a functional aspect to sequence information in a given sample (23). There are several types of microarray technologies currently in use with studies using oligonucleotide microarray technology, the most common for high‐throughput quantitative studies of RNA expression (47). In this instance, RNA extracted from the material of interest is reverse transcribed to complementary DNA and incubated with a mixture of fluorescently labeled markers at set conditions on a microarray chip containing a predetermined set of genes. Quantification is then performed by computerized measurements of fluorescent intensities.
It was first described by Schena et al in 1995 who purported it to be a method for quantitative measurement of expressed genes (88). Schena et al utilized the EST database (7) freely released from the National Center for Biotechnology Information that at the time contained a total of 322 225 entries, including 2 555 645 from the human genome. As of June 2, 2006 this count had increased to 36 750 628 total entries including 7 741 746 from the human genome and 4 719 380 from the mouse genome.
Microarray is a relatively simple procedure to perform and is becoming a standard technology for research laboratories worldwide. They allow testing of thousands of genes simultaneously with quantification of differential expressions at a reasonable cost when compared with SAGE. However, microarray technology relies on prior knowledge of the genes to be identified with the possibility of selection bias during creation of the cDNA array. As a result, novel genes are not able to be identified. Second, the amount of starting material required was also prohibitively high in the initial stages. This has largely been addressed with a two‐stage hybridization process or global RNA amplification prior to running the array 73, 100.
MPSS
MPSS was developed by Brenner et al in 2000 to address the variabilities, cost and scale of effort required by other high‐throughput, genomic profiling methods. It utilizes the technology of DNA megacloning in combination with non‐gel‐based signature fluorescence sequencing to generate very large numbers of short read‐length sequences (9). This process of megacloning allows the in vitro cloning of fragments of cDNA onto microbeads as opposed to biological hosts. Millions of cDNA fragments can be cloned by hybridization of uniquely tagged molecules to microbeads carrying 106 complementary sequences to each oligonucleotide primer used (10).
MPSS has been used to create large databases of gene expression in adult human tissues (50). These have proved complementary to other database sets published using Affymetrix chip technology 89, 92, 93. It has been used to document the transcriptome in human disease states including oncology 49, 61, renal disease (30) and neuroembryology (11).
Similar to SAGE, massively parallel signature processing does not require previous knowledge of any sequence to allow analysis. The only requirement is that the microbead library is constructed large enough to contain nearly all sequences from the library to be compared against. It is time efficient with simultaneous screening of all genes and counts virtually all mRNA molecules. The libraries created are more specific as MPSS generates a 17‐nucleotide signature length (95% unique) as compared with a 14‐nucleotide signature length (80% unique) in a conventional SAGE. MPSS also allows the creation of an extremely large data set of signature sequences (>1 000 000) by providing a depth of analysis that allows low abundance genes to be accurately quantified, something that SAGE has been criticized for missing with datasets being comprised of only 20 000 to 60 000 sequenced mRNAs 9, 83.
Quantification of sequences is possible as MPSS generates a digital output. Differential expression comparisons can be formed with ease between samples with detection levels for statistical significance possible even with low abundance genes expressed at 30 to 40 copies per million. In contrast, hybridization techniques require replication of experiments, high abundance genes and large differences to provide adequate quantification (83).
Reproducibility of the levels of gene expression is generally very good for signatures detected in all samples. However, cases with a zero signature count have been noted to demonstrate a significantly higher error rate than those with non‐zero figures. It remains unknown as to whether this represents a true measurement or the absence of measurement. In cases with conflicting values (ie, one MPSS run claiming a value and the other claiming zero), the trends obtained by ignoring the zero measurements within runs of the same sample, are shown statistically to be closer to the ideal unbiased comparisons between two samples. As such, taking the maximum number of two runs has been suggested 83, 91.
ANIMAL MODELS OF EPILEPTOGENESIS
Seizure induction and epileptogenesis have been modeled extensively in animals. Epileptogenic substances such as alumina gel, penicillin, bicuculline, kainic acid, tetanus toxin, pentylenetetrazol and pilocarpine were directly injected to induce a primary focus of epileptogenic activity in the immediate area of placement with corresponding marked neuronal loss and gliosis, a process termed chemical kindling 60, 70. This was more often than not accompanied by behavioral seizures including status and subsequent spontaneous seizures, and is also described as the “status epilepticus models.” Other methods include the electrical kindling models first described by Goddard et al in 1967, whereby repeated stimulation of selected regions of the mesial temporal lobe structures result in behavioral seizures and the classical neuropathological changes seen in the human MTLE. The electrical kindling models also demonstrate seizures with progressive increase in frequency and severity following prolonged stimulation. A chronic increase in seizure susceptibility is seen; however, in contrast to the status epilepticus models, spontaneous seizures are unusual and not expected.
Status epilepticus models
Status epilepticus models of epileptogenesis are widely used as a model of acute epileptogenesis following the application of chemical kindling. It becomes a useful model of chronic epileptogenesis with the appearance of spontaneous seizures at a time point distant to the initial convulsive event. This model demonstrates the classical progression of human temporal lobe epilepsy with an initial convulsive event leading to seizures and status epilepticus before a latency period of varying length and appearance spontaneous seizures following this. Advocates of this model point to the presence of a latency period as the period of opportunity, whereby interruption of the epileptogenic process during this time may bring about a stop in the progression of spontaneous seizures. The difficulty lies in measuring the duration of each animal's individual latency period and hence the optimal time point for intervention and study. The duration of latency is known to be related to the convulsant dose with higher doses yielding shorter onset latencies (39). Current figures suggest a mean onset latency of around 40 days; however, shorter periods have been described (32). As such, estimates of latency periods used in research studies vary from 8 to 50 days.
Mathern et al performed the only electrophysiological study looking into the time course of hippocampal interictal spike frequency after intrahippocampal kainite injection and correlated this with histopathological changes. Four stages were classified from this with: (i) the acute phase relating to the first 10 days after kainite‐induced status epilepticus; (ii) the active phase from days 10 to 30; (iii) the latent phase relating to the latency period (days 30 to 90); and (iv) the chronic phase with the development of chronic hippocampal seizures (after 90 days). Interictal spike frequency was noted to drop during the latent phase and increase again during the chronic stage in concert with the development of behavioral seizures, neuronal loss and mossy fiber sprouting. (69)
Status epilepticus models also demonstrate a varying clinical response of the animal subjects to differing doses of convulsive agents. A high mortality rate is not unexpected and severe neuronal loss is often encountered histologically. Initial seizures are unpredictable in their duration and severity and may be difficult to control. Acute antiseizure medications such as benzodiazepines are often needed to bring about a cessation of the status epilepticus state. It is clear, however, that the onset of spontaneous seizures is directly related to the duration of the status epilepticus state and at least 30 minutes duration of initial status epilepticus is required for manifesting an epileptogenic process (53).
Electrical kindling models
Kindling as reported by Goddard (34) refers to the repeated administration of subconvulsive electrical stimuli resulting in progressive development of seizure activity traditionally performed using daily stimulations. The term is therefore quite specific to low level electrical stimulation. Numerous alterations in stimulating paradigms have been used since Goddard's initial description of kindling and it is now well established as a chronic animal model of MTLE. It is accepted as a functional model of epilepsy where altered neuronal response develops in the absence of the gross morphological damage seen in many other epilepsy models.
The discovery of electrical kindling placed the process of epileptogenesis under greater control by the experimenter. The initial electrical kindling current stimulus was applied to a defined area and was, by definition, subconvulsive 33, 34. With repeated application of the electrical stimulus once or twice a day for only seconds at a time, electrical afterdischarges were observed to appear and gradually lengthen, and recordable after‐discharges were observed to broaden in origin from adjacent brain regions to more distant regions and eventually the opposite hemisphere. In addition to this electrical progression, a behavioral progression of seizure activity occurred commencing with focal seizure activity typically manifested as initial facial clonus contralateral to the side of stimulation after a short delay. Progression through a stepwise series of more overt and eventually generalized seizures follows. This behavioral progression has been assigned a grading system, from grade 1 to 5 by Racine (81) in his study of amygdala kindling in rats. An animal may be regarded as fully kindled after manifesting a number of grade 5 seizures.
There are many advantages of the kindling model for epilepsy research. Development of chronic epileptogenesis by a precise focal activation of the target brain site is readily achieved with no mortality and very little morbidity. The pattern of seizure propagation and generalization is readily monitored and interictal, ictal and postictal periods are easily manipulated. Furthermore, the absence of the classical neuropathological changes and placement of the stimulating electrode at an area distant from the anatomical area of interest (eg, amygdala kindling for investigation of hippocampal pathology) ensures genomic expression studies are as unadulterated as possible.
Kindling experiments, however, are relatively labor‐intensive, requiring a two‐stage electrode implantation–electrical kindling process usually spaced over 1 to 2 weeks. Stimulation paradigms are also spaced over minutes to days and may take months to reach the fully kindled state. The ideal animal model for human temporal lobe epilepsy would consist of similar pathology, a latent period after the initial insult appropriate for the species, a state of chronic hyperexcitability and the emergence of spontaneous seizures after a latent period (107). The absence of a true latent period in electrical kindling is in opposition to this. Latency is seen from the first kindling stimulation to the eventual appearance of seizures; however, additional insults in the form of further electrical stimuli are being provided leading up to and merging with the evoked seizures. Electrical kindling also does not produce spontaneous seizures, unless prolonged kindling is performed. This is coined the “over‐kindling” model (79). In this model continued electrical stimulation is given beyond the standard stage‐5 criterion of the fully kindled state. The number of additional stimulations is extremely variable with recent reports suggesting at least an additional 90 to 100 kindled seizures required in rats for recurrent spontaneous seizures to occur 71, 87.
Neuropathological changes in animal models
Similar to human changes there may be considerable variability in neuropathological changes. Status epilepticus models classically demonstrate concordant human histological changes of severe neuronal loss, granule cell dispersion, remodeling of mossy fiber structures and neurogenesis. The degree of neuronal loss is related to the concentration of inciting agent and duration of status epilepticus. Neurogenesis has been reported without corresponding cell death whereas granule cell dispersion may occur without evidence of neurogenesis 72, 98.
Electrical kindling models typically do not demonstrate evidence of neuronal loss, the advantage of which is purported of enabling focused study into the effects of seizures alone without the changes associated with cell death.
GLOBAL GENE EXPRESSION AND EPILEPSY
An increasing number of laboratory and clinical studies involving MTLE have been published since the inception of global expression profiling platforms. Prior to this the focus of each laboratory was limited to one or a few genes selected by hypotheses generated from the available literature or laboratory experience, using conventional molecular biological techniques. These global expression studies are summarized in Table 2.
Table 2.
Papers. Abbreviations: 2DE = two‐dimensional electrophoresis; MTLE = mesial temporal lobe epilepsy; RT‐PCR = real‐time polymerase chain reaction; SAGE = serial analysis of gene expression.
| Author | Year | Species | Model | Platform | Differential genes | Time‐points | |
|---|---|---|---|---|---|---|---|
| Sandberg et al | 2000 | Mouse | Pentylenetetrazole kindling | Microarray | 12 or 49 out of 13 069 | 1 h | |
| Liang et al | 2001 | Mouse | Rapid amygdala kindling | Differential display | 26 out of 30 000 bands | 0.5 h, 1 day | |
| RT‐PCR | 1 week, 1 month | ||||||
| Hendriksen et al | 2001 | Rat | Angular bundle kindling | SAGE | 79 out of ∼6000 | 8 days | |
| Potschka et al | 2002 | Rat | Amygdala kindling | MPSS | 264 out of 5696 | 2 h | |
| Tang et al | 2002 | Rat | Kainate kindling | Microarray | 276 out of 3869 | 1 day | |
| Elliott et al | 2003 | Rat | Pilocarpine Kindling | Microarray | 129 out of 8000 | 14 days | |
| Becker et al | 2003 | Rat | Pilocarpine Kindling | Microarray | ∼400 or 700 out of 8799 | 3 days | |
| ∼50 or 400 out of 8799* | 14 days | ||||||
| Lukasiuk et al | 2003 | Rat | Amygdala kindling | Microarray | 282 out of 5000 | 1, 4 and 14 days | |
| Arai et al | 2003 | Rat | Ihara epileptic rat | SAGE | 21 out of ∼3800 | Chronic | |
| Hunsberger et al | 2005 | Rat | Kainate kindling | Microarray | 99 out of 1561 | 24 h | |
| Wilson et al | 2005 | Rat | Kainate kindling | Microarray | 9 out of 23 (neuropeptide probes only) | 1, 6, 24, 72 and 240 h | |
| Gorter et al | 2006 | Rat | Dentate gyrus kindling | Microarray | CA3 | Entorhinal | |
| 2178 | 2548 | 24 h | |||||
| 1400 | 2240 | 1 week | |||||
| 1236 | 682 | 3–4 months | |||||
| (out of 10 179) | |||||||
| Jamali et al | 2006 | Human | MTLE | Microarray | 6 out of 2000 | Chronic | |
| Arion et al | 2006 | Human | MTLE | Microarray | 70 out of 14 500 | Chronic | |
| Ozbas‐Gerceker et al | 2006 | Human | MTLE | SAGE | 146 out of ∼9500 | Chronic | |
| Greene et al | 2007 | Rat | Pilocarpine Kindling | 2DE | Heat shock protein B1 | 2 days | |
| Liu et al | 2008 | Rat | Pilocarpine Kindling | 2DE | 41 unique proteins | 12, 72 h | |
| Eun et al | 2008 | Human | MTLE | 2DE | Mitochondrial SOD | Chronic | |
Gene expression in epileptogenesis
Microarray
The predominant profiling platform utilized in global expression profiling of epilepsy and epileptogenesis has been microarray. A Pubmed search utilizing the terms “microarray” and “epilepsy” or “seizures” revealed 49 reports from which there were 10 articles publishing results of global expression profiling in models of MTLE. Bibliographic review of these articles revealed an additional two articles giving a total of 12 reports.
The majority of microarray papers published with regard to epileptogenesis involve chemical kindling. These differ in terms of model used (animal type, epileptogenic substance), time points and anatomical region investigated. Sandberg et al in 2000 demonstrated mouse strain‐specific differences in response to pentylenetetrazole kindling; however, this study focused on the changes invoked early in the response to a single seizure and gives limited insight into the actual process of epileptogenesis.
Of more relevance are the three studies by Elliott et al in 2003, Becker et al and Tang et al, which in addition to characterizing genomic changes in response to chemical kindling (pilocarpine: Elliott, Becker; kainic acid: Tang), directly compared the genomic expression changes with certain physiological and disease states. In this manner, several assertions were made. Elliott et al suggested support for the hypotheses of parallels existing between gene expression underlying development and epileptogenic plasticity during the latency period following comparisons with the adult and developing rats 4, 24, 95.
Direct comparison of the genomic responses of brain in response to ischemic stroke, intracerebral hemorrhage, kainic acid induced seizures, hypoglycemia and hypoxia was made by Tang et al in 2002. Significantly, marked overlap of regulated genes was found throughout all disease states. In particular, all genes induced by kainic acid were also induced by ischaemia, hemorrhage or hypoglycemia. This suggests a multifactorial mechanism of injury for kainic acid induced seizures that mimics or utilizes the same pathways as those associated with ischaemia, hypoglycemia or hemorrhage (95). Whether seizures themselves primarily induce these genomic changes or secondarily act through periods of ischemic or hypoglycemic during seizure episodes remain unclear. What is clear, however, is the similarities in histological changes seen in these conditions with marked neuronal loss, fibrillary gliosis with vacuolation and enlarged reactive astrocytes variously reported following severe hypoglycemia and ischemia, with or without associated status epilepticus 1, 13, 51, 52.
Becker et al correlated temporal changes of genes associated with cellular stress and injury at 3‐day post‐status epilepticus, genes associated with cytoskeletal and synaptic reorganization at 14‐day post‐status epilepticus, and genes involved in neurotransmission pathways at the chronic epilepsy stage. This study also provided the first comparison with human hippocampal specimens with eighteen genes differentially expressed in both the chronic stage of pilocarpine induced epilepsy and medically refractory MTLE (4).
Other experimental microarray studies investigated changes of growth factor signaling genes, transcription factors, angiogenesis signaling molecules, neuropeptides, neuronal plasticity and signal transduction using custom‐made probe sets at varying time points. These are summarized in Table 2, 44, 63, 110.
The electrical kindling model was utilized by Lukasiuk et al to investigate the gene expression changes during specific phases of epileptogenesis with the hypothesis that remodeling of neuronal circuits underlying epilepsy is associated with altered gene expression during epileptogenesis. RNA was extracted from the hippocampus and temporal lobe at 1, 4 and 14 days following electrical kindling and hybridized with cDNA arrays containing approximately 5000 rat gene probes. There were 87 differentially expressed genes within the hippocampus with 37 genes regulated at 1 day, 12 at 4 days and 14 at 14 days. There was an overlap of 13 genes with the temporal lobe that demonstrated 208 differentially expressed genes in a similar time distribution as the hippocampus genes. Functional annotation of the regulated genes revealed genes involved in neuronal plasticity, gliosis, organization of the cytoskeleton or extracellular matrix, cell adhesion, signal transduction, regulation of cell cycle and metabolism (63).
SAGE
A literature search using the words “serial analysis of gene expression” and “epilepsy” and/or “seizures” produced four articles. Two articles were published from the same laboratory with one expanding on the initial report, whereas the other two studies involved human MTLE and the use of a genetically modified epileptic rat, the Ihara rat.
There is only one published SAGE report using the rat electrical kindling model of mesial temporal lobe. Unlike most electrical kindling models, marked neuronal cell loss and gliosis is seen histologically in the electrical kindling model utilized by Hendriksen et al with a latent period of between 1 and 2 weeks following electrical kindling of the angular bundle and the appearance of spontaneous seizures. As such, hippocampal harvest was performed 8 days after the final electrical stimulation, prior to the commencement of spontaneous seizures and during the process of epileptogenesis. Over 10 000 tags were analyzed in both stimulated and control groups resulting in SAGE libraries containing 5053 and 5919 different unique tags respectively. There were 92 differentially expressed genes, predominantly associated with ribosomal proteins, protein processing and axonal growth and glial proliferation (42).
SAGE was also performed on hippocampi of the Ihara epileptic rat (IER). The IER is an animal model of MTLE that demonstrates progressive limbic seizures, eventually resulting in spontaneous generalized tonic‐clonic seizures at 5 to 6 months of age. SAGE was performed on hippocampal tissue taken at 2 months of age and compared with the Wister rat. Over 7000 tags were analyzed with creation of a SAGE library for each group consisting of 2492 and 2141 genes, respectively. Eighty‐one differentially expressed genes were identified, with genes associated with neurotransmission and intercellular component downregulated, and genes associated with protein synthesis, metabolism, membrane transport, the cytoskeleton and ion‐channels upregulated (2).
Our laboratory has performed SAGE on adult male C57/BL6 mice following rapid electrical kindling of the amygdala. This model of MTLE is useful in allowing assessment of the effect of seizures during epileptogenesis without the confounding effects of neuronal loss and cell death (90). RNA was extracted from hippocampi taken 3 h following the completion of kindling with around 28 000 tags analyzed in control and stimulated groups. In the control group, 13 213 unique tags were identified whereas 12 302 unique tags were identified in the stimulated group. There were 55 differentially expressed genes when comparing between the groups with functional classification denoting immune response, cellular metabolism, axonal growth and regeneration, signal transduction, ion transport, synaptic and neurotransmission and genes of unknown identity or function predominant (Wang et al, in preparation).
MPSS
There has been a single published report using MPSS for gene expression studies during epileptogenesis. Potschka et al utilized the rat kindling model of epileptogenesis to characterize the genomic changes using MPSS. Seven thousand and four signatures with a minimal occurrence of two clones in each run were analyzed resulting in annotation of 5696 identified genes. Two hundred sixty‐four differentially expressed genes were identified with 128 upregulated and 136 downregulated ones. The immediate early gene Homer 1A was most strongly induced at 2 h. Identification of this gene fueled further research into the possibilities of Homer 1A being an intrinsic anti‐epileptogenic and anticonvulsant gene upregulated as a protective measure during epileptogenesis (80).
HUMAN STUDIES
There remains a relative dearth of global gene expression studies involving human specimens. This is somewhat surprising given that mesial temporal lobectomy, hippocampectomy and amygdalectomy is a well‐accepted treatment option for medically refractory MTLE in carefully selected cases giving a readily available source of hippocampal specimens (96). Four studies have been reported utilizing microarray (3) and SAGE (1) of which only three dealt with MTLE patients.
Jamali et al analyzed the entorhinal cortex from the hippocampus of brains removed as a surgical treatment consisting of a standard anterior temporal lobectomy whereas Özbas‐GerÇeker et al did not differentiate between hippocampal subregions. Both studies attempted to find control tissue in the form of autopsy hippocampal specimens; however, this obviously posed a significant problem in terms of reproducibility of “controls” not to mention the ethical dilemma. In an attempt to factor in a bias related to long‐term exposure to anti‐epileptic medications, Jamali et al also compared samples from autologous adjacent lateral temporal cortex that had been subjected to the same environment as the epileptic tissue.
Comparison of the entorhinal cortex with non‐epileptic lateral temporal lobe revealed 16 regulated genes of which 10 were upregulated and six were downregulated. This study suggested dysregulation of the neurotransmission and complement systems within the entorhinal cortex as another pathway affected in the process of epileptogenesis (46). On the other hand, the study by Özbas‐GerÇeker et al revealed 143 differentially expressed genes that matched functionally to genes associated with basic metabolism, transcription regulation, protein synthesis and degradation, signal transduction, structural proteins, regeneration and synaptic plasticity and genes of unknown identity or function (74).
Neither study attempted to perform a comparative approach using animal models with their human tissue that would add validity to any prior or future reports into this topic. On the other hand, the study by Becker et al in 2003 demonstrated complimentary results between rat and human specimens with 18 genes regulated in the chronic stage of the rat status epilepticus model showing corresponding expression patterns in hippocampal subfields of patients with pharmacoresistant MTLE (4).
PROTEOMIC STUDIES
Proteomics is a technique that enables one to find proteins changed by the cells response to internal states, external stimulations or developmental cortex. The technique of the two‐dimensional electrophoresis (2DE) allows global profiling of the proteomic changes in different disease states or conditions. Two studies into chemically induced epilepsy (pilocarpine) have investigated the proteomic profile following epileptogenesis in the whole hippocampi alone or in conjunction with the forebrain in rats. These suggested upregulation of pathogenic, neuroprotective and neurogenic responses with validation performed using Western blotting and immunohistochemistry 36, 59.
A single study by Eun et al (25) attempted to analyze human temporal lobe specimens in patients with MTLE undergoing surgical resection by performing 2DE and Western blotting of the selected proteins. Control specimens were obtained from lateral temporal cortices of patients undergoing temporal lobe operations for tumors in the absence of seizures. This study reported significant changes in nine proteins with particular emphasis on proteins related to oxidative stresses; it also highlights the shortcomings in performing comparative studies in humans with control specimens coming from a variety of different diseases such as glioblastoma multiforme (7), sphenoid wing meningiomas (3) and malignant lymphomas (2).
SUPPORTIVE OR CONFLICTIVE
The advent of global expression profiling technology has led to an ever increasing amount of genomic information available. To the end of 2006, there are over 1100 published reports on microarray studies involving the brain and brain disorders, with nearly 100 SAGE studies of the same. For epilepsy studies the figures reveal 32 microarray and four SAGE studies (Figure 3).
Figure 3.
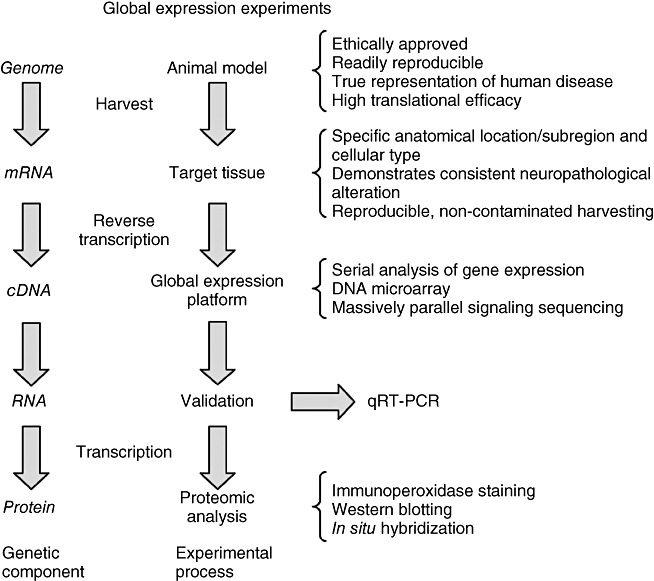
Global expression profiling experiments. Abbreviations: qRT‐PCR = quantitative real‐time polymerase chain reaction.
Yet for all the additional knowledge that has been acquired, the outcomes of epilepsy treatment, particularly MTLE, remain in the main stagnant. There is as yet no active intervention to prevent progression of epilepsy either from the “initial insult” to the “latency period,” or from the latency period to chronic epilepsy. The question follows then: what is the benefit of large‐scale gene expression profiling? Is the accumulation of knowledge of benefit to the treating epileptologist or does it create more confusion in the treatment of this already complex condition?
The inherent problems with analyzing and applying data generated from global expression profiling stems from the obvious difference in epilepsy models, the profiling platform used, animal type and laboratory environment. Care must be taken in comparing genomic profiles generated from differing epilepsy models. Genomic reactions are clearly different between different species of the same animal (86). These differences must be accentuated even more when comparing the different profiles in mice, rats and humans. Status epilepticus models of epileptogenesis possess the advantage of a clear‐cut progression from initial insult to chronic epilepsy in contrast to electrical kindling where a predominantly time‐dependent protocol is usually administered. The rapid electrical amygdala kindling model utilized in our laboratory allowed the effects of seizures in isolation to be investigated without the confounding effects of neuronal loss. In contrast, status epilepticus models of epileptogenesis demonstrate marked neuropathological changes and may manifest widespread systemic effects. The use of benzodiazepines to halt prolonged severe status epilepticus in these models may also adversely alter the transcriptome.
Tang's comparisons between kainic acid‐induced seizures, hypoxia, hypoglycemia and hemorrhage suggest that the kainic acid‐induced changes utilize the same pathological pathways as the other three conditions (95). Indeed there are clear interrelations between all such conditions with prolonged seizures resulting in metabolic acidosis and an environment of relative hypoxia and hypoglycemia, and prolonged and severe hypoglycemia resulting in seizures in the generalized tonic‐clonic form. The eventual histopathological outcome from these events culminates in varying degrees of neuronal loss, gliosis and even necrosis. If this is the case, it is difficult to proclaim that the genetic expression changes are actually specific to the process of epileptogenesis. Another study reported in abstract form (21) and cited in Lukasiuk et al's review revealed distinct differences in gene expression between the kainic acid and pilocarpine models of epileptogenesis, despite being studied in as exacting an environment of the same laboratory.
The pathology of HS deserves special mention at this point. It remains a point of controversy as to whether HS is the underlying cause, or end result of the clinical syndrome of MTLE. As a cause, the proposed theories underlying HS include childhood febrile convulsions, perinatal hypoxic events or vascular accidents, whereas as an end result it is suggested repeated seizures progressively inflict end‐organ damage, particularly in the susceptible areas of the hippocampus described earlier. In a molecular biological sense, a causative action would allow quantification of gene expression changes of each cell type whereas as an outcome, genomic profiling would be representative of changes in cell population.
Confounding the arguments are the documented cases of normal hippocampal size and histology on positively electrophysiologically localized epileptogenic foci excised as a curative procedure (15) as well as autopsy specimens demonstrating histological changes consistent with HS in the absence of clinical seizures (48). The unique cerebral responses in different individuals must be kept in mind in all laboratory and translational research studies.
The number of published differentially expressed genes during epileptogenesis is fast approaching 2000. On review of the available data from these publications there is minimal conformity between the genes described. Lukasiuk et al has produced a list of common differentially expressed genes involving models of epileptogenesis, including traumatic brain injury studies (62). From the near 2000 genes, only a small number (53) are noted to be differentially expressed in more than one study. However, if the gene profiles of traumatic brain injury studies are filtered out, only 38 genes remain differentially expressed across studies. In addition, a proportion of these common genes appear to be differentially expressed in conflicting directions.
In order to further assess the consistency of altered gene expression across the studies we annotated the list of commonality differentially expressed genes to include studies published to the end of 2006 as well as our currently unpublished SAGE data. Comparisons were performed using all available published lists as well as accessing complete gene lists made available through online downloads. Differences in epilepsy models and global expression profiling platforms were also recorded. There were 72 genes reported to be regulated during epileptogenesis in two or more studies. Thirty‐nine genes demonstrated a consistent direction of change with 15 showing conflicting results. The direction of regulation could not be ascertained from the available literature in 20 genes. No genes were reported regulated in more than five papers with the majority (50) only regulated in two papers. The two genes consistently regulated in five reports were the rather ubiquitous glial fibrillary acidic protein and the S100‐related protein (Table 3).
Table 3.
Genes in more than one study. Abbreviations: IER = Ihara epileptic rat; MA = microarray; SAGE = serial analysis of gene expression.
| Gene name | Abbreviation | Reports | Platform | Conflicting | Epilepsy model | ||||
|---|---|---|---|---|---|---|---|---|---|
| SAGE | MA | Electrical kindling | Chemical kindling | Human | IER | ||||
| 14‐3‐3 protein gamma | 2 | 1 | 1 | No | 1 | 1 | 0 | 0 | |
| Actin related protein 2/3 complex | Arpc | 3 | 1 | 2 | No | 1 | 2 | 0 | 0 |
| α‐tubulin | 2 | 1 | 1 | No | 1 | 1 | 0 | 0 | |
| Brain derived neurotrophic factor | BDNF | 4 | 1 | 3 | No | 2 | 2 | 0 | 0 |
| Calponin 3, acidic | Cnn3 | 2 | 1 | 1 | No | 1 | 1 | 0 | 0 |
| Cathepsin D | Ctsd | 2 | 1 | 1 | No | 1 | 1 | 0 | 0 |
| Cathepsin S | Ctss | 2 | 1 | 1 | No | 1 | 1 | 0 | 0 |
| Cholecystokinin | CCK | 3 | 1 | 2 | No | 1 | 0 | 2 | 0 |
| Chromogranin B | Chgb | 2 | 1 | 1 | No | 1 | 1 | 0 | 0 |
| Clone BB.1.4.1 | 2 | 1 | 1 | No | 1 | 1 | 0 | 0 | |
| Complexin 2 | Cplx2 | 2 | 2 | 0 | No | 1 | 0 | 1 | 0 |
| Cystatin C | Cst3 | 4 | 2 | 2 | No | 2 | 2 | 0 | 0 |
| Ectodermal neural cortex | Enc1 | 2 | 1 | 1 | No | 0 | 0 | 2 | 0 |
| Elongation factor‐1α | Efa1 | 2 | 1 | 1 | No | 1 | 1 | 0 | 0 |
| Epithelin 1 and 2 | 2 | 1 | 1 | No | 1 | 1 | 0 | 0 | |
| ESTs, Hs to MBD3 | 2 | 1 | 1 | No | 1 | 1 | 0 | 0 | |
| Ferritin heavy chain | Fth | 3 | 2 | 1 | No | 2 | 1 | 0 | 0 |
| Glial fibrillary acidic protein | GFAP | 5 | 2 | 3 | No | 1 | 3 | 1 | 0 |
| Granulin | Grn | 2 | 1 | 1 | No | 1 | 1 | 0 | 0 |
| Growth factor receptor bound protein 2 | Grb2 | 2 | 0 | 2 | No | 0 | 1 | 1 | 0 |
| Heat shock protein 27 | Hsp27 | 2 | 0 | 2 | No | 0 | 2 | 0 | 0 |
| Heat shock protein 70 | Hsp70 | 4 | 1 | 3 | No | 1 | 2 | 1 | 0 |
| Metallothionein 2 | Mt2 | 3 | 0 | 3 | No | 0 | 3 | 0 | 0 |
| Metallothionein 3 | Mt3 | 2 | 2 | 0 | No | 1 | 0 | 1 | 0 |
| MHC class Ib antigen | 2 | 0 | 2 | No | 0 | 2 | 0 | 0 | |
| Myelin basic protein | Mbp | 3 | 2 | 1 | No | 1 | 1 | 1 | 0 |
| NDRG family member 2 | NDRG2 | 2 | 1 | 1 | No | 0 | 0 | 2 | 0 |
| Neural precursor expressed, developmentally downregulated gene | Nedd | 2 | 2 | 0 | No | 1 | 0 | 1 | 0 |
| p41‐Arc | arpD | 2 | 0 | 2 | No | 0 | 2 | 0 | 0 |
| Pleckstrin | Pscd1 | 3 | 2 | 1 | No | 1 | 0 | 2 | 0 |
| Preprocathepsin | 2 | 1 | 1 | No | 1 | 1 | 0 | 0 | |
| Protein p9Ka homologous to calcium‐binding protein (S100) | S100 | 5 | 1 | 4 | No | 2 | 3 | 0 | 0 |
| Secreted protein, acidic, cysteine‐rich (osteonectin) | SPARC | 4 | 2 | 2 | No | 1 | 2 | 1 | 0 |
| Spinophilin | Spn | 2 | 1 | 1 | No | 1 | 1 | 0 | 0 |
| Tachykinin 1 | Tac1 | 2 | 0 | 2 | No | 0 | 2 | 0 | 0 |
| Thyrotropin releasing hormone | TRH | 4 | 0 | 4 | No | 1 | 3 | 0 | 0 |
| Tissue inhibitor of metalloproteinase 1 | Timp1 | 3 | 0 | 3 | No | 1 | 2 | 0 | 0 |
| Transferrin | Tsf | 2 | 0 | 2 | No | 0 | 1 | 1 | 0 |
| Vimentin | Vim | 2 | 0 | 2 | No | 0 | 2 | 0 | 0 |
| Apolipoprotein | ApoE | 4 | 3 | 1 | Yes | 3 | 0 | 1 | 0 |
| Ca(2+)/calmodulin‐dependent protein kinase II | CaMKII | 4 | 1 | 3 | Yes | 2 | 1 | 1 | 0 |
| Cabonic anhydrase | CA | 2 | 1 | 1 | Yes | 0 | 0 | 2 | 0 |
| CD 99 antigen | CD99 | 2 | 1 | 1 | Yes | 0 | 0 | 1 | 1 |
| Glyceraldehyde phosphate dehydrogenaase | GAPDH | 3 | 2 | 1 | Yes | 2 | 1 | 0 | 0 |
| Glycoprotein 65 | 2 | 1 | 1 | Yes | 1 | 1 | 0 | 0 | |
| Growth arrest and DNA damage‐inducible protein 45 | GADD45 | 3 | 0 | 3 | Yes | 0 | 3 | 0 | 0 |
| Laminin receptor 1 | Lamr1 | 2 | 1 | 1 | Yes | 0 | 1 | 1 | 0 |
| Metallothionein 1 | Mt1 | 3 | 1 | 2 | Yes | 1 | 2 | 0 | |
| Ornithine decarboxylase | Oda | 2 | 1 | 1 | Yes | 0 | 1 | 1 | 0 |
| Peptidylprolyl isomerase B (cyclophilin B) | Ppib | 2 | 0 | 2 | Yes | 0 | 2 | 0 | 0 |
| Platelet activation factor acetylhydrolase | Pafah | 3 | 1 | 2 | Yes | 0 | 2 | 1 | 0 |
| Protein kinase C β | PrkCB | 2 | 0 | 2 | Yes | 0 | 2 | 0 | |
| Proteolipid protein 1 | Plp | 2 | 1 | 1 | Yes | 1 | 0 | 1 | 0 |
| Thymosin beta | Tmbx | 4 | 3 | 1 | Yes | 2 | 1 | 1 | 0 |
| Serum/glucocorticoid regulated kinase | Sgk | 2 | 0 | 2 | Unknown | 1 | 1 | 0 | 0 |
| CD 14 antigen | CD14 | 2 | 0 | 2 | Unknown | 1 | 1 | 0 | 0 |
| CD 74 antigen | CD74 | 2 | 0 | 2 | Unknown | 1 | 0 | 1 | 0 |
| Corticotropin releasing hormone | CRH | 2 | 0 | 2 | Unknown | 1 | 1 | 0 | 0 |
| GABA(A) receptor associated protein | GABARAP | 2 | 1 | 1 | Unknown | 1 | 0 | 0 | 1 |
| Galanin | Gal | 3 | 0 | 3 | Unknown | 1 | 2 | 0 | 0 |
| Glutamate receptor, ionotropic, N‐methyl D‐aspartate 2A | Grin2A | 2 | 0 | 2 | Unknown | 1 | 0 | 1 | 0 |
| Homer homolog 1 | Homer | 3 | DD, MPSS | 1 | Unknown | 3 | 0 | 0 | 0 |
| Neuritin | Nrn | 2 | 0 | 2 | Unknown | 0 | 2 | 0 | 0 |
| Neuropeptide Y | Npy | 4 | 0 | 4 | Unknown | 1 | 3 | 0 | 0 |
| Nuclear factor of kappa light chain gene enhancer in B‐cells inhibitor, alpha | Nfkbia | 2 | 0 | 2 | Unknown | 1 | 1 | 0 | 0 |
| Peptidylglycin‐alpha‐amidating monooxygenase | PAM | 2 | 0 | 2 | Unknown | 0 | 2 | 0 | 0 |
| Prostaglandin‐endoperoxide synthase 2 | Ptgs2 | 2 | 0 | 2 | Unknown | 1 | 1 | 0 | 0 |
| Secreted phosphoprotein 1 | Spp1 | 2 | 0 | 2 | Unknown | 1 | 1 | 0 | 0 |
| Signal transducer and activator of transcription 3 | Stat3 | 2 | 0 | 2 | Unknown | 1 | 1 | 0 | 0 |
| Somatostatin | Sst | 2 | 0 | 2 | Unknown | 1 | 1 | 0 | 0 |
| Synaptophysin | Syp | 2 | 0 | 2 | Unknown | 2 | 0 | 0 | 0 |
| Syndecan 4 | Sdc4 | 2 | 0 | 2 | Unknown | 1 | 1 | 0 | 0 |
| VGF nerve growth factor inducible | Vgf | 3 | 0 | 3 | Unknown | 1 | 2 | 0 | 0 |
| β2‐microglobulin | β2m | 2 | 0 | 2 | Unknown | 2 | 0 | 0 | 0 |
The functional classification of these genes is also interesting to review. The gene ontology classification of cellular component, biological process and molecular function has been used for functional classification by the majority of authors whereas several have utilized functional groups described previously in the literature including immediate early genes/transcription factors, calcium homeostasis, intra/extracellular signaling, synaptic/vesicular, morphology, cell cycle/fate, injury/survival, metabolism and unknown. A list of the most prominent biological process regulated as described by each author is seen in Table 4. It is clear that there is a wide range of biological processes involved in the epileptogenic process. These include basic cellular metabolism, regulation of transcription, protein processing, synaptic transmission, response to injury/cell death and regeneration and immune response.
Table 4.
Biological processes. Abbreviations: EC = endothelial cell; ECM = extracellular matrix; PG = prostaglandin.
| Biological process | Author | |||||||||
|---|---|---|---|---|---|---|---|---|---|---|
| Arai | Elliott | Gorter | Hendriksen | Hunsberger | Jamali | Liang | Lukasiuk | Tang | Wang | |
| Axonal growth and proliferation | ✓ | |||||||||
| Cell adhesion | ✓ | |||||||||
| Cell cycle progression | ✓ | |||||||||
| Cell damage, axonal growth and regeneration | ✓ | |||||||||
| Cell death | ✓ | |||||||||
| Cellular metabolism | ✓ | ✓ | ✓ | ✓ | ||||||
| Cellular transport | ✓ | |||||||||
| Coagulation pathway | ✓ | |||||||||
| Cytoskeletal/ECM organization | ✓ | |||||||||
| EC signaling | ✓ | |||||||||
| ECM remodeling | ✓ | ✓ | ||||||||
| Gliosis | ✓ | |||||||||
| Immune response | ✓ | ✓ | ✓ | ✓ | ||||||
| Injury response/cell survival | ✓ | |||||||||
| Membrane transport | ✓ | |||||||||
| Morphology | ✓ | |||||||||
| Neuronal plasticity | ✓ | |||||||||
| Neurotransmission | ✓ | |||||||||
| PG synthesis | ✓ | |||||||||
| Protein processing | ✓ | ✓ | ||||||||
| Signal transduction | ✓ | |||||||||
| Synaptic transmission | ✓ | ✓ | ||||||||
| Transcriptional regulation | ✓ | ✓ | ||||||||
The different time frames of the analysis of the gene expression also contribute to the differences to the profiling results. Transcriptional changes immediately following seizures will encompass the response to hyperthermia, mild hypoxia or hypoglycemia, and even direct trauma from any cerebral or truncal impacts. This contrasts with gene expression during the latent phase of epileptogenesis whereby a period of recovery with substrate replenishment and remodeling occurs, and during the chronic epileptic states seen in human studies. Numerous studies have demonstrated the transient nature of transcriptional changes within their own epileptogenesis model, let alone between different models 57, 63, 110.
Lukasiuk et al have recently presented in abstract form and in a review article, an extension to their previous analysis of gene expression during epileptogenesis. Identification of highly represented functional classification as well as individual genes that appeared across data sets was performed with cell death and survival, neuronal plasticity and immune response as the most prominent. Seventy individual genes were identified to be consistently regulated across at least three studies using specific time‐point analyses 64, 65. Our data indicates only 22 genes consistently regulated across at least three studies. This difference is explained by the inclusion of animal models of traumatic head injuries in the analysis by Lukasiuk et al that we did not include. The justification for their inclusion is the initial hit theory whereby an early insult, be it ischemic, traumatic or infective, sets into motion a series of molecular changes that lead into the latency period before chronic epilepsy. However, recent figures suggest only 2% to 5% of traumatic brain injury cases will develop epilepsy (75). Second, post‐traumatic seizures are more commonly a result of cerebral contusions leading to scarring and altered neuronal circuitry rather than the classical MTLE syndrome. Filtering out the head injury papers from Lukasiuk et al's study leaves only four consistently regulated genes, three of which are included in our list of regulated genes (Gadd45a, Ctsd, Ctss, Zfp36). The last gene, zinc finger protein 36 (zfp36) is only reported differentially expressed in different arms of the same study by Becker et al and was excluded from our analysis.
The complexity of neuronal structure and organization within the mesial temporal lobe regions may contribute to this issue. In particular, the anatomical subregions of the hippocampus demonstrate both histological and functional differences in their composition and response to certain conditions. Whereas CA1 and CA3 are considered integral to the transmission of input signals, CA2 is considered a transitional zone with no clear function and the dentate gyrus is considered the main input pathway into the hippocampus, receiving afferents itself from the entorhinal cortex via the perforant pathway (31). Increasing interest in gene expression profiling between hippocampal subfields has suggested a molecular basis underlying the previously defined anatomic subregions of the hippocampus (112). This may further improve understanding of the differing histopathological responses described earlier.
Few reports have attempted to stratify global gene expression profiles in terms of hippocampal subfields. Indeed, of the reviewed articles, only three reported comparisons between subregions of the brain. Reasons for this may include the large amounts of starting mRNA needed for global gene expression platforms in general, or the difficulty in isolating individual subfields. The use of stereo dissection or laser microdissection to accurately isolate different hippocampal subregions as performed by Becker et al, Datson et al and Torres‐Munoz et al have challenged these notions. This technique has been described to allow direct microscopic identification of specific cell types without appreciable loss of their DNA or RNA. Furthermore microarray analysis was able to be performed on the limited amount of mRNA extracted using double round amplification to provide sufficient material 4, 17, 99. Marked differences (>700 genes) were found in the hippocampal response to chronic glucocorticoid exposure between CA3 and the dentate gyrus; however, 79 genes reliably identified in individual subfields were virtually undetectable when looking at whole hippocampal specimens. The practice of analyzing gross or pooled hippocampal specimens fails to take into account these obvious differences and may skew ensuing results.
Although global expression profiling has the advantages of being time efficient in analyzing large portions of the transcriptome, there are limitations to the sensitivity and accuracy. It is well documented that SAGE may inconsistently detect low abundance transcripts leaving small genomic expression changes induced by the experimental model or disease undetected. This is evident in examining the epilepsy studies discussed above with each generated database containing 5000 to 14 000 unique tags only, a significant decrease from the estimated size of the entire hippocampal transcriptome being over 30 000 16, 26. Furthermore, the sequencing error of SAGE is estimated at an average of 1% per base because of the fact they utilize a single‐pass sequence in data processing. This accumulates to roughly 10% per 100 base pairs, leading to lower correct tags counts and artificially inflate the tag counts of already established tags or establish a count of a tag that does not exist. Microarray studies have also been shown to demonstrate significant variations even under the same experimental conditions. As such, validation of global expression profiling results by independent methods, such as real‐time polymerase chain reaction (PCR), Northern/Western blotting and immunohistochemical methods, is crucial. In our experience, a significant decrease in the number of differentially expressed genes is demonstrated when validating SAGE results using quantitative real‐time polymerase chain reaction (qRT‐PCR) with a custom‐made, low‐density array chip of 94 significant genes as indicated by SAGE (82).
Following the changes into the proteomic stage will further validate results of global expression profiling. Translation into functional proteins represents the final pathway of genomic regulation. Quantifying the proteomic changes specimens through immunoperoxidase stainings and in situ hybridizations will not only complete the interrogation process, but also give insights into region‐specific changes that may have been missed in interrogation of gross hippocampal, possibly negating the requirement for microdissection of hippocampal subregions (Figure 3).
In terms of gene expression platforms, the laboratory conditions play a vital role in the reproducibility of results. It is not unusual for the same experiments performed on different days to produce differing results. Similarly, experiments performed by separate scientists on the same days will also often produce differing results. Subtle variations in the complementary tags used to interrogate the transcriptome can also cause biased results. Specifically, selection of cDNA probe sets on microarray cards or the use of modifications of the SAGE technique such as LongSAGE adds more potential for a varied result.
What then are the advantages of global expression profiling? The advent of these technologies in the mid‐1990s heralded a new excitement into the possibilities of molecular biological research. It allowed researchers to access the diverse levels of biological processes in its entirety, from primary DNA sequences in coding and regulatory regions, to RNA expression in response to the physiological or diseased environment, to proteomic interactions and localizations. The sheer power of simultaneously interrogating thousands of genes enables the acquisition of global pictures of biological processes that would otherwise be out of reach utilizing traditional gene‐to‐gene approaches.
Prior to global expression profiling, laboratory research was being driven by theories and hypotheses developed from meticulously analyzed pathways or the occasional spontaneous brain wave. The formulation of these theories in the history of epilepsy research have resulted in much interest in the neural imbalance of excitatory/inhibitory control, or the involvement of ionic channels and aberrant neuronal synapses in the epileptogenic processes (97). Indeed, numerous laboratories have published insightful papers documenting a net excitatory imbalance in MTLE models 14, 22, 84. More recently two microarray studies revealed confirmatory findings with the downregulation of gamma‐aminobutyric acid‐associated receptors and the upregulation of glutamate‐associated receptors in the kainite model of epileptogenesis as well as chronic human MTLE 3, 44. What is not evident in the literature are the situations where there have been failed hypotheses resulting in a laboratory and scientific losses in terms of time, personnel and finance. The use of global profiling platforms to guide hypotheses may be a viable option to minimize these situations.
The advantage in global expression profiling is the development of a broad understanding of the mechanisms underlying the process. It is the accumulation of the supportive data gathered from functional classes that enables more robust hypotheses to be formed and tested. In turn this allows further focussed research into specific genes or functional classes as has already been performed by several laboratories 42, 80. Novel treatment strategies may be identified from the identification of the involvement of functional groups with development of new pharmacological agents targeting the specific biological process.
The publication of comparable gene libraries produced using global expression profiling methods also allows indirect interrogation between epilepsy and other disorders. Identification of commonality genes across disorders may provide a greater understanding of the aetiological or consequential effect of a regulated gene/process. Detection of common pathways through which each disorder is propagated may allow cross‐over treatment between disorders giving new insight and treatment options.
CONCLUSIONS
Global expression profiling during epileptogenesis allows a greater understanding of the broad mechanisms underlying the epileptic process. It demonstrates specific genomic changes operating in concert with the entire molecular environment, thereby opening the doors to further research into possible causative pathways and functions through gene ontology annotations of cellular components, biological processes and molecular functions. In addition, the availability of large‐scale libraries produced using uniform protocols allows the comparisons of commonality genes within other disorders apart from epilepsy potentially identifying reactive general genomic changes, shared pathways of action or specific causative genes. There is also the potential for discovery of novel genes not previously described with SAGE resulting in new hypotheses and theories into the pathogenesis of epilepsy as well as the potential to guide new therapeutic treatments in epilepsy as well as other disorders, neural or non‐neural.
However, the most exciting aspect of global gene expression profiling is the general starting point of the research study. Previously, investigations into specific genes were performed based on previous studies or individual hypotheses. The use of global expression profiling allows the entire genome to be studied with hypotheses developed following this. In this manner, future research hypotheses are generated from science rather than hypotheses leading to science, a situation that must lend itself to greater transparency in laboratory research.
It is vitally important that further research into epileptogenesis builds on prior knowledge and pitfalls. It is the opinion of our laboratory that the entire process of molecular transcription and translation be interrogated with validation of global expression profiling results utilizing qRT‐PCR followed by proteomic profiling using any combination of Western blotting, immunoperoxidase staining and in situ hybridization. Focusing genomic profiles into specific anatomical regions may enable causative molecular pathways to be identified and allow greater understanding of the histological changes, particular in the situation of HS associated MTLE whereby disagreement remains over the cause or effect of the pathological changes.
ACKNOWLEDGMENTS
This work is supported by the Royal Australasian College of Surgeons through the John Lowenthal and Foundation Scholarships 2005 and 2006, as well as the St Vincent's Hospital Grant‐in‐Aids 2005.
Re‐use of this article is permitted in accordance with the Creative Commons Deed, Attribution 2.5, which does not permit commercial exploitation.
REFERENCES
- 1. Agardh CD, Kalimo H, Olsson Y, Siesjo BK (1980) Hypoglycemic brain injury. I. Metabolic and light microscopic findings in rat cerebral cortex during profound insulin‐induced hypoglycemia and in the recovery period following glucose administration. Acta Neuropathol 50:31–41. [DOI] [PubMed] [Google Scholar]
- 2. Arai M, Amano S, Ryo A, Hada A, Wakatsuki T, Shuda M et al (2003) Identification of epilepsy‐related genes by gene expression profiling in the hippocampus of genetically epileptic rat. Mol Brain Res 118:147–151. [DOI] [PubMed] [Google Scholar]
- 3. Arion D, Sabatini M, Unger T, Pastor J, Alonso‐Nanclares L, Ballesteros‐Yanez I et al (2006) Correlation of transcriptome profile with electrical activity in temporal lobe epilepsy. Neurobiol Dis 22:374–387. [DOI] [PubMed] [Google Scholar]
- 4. Becker AJ, Chen J, Zien A, Sochivko D, Normann S, Schramm J et al (2003) Correlated stage‐ and subfield‐associated hippocampal gene expression patterns in experimental and human temporal lobe epilepsy. Eur J Neurosci 18:2792–2802. [DOI] [PubMed] [Google Scholar]
- 5. Berg AT, Langfitt J, Shinnar S, Vickrey BG, Sperling MR, Walczak T et al (2003) How long does it take for partial epilepsy to become intractable? Neurology 60:186–190. [DOI] [PubMed] [Google Scholar]
- 6. Bien C, Kurthen M, Baron K, Lux S, Helmstaedter C, Schramm J, Elger C (2001) Long‐term seizure outcome and antiepileptic drug treatment in surgically treater temporal lobe epilepsy patients: a controlled study. Epilepsia 42:1416–1421. [DOI] [PubMed] [Google Scholar]
- 7. Boguski MS, Lowe TM, Tolstoshev CM (1993) dbEST—database for “expressed sequence tags. Nat Genet 4:332–333. [DOI] [PubMed] [Google Scholar]
- 8. Bouchet C, Cazauvieil H (1825) Epilepsie et l'alienation mentale. Arch Gen Med 9:510–542. [Google Scholar]
- 9. Brenner S, Johnson M, Bridgham J, Golda G, Lloyd DH, Johnson D et al (2000) Gene expression analysis by massively parallel signature sequencing (MPSS) on microbead arrays. Nat Biotechnol 18:630–634. [DOI] [PubMed] [Google Scholar]
- 10. Brenner S, Williams SR, Vermaas EH, Storck T, Moon K, McCollum C et al (2000) In vitro cloning of complex mixtures of DNA on microbeads: physical separation of differentially expressed cDNAs 10.1073/pnas.97.4.1665. Proc Natl Acad Sci 97:1665–1670. [DOI] [PMC free article] [PubMed] [Google Scholar]
- 11. Cai J, Shin S, Wright L, Liu Y, Zhou D, Xue H et al (2006) Massively parallel signature sequencing profiling of fetal human neural precursor cells. Stem Cells Dev 15:232–244. [DOI] [PubMed] [Google Scholar]
- 12. Cavallaro S, D'Agata V, Manickam P, Dufour F, Alkon DL (2002) Memory‐specific temporal profiles of gene expression in the hippocampus. Proc Natl Acad Sci USA 99:16279–16284. [DOI] [PMC free article] [PubMed] [Google Scholar]
- 13. Christiaens F, Mewasingh L, Christophe C, Goldman S, Dan B (2003) Unilateral cortical necrosis following status epilepticus with hypoglycemia. Brain Dev 25:107–112. [DOI] [PubMed] [Google Scholar]
- 14. Cincotta M, Young NA, Beart PM (1991) Unilateral up‐regulation of glutamate receptors in limbic regions of amygdaloid‐kindled rats. Exp Brain Res 85:650–658. [DOI] [PubMed] [Google Scholar]
- 15. Cohen‐Gadol AA, Wilhelmi BG, Collignon F, White JB, Britton JW, Cambier DM et al (2006) Long‐term outcome of epilepsy surgery among 399 patients with nonlesional seizure foci including mesial temporal lobe sclerosis. J Neurosurg 104:513–524. [DOI] [PubMed] [Google Scholar]
- 16. Datson N, Jvd P, Kloet ED, Vreugdenhil E (2001) Expression profile of 30,000 genes in rat hippocampus using SAGE. Hippocampus 11:430–444. [DOI] [PubMed] [Google Scholar]
- 17. Datson NA, Meiker L, Steenbergen P, Morsink M, Van Der Laan S, Meijer O, De Kloet E (2004) Expression profiling in laser‐microdissected hippocampal subregions in rat brain reveals large subregion‐specific differences in expression. Eur J Neurosci 20:2541–2554. [DOI] [PubMed] [Google Scholar]
- 18. De Chaldee M, Gaillard MC, Bizat N, Buhler JM, Manzoni O, Bockaert J et al (2003) Quantitative assessment of transcriptome differences between brain territories. Genome Res 13:1646–1653. [DOI] [PMC free article] [PubMed] [Google Scholar]
- 19. Dickson DW, Davies P, Bevona C, Van Hoeven KH, Factor SM, Grober E et al (1994) Hippocampal sclerosis: a common pathological feature of dementia in very old (> or = 80 years of age) humans. Acta Neuropathol (Berl) 88:212–221. [DOI] [PubMed] [Google Scholar]
- 20. Ding C, Cantor CR (2004) Quantitative analysis of nucleic acids—the last few years of progress. J Biochem Mol Biol 37:1–10. [DOI] [PubMed] [Google Scholar]
- 21. Doherty J, Ciliax N, Zhang S, Borges K, Dingledine R (2001) Spatial and temporal patterns of gene expression during epileptogenesis in the mouse hippocampus. Epilepsia 42(Suppl. 7):111–112. [Google Scholar]
- 22. During MJ, Ryder KM, Spencer DD (1995) Hippocampal GABA transporter function in temporal‐lobe epilepsy. Nature 376: 174–177. [DOI] [PubMed] [Google Scholar]
- 23. Eisen MB, Spellman PT, Brown PO, Botstein D (1998) Cluster analysis and display of genome‐wide expression patterns. Proc Natl Acad Sci USA 95:14863–14868. [DOI] [PMC free article] [PubMed] [Google Scholar]
- 24. Elliott RC, Miles MF, Lowenstein DH (2003) Overlapping microarray profiles of dentate gyrus gene expression during development‐ and epilepsy‐associated neurogenesis and axon outgrowth. J Neurosci 23:2218–2227. [DOI] [PMC free article] [PubMed] [Google Scholar]
- 25. Eun JP, Choi HY, Kwak YG (2004) Proteomic analysis of human cerebral cortex in epileptic patients. Exp Mol Med 36:185–191. [DOI] [PubMed] [Google Scholar]
- 26. Evans SJ, Datson NA, Kabbaj M, Thompson RC, Vreugdenhil E, De Kloet ER et al (2002) Evaluation of Affymetrix Gene Chip sensitivity in rat hippocampal tissue using SAGE analysis. Serial Analysis of Gene Expression. Eur J Neurosci 16:409–413. [DOI] [PubMed] [Google Scholar]
- 27. Fisher RS, Boas WvE, Blume W, Elger C, Genton P, Lee P, Jerome Engel J (2005) Epileptic seizures and epilepsy: definitions proposed by the International League Against Epilepsy (ILAE) and the Internationl Bureau for Epilepsy (IBE). Epilepsia 46:470–472. [DOI] [PubMed] [Google Scholar]
- 28. Forsgren L, Hauser WA, Olafsson E, Sander JW, Sillanpaa M, Tomson T (2005) Mortality of epilepsy in developed countries: a review. Epilepsia 46 (Suppl. 11):18–27. [DOI] [PubMed] [Google Scholar]
- 29. French PJ, O'Connor V, Voss K, Stean T, Hunt SP, Bliss TV (2001) Seizure‐induced gene expression in area CA1 of the mouse hippocampus. Eur J Neurosci 14:2037–2041. [DOI] [PubMed] [Google Scholar]
- 30. Fryer R, Randall J, Yoshida T, Hsiao L‐L, Blumenstock J, Jensen K et al (2002) Global analysis of gene expression: methods, interpretation and pitfalls. Exp Nephrol 10:64–74. [DOI] [PubMed] [Google Scholar]
- 31. Gaarskjaer FB (1986) The organization and development of the hippocampal mossy fiber system. Brain Res 396:335–357. [DOI] [PubMed] [Google Scholar]
- 32. Glien M, Brandt C, Potschka H, Voigt H, Ebert U, Loscher W (2001) Repeated low‐dose treatment of rats with pilocarpine: low mortality but high proportion of rats developing epilepsy. Epilepsy Res 46:111–119. [DOI] [PubMed] [Google Scholar]
- 33. Goddard GV (1967) Development of epileptic seizures through brain stimulation at low intensity. Nature 214:1020–1021. [DOI] [PubMed] [Google Scholar]
- 34. Goddard GV, McIntyre DC, Leech CK (1969) A permanent change in brain function resulting from daily electrical stimulation. Exp Nephrol 25:295–330. [DOI] [PubMed] [Google Scholar]
- 35. Gowda M, Jantasuriyarat C, Dean RA, Wang G‐L (2004) Robust‐LongSAGE (RL‐SAGE): a substantially improved LongSAGE method for gene discovery and transcriptome analysis. Plant Physiol 134:890–897. [DOI] [PMC free article] [PubMed] [Google Scholar]
- 36. Greene ND, Bamidele A, Choy M, De Castro SC, Wait R, Leung KY et al (2007) Proteome changes associated with hippocampal MRI abnormalities in the lithium pilocarpine‐induced model of convulsive status epilepticus. Proteomics 7:1336–1344. [DOI] [PubMed] [Google Scholar]
- 37. Gunnersen JM, Spirkoska V, Smith PE, Danks RA, Tan SS (2000) Growth and migration markers of rat C6 glioma cells identified by serial analysis of gene expression. Glia 32:146–154. [PubMed] [Google Scholar]
- 38. Gunnersen JM, Augustine C, Spirkoska V, Kim M, Brown M, Tan SS (2002) Global analysis of gene expression patterns in developing mouse neocortex using serial analysis of gene expression. Mol Cell Neurosci 19:560–573. [DOI] [PubMed] [Google Scholar]
- 39. Hamani C, Mello LE (2002) Spontaneous recurrent seizures and neuropathology in the chronic phase of the pilocarpine and picrotoxin model epilepsy. Neurol Res 24:199–209. [DOI] [PubMed] [Google Scholar]
- 40. Hanzel DK, Trojanowski JQ, Johnston RF, Loring JF (1999) High‐throughput quantitative histological analysis of Alzheimer's disease pathology using a confocal digital microscanner. Nat Biotechnol 17:53–57. [DOI] [PubMed] [Google Scholar]
- 41. Hauser MA, Li YJ, Takeuchi S, Walters R, Noureddine M, Maready M et al (2003) Genomic convergence: identifying candidate genes for Parkinson's disease by combining serial analysis of gene expression and genetic linkage. Hum Mol Genet 12:671–677. [PubMed] [Google Scholar]
- 42. Hendriksen H, Datson NA, Ghijsen WE, Van Vliet EA, Da Silva FH, Gorter JA, Vreugdenhil E (2001) Altered hippocampal gene expression prior to the onset of spontaneous seizures in the rat post‐status epilepticus model. Eur J Neurosci 14:1475–1484. [DOI] [PubMed] [Google Scholar]
- 43. Hughes T, Marton M, Jones A, Roberts C, Stoughton R, Armouror C et al (2000) Functional discovery via a compendium of expression profiles. Cell 102:109–126. [DOI] [PubMed] [Google Scholar]
- 44. Hunsberger JG, Bennett AH, Selvanayagam E, Duman RS, Newton SS (2005) Gene profiling the response to kainic acid induced seizures. Brain Res Mol Brain Res 141:95–112. [DOI] [PubMed] [Google Scholar]
- 45. Iwamoto K, Kakiuchi C, Bundo M, Ikeda K, Kato T (2004) Molecular characterization of bipolar disorder by comparing gene expression profiles of postmortem brains of major mental disorders. Mol Psychiatry 9:406–416. [DOI] [PubMed] [Google Scholar]
- 46. Jamali S, Bartolomei F, Robaglia‐Schlupp A, Massacrier A, Peragut JC, Regis J et al (2006) Large‐scale expression study of human mesial temporal lobe epilepsy: evidence for dysregulation of the neurotransmission and complement systems in the entorhinal cortex. Brain 129:625–641. [DOI] [PubMed] [Google Scholar]
- 47. Jayapal M, Melendez AJ (2006) DNA microarray technology for target identification and validation. Clin Exp Pharmacol Physiol 33:496–503. [DOI] [PubMed] [Google Scholar]
- 48. Jellinger KA (2008) The pathology of “vascular dementia”: a critical update. J Alzheimers Dis 14:107–123. [DOI] [PubMed] [Google Scholar]
- 49. Jongeneel CV, Iseli C, Stevenson BJ, Riggins GJ, Lal A, Mackay A et al (2003) Comprehensive sampling of gene expression in human cell lines with massively parallel signature sequencing 10.1073/pnas.0831040100. Proc Natl Acad Sci 100:4702–4705. [DOI] [PMC free article] [PubMed] [Google Scholar]
- 50. Jongeneel CV, Delorenzi M, Iseli C, Zhou D, Haudenschild CD, Khrebtukova I et al (2005) An atlas of human gene expression from massively parallel signature sequencing (MPSS) 10.1101/gr.4041005. Genome Res 15:1007–1014. [DOI] [PMC free article] [PubMed] [Google Scholar]
- 51. Kalimo H, Olsson Y (1980) Effects of severe hypoglycemia on the human brain. Neuropathological case reports. Acta Neurol Scand 62:345–356. [DOI] [PubMed] [Google Scholar]
- 52. Kalimo H, Agardh CD, Olsson Y, Siesjo BK (1980) Hypoglycemic brain injury. II. Electron‐microscopic findings in rat cerebral cortical neurons during profound insulin‐induced hypoglycemia and in the recovery period following glucose administration. Acta Neuropathol 50:43–52. [DOI] [PubMed] [Google Scholar]
- 53. Klitgaard H, Matagne A, Vanneste‐Goemaere J, Margineanu DG (2002) Pilocarpine‐induced epileptogenesis in the rat: impact of initial duration of status epilepticus on electrophysiological and neuropathological alterations. Epilepsy Res 51:93–107. [DOI] [PubMed] [Google Scholar]
- 54. Koonin E, Aravind L, Kondrashov A (2000) The impact of comparative genomics on our understanding of evolution. Cell 101:573–576. [DOI] [PubMed] [Google Scholar]
- 55. Lal A, Lash A, Altschul S, Velculescu V, Zhang L, McLendon R et al (1999) A public database for gene expression in human cancers. Cancer Res 59:5403–5407. [PubMed] [Google Scholar]
- 56. Lash A, Tolstoshev CM, Wagner L, Schuler GD, Strausberg RL, Riggins GJ, Altschul SF (2000) SAGEmap: a public gene expression resource. Genome Res 10:1051–1060. [DOI] [PMC free article] [PubMed] [Google Scholar]
- 57. Liang D, Seyfried TN (2001) Genes differentially expressed in the kindled mouse brain. Brain Res Mol Brain Res 96:94–102. [DOI] [PubMed] [Google Scholar]
- 58. Lindberg RL, De Groot CJ, Certa U, Ravid R, Hoffmann F, Kappos L, Leppert D (2004) Multiple sclerosis as a generalized CNS disease—comparative microarray analysis of normal appearing white matter and lesions in secondary progressive MS. J Neuroimmunol 152:154–167. [DOI] [PubMed] [Google Scholar]
- 59. Liu XY, Yang JL, Chen LJ, Zhang Y, Yang ML, Wu YY et al (2008) Comparative proteomics and correlated signaling network of rat hippocampus in the pilocarpine model of temporal lobe epilepsy. Proteomics 8:582–603. [DOI] [PubMed] [Google Scholar]
- 60. Lockard JS, Uhlir V, DuCharme LL, Farquhar JA, Huntsman BJ (1975) Efficacy of standard anticonvulsants in monkey model with spontaneous motor seizures. Epilepsia 16:301–317. [DOI] [PubMed] [Google Scholar]
- 61. Lu W, Zhou D, Glusman G, Utleg AG, White JT, Nelson PS et al (2006) KLK31P is a novel androgen regulated and transcribed pseudogene of kallikreins that is expressed at lower levels in prostate cancer cells than in normal prostate cells. Prostate 66:936–944. [DOI] [PubMed] [Google Scholar]
- 62. Lukasiuk K, Pitkanen A (2004) Large‐scale analysis of gene expression in epilepsy research: is synthesis already possible? Neurochem Res 29:1169–1178. [DOI] [PubMed] [Google Scholar]
- 63. Lukasiuk K, Kontula L, Pitkanen A (2003) cDNA profiling of epileptogenesis in the rat brain. Eur J Neurosci 17:271–279. [DOI] [PubMed] [Google Scholar]
- 64. Lukasiuk K, Dabrowski M, Adach A, Pitkanen A (2006)Common traits in alterations of patterns of gene expression across different animal models of epileptogenesis. Epilepsia 47(s3):9. [Google Scholar]
- 65. Lukasiuk K, Dabrowski M, Adach A, Pitkanen A (2006) Epileptogenesis‐related genes revisited. In: Progress in Brain Research. Bahn H (ed.), Chapter 11, pp. 223–241. Elsevier B.V.: Amsterdam. [DOI] [PubMed] [Google Scholar]
- 66. Madden S, Galella E, Zhu J, Bertelsen A (1997) SAGE transcript profiles for p53‐dependant growth regulation. Oncogene 15:1079–1085. [DOI] [PubMed] [Google Scholar]
- 67. Maillard J, Berthier D, Thevenon S, Piquemal D, Chantal I, Marti J (2005) Efficiency and limits of serial analysis of gene expression (SAGE) method: discussions based on first results in bovine trypanotolerance. Vet Immunol Immunopathol 108:59–69 [DOI] [PubMed] [Google Scholar]
- 68. Margerison JH, Corsellis JA (1966) Epilepsy and the temporal lobes. A clinical, electroencephalographic and neuropathological study of the brain in epilepsy, with particular reference to the temporal lobes. Brain 89:499–530. [DOI] [PubMed] [Google Scholar]
- 69. Mathern GW, Cifuentes F, Leite JP, Pretorius JK, Babb TL (1993) Hippocampal EEG excitability and chronic spontaneous seizures are associated with aberrant synaptic reorganization in the rat intrahippocampal kainate model. Electroencephalogr Clin Neurophysiol 87:326–339. [DOI] [PubMed] [Google Scholar]
- 70. Meldrum BS (1971) Convulsive effects of bicuculline in photosensitive baboons (Papio papio) and rhesus monkeys (Macaca mulatta). J Physiol 215:29P–30P. [PubMed] [Google Scholar]
- 71. Milgram NW, Michael M, Cammisuli S, Head E, Ferbinteanu J, Reid C et al (1995) Development of spontaneous seizures over extended electrical kindling. II. Persistence of dentate inhibitory suppression. Brain Res 670:112–120. [DOI] [PubMed] [Google Scholar]
- 72. Nitta N, Heinrich C, Hirai H, Suzuki F (2008) Granule cell dispersion develops without neurogenesis and does not fully depend on astroglial cell generation in a mouse model of temporal lobe epilepsy. Epilepsia 49(10):1711–1722. [DOI] [PubMed] [Google Scholar]
- 73. Nygaard V, Hovig E (2006) Options available for profiling small samples: a review of sample amplification technology when combined with microarray profiling 10.1093/nar/gkj499. Nucleic Acids Res 34:996–1014. [DOI] [PMC free article] [PubMed] [Google Scholar]
- 74. Ozbas‐Gerceker F, Redeker S, Boer K, Ozguc M, Saygi S, Dalkara T et al (2006) Serial analysis of gene expression in the hippocampus of patients with mesial temporal lobe epilepsy. Neuroscience 138:457–474. [DOI] [PubMed] [Google Scholar]
- 75. Pagni CA, Zenga F (2006) Prevention and treatment of post‐traumatic epilepsy. Expert Rev Neurother 6:1223–1233. [DOI] [PubMed] [Google Scholar]
- 76. Patino WD, Mian OY, Hwang PM (2002) Serial analysis of gene expression: technical considedrations and applications to cardiovascular biology. Circ Res 91:565–569. [DOI] [PubMed] [Google Scholar]
- 77. Perez‐Plasencia C, Riggins G, Vazquez‐Ortiz G, Moreno J, Arreola H, Hidalgo A et al (2005) Characterization of the global profile of genes expressed in cervical epithelium by serial analysis of gene expression (SAGE). BMC Genomics 6:130. [DOI] [PMC free article] [PubMed] [Google Scholar]
- 78. Peters DG, Kassam AB, Yonas H, O'Hare EH, Ferrell RE, Brufsky AM (1999) Comprehensive transcript analysis in small quantities of mRNA by SAGE‐Lite. Nucleic Acids Res 27:e39. [DOI] [PMC free article] [PubMed] [Google Scholar]
- 79. Pinel JP, Rovner LI (1978) Experimental epileptogenesis: kindling‐induced epilepsy in rats. Exp Neurol 58:190–202. [DOI] [PubMed] [Google Scholar]
- 80. Potschka H, Krupp E, Ebert U, Gumbel C, Leichtlein C, Lorch B et al (2002) Kindling‐induced overexpression of Homer 1A and its functional implications for epileptogenesis. Eur J Neurosci 16:2157–2165. [DOI] [PubMed] [Google Scholar]
- 81. Racine RJ (1972) Modification of seizure activity by electrical stimulation. II. Motor seizure. Electroencephalogr Clin Neurophysiol 32:281–294. [DOI] [PubMed] [Google Scholar]
- 82. Reghunathan R, Jayapal M, Hsu LY, Chng HH, Tai D, Leung BP, Melendez AJ (2005) Expression profile of immune response genes in patients with severe acute respiratory syndrome. BMC Immunol 6:2. [DOI] [PMC free article] [PubMed] [Google Scholar]
- 83. Reinartz J, Bruyns E, Lin J‐Z, Burcham T (2002) Massively parallel signature sequencing (MPSS) as a tool for in‐depth quantitative gene expression profiling in all organisms. Brief Funct Genomic Proteomic 1:95–104. [DOI] [PubMed] [Google Scholar]
- 84. Roberts E (1984) GABA‐related phenomena, models of nervous system function, and seizures. Ann Neurol 16(Suppl.):S77–89. [DOI] [PubMed] [Google Scholar]
- 85. Saha S, Sparks A, Rago C, Akmaev V, Wang C, Vogelstein B et al (2002) Using the transcriptome to annotate the genome. Nat Biotechnol 20:508–512. [DOI] [PubMed] [Google Scholar]
- 86. Sandberg R, Yasuda R, Pankratz DG, Carter TA, Del Rio JA, Wodicka L et al (2000) Regional and strain‐specific gene expression mapping in the adult mouse brain. Proc Natl Acad Sci USA 97:11038–11043. [DOI] [PMC free article] [PubMed] [Google Scholar]
- 87. Sayin U, Osting S, Hagen J, Rutecki P, Sutula T (2003) Spontaneous seizures and loss of axo‐axonic and axo‐somatic inhibition induced by repeated brief seizures in kindled rats. J Neurosci 23:2759–2768. [DOI] [PMC free article] [PubMed] [Google Scholar]
- 88. Schena M, Shalon D, Davis RW, Brown PO (1995) Quantitative monitoring of gene expression patterns with a complementary DNA microarray. Science 270:467–470. [DOI] [PubMed] [Google Scholar]
- 89. Shmueli O, Horn‐Saban S, Chalifa‐Caspi V, Shmoish M, Ophir R, Benjamin‐Rodrig H et al (2003) GeneNote: whole genome expression profiles in normal human tissues. C R Biol 326:1067–1072. [DOI] [PubMed] [Google Scholar]
- 90. Smith PD, McLean KJ, Murphy MA, Turnley AM, Cook MJ (2005) Seizures, not hippocampal neuronal death, provoke neurogenesis in a mouse rapid electrical amygdala kindling model of seizures. Neuroscience 136:405–415. [DOI] [PubMed] [Google Scholar]
- 91. Stolovitzky GA, Kundaje A, Held GA, Duggar KH, Haudenschild CD, Zhou D et al (2005) Statistical analysis of MPSS measurements: application to the study of LPS‐activated macrophage gene expression 10.1073/pnas.0406555102. Proc Natl Acad Sci 102:1402–1407. [DOI] [PMC free article] [PubMed] [Google Scholar]
- 92. Su AI, Cooke MP, Ching KA, Hakak Y, Walker JR, Wiltshire T et al (2002) Large‐scale analysis of the human and mouse transcriptomes. Proc Natl Acad Sci USA 99:4465–4470. [DOI] [PMC free article] [PubMed] [Google Scholar]
- 93. Su AI, Wiltshire T, Batalov S, Lapp H, Ching KA, Block D et al (2004) A gene atlas of the mouse and human protein‐encoding transcriptomes. Proc Natl Acad Sci USA 101:6062–6067. [DOI] [PMC free article] [PubMed] [Google Scholar]
- 94. Tan SS, Gunnersen J, Job C (2002) Global gene expression analysis of developing neocortex using SAGE. Int J Dev Biol 46:653–660. [PubMed] [Google Scholar]
- 95. Tang Y, Lu A, Aronow BJ, Wagner KR, Sharp FR (2002) Genomic responses of the brain to ischemic stroke, intracerebral haemorrhage, kainate seizures, hypoglycemia, and hypoxia. Eur J Neurosci 15:1937–1952. [DOI] [PubMed] [Google Scholar]
- 96. Tanriverdi T, Olivier A, Poulin N, Andermann F, Dubeau F (2008) Long‐term seizure outcome after mesial temporal lobe epilepsy surgery: corticalamygdalohippocampectomy versus selective amygdalohippocampectomy. J Neurosurg 108:517–524. [DOI] [PubMed] [Google Scholar]
- 97. Thom M (2008) Hippocampal sclerosis: progress since sommer. Brain Pathol (in press) doi:10.1111/j.750‐3639.2008.00201.x. [DOI] [PMC free article] [PubMed] [Google Scholar]
- 98. Thom M, Martinian L, Williams G, Stoeber K, Sisodiya S (2005) Cell proliferation and granule cell dispersion in human hippocampal sclerosis. J Neuropathol Exp Neurol 64:194–201. [DOI] [PubMed] [Google Scholar]
- 99. Torres‐Munoz J, Van Waveren C, Keegan M, Bookman R, Petito C (2004) Gene expression profiles in microdissected neurons from human hippocampal subregions. Mol Brain Res 127:105–114. [DOI] [PubMed] [Google Scholar]
- 100. Van Gelder RN, Von Zastrow ME, Yool A, Dement WC, Barchas JD, Eberwine JH (1990) Amplified RNA synthesized from limited quantities of heterogeneous cDNA. Proc Natl Acad Sci USA 87:1663–1667. [DOI] [PMC free article] [PubMed] [Google Scholar]
- 101. Van Meter T, Dumur C, Hafez N, Garrett C, Fillmore H, Broaddus WC (2006) Microarray analysis of MRI‐defined tissue samples in glioblastoma reveals differences in regional expression of therapeutic targets. Diagn Mol Pathol 15:195–205. [DOI] [PubMed] [Google Scholar]
- 102. Velculescu V (1999) Tantalizing transcriptomes‐SAGE and its use in global gene expression analysis. Science 286: 1491–1492. [DOI] [PubMed] [Google Scholar]
- 103. Velculescu VE, Zhang L, Vogelstein B, Kinzler KW (1995) Serial analysis of gene expression. Science 270:484–487. [DOI] [PubMed] [Google Scholar]
- 104. Vinters HV, Ellis WG, Zarow C, Zaias BW, Jagust WJ, Mack WJ, Chui HC (2000) Neuropathologic substrates of ischemic vascular dementia. J Neuropathol Exp Neurol 59:931–945. [DOI] [PubMed] [Google Scholar]
- 105. Wahl MB, Heinzmann U, Imai K (2005) LongSAGE analysis significantly improves genome annotation: identifications of novel genes and alternative transcripts in the mouse. Bioinformatics 21:1393–1400. [DOI] [PubMed] [Google Scholar]
- 106. Weindruch R, Kayo T, Lee CK, Prolla TA (2002) Gene expression profiling of aging using DNA microarrays. Mech Ageing Dev 123:177–193. [DOI] [PubMed] [Google Scholar]
- 107. White HS (2002) Animal models of epileptogenesis. Neurology 59(9 Suppl. 5):S7–S14. [DOI] [PubMed] [Google Scholar]
- 108. Wiebe A, Blume W, Girvin J, Eliasziw M, Group EaEoSfTLES (2001) A randomized, controlled trial of surgery for temporal‐lobe epilepsy. N Engl J Med 345:311–318. [DOI] [PubMed] [Google Scholar]
- 109. Wieser H‐G (2004) Mesial temporal lobe epilepsy with hippocampal sclerosis. Epilepsia 45:695–714. [DOI] [PubMed] [Google Scholar]
- 110. Wilson DN, Chung H, Elliott RC, Bremer E, George D, Koh S (2005) Microarray analysis of postictal transcriptional regulation of neuropeptides. J Mol Neurosci 25:285–298. [DOI] [PubMed] [Google Scholar]
- 111. Yasuda CL, Tedeschi H, Oliveira EL, Ribas GC, Costa AL, Cardoso TA et al (2006) Comparison of short‐term outcome between surgical and clinical treatment in temporal lobe epilepsy: a prospective study. Seizure 15:35–40. [DOI] [PubMed] [Google Scholar]
- 112. Zhao X, Lein E, He A, Smith S, Aston C, Gage F (2001) Transcriptional profiling reveals strict boundaries between hippocampal subregions. J Comp Neurol 441:187–196. [DOI] [PubMed] [Google Scholar]