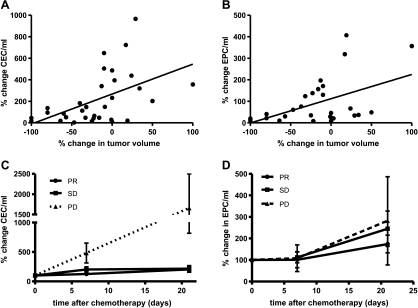
Figure 2.
Significant correlation between the changes in CECs (A) and EPCs (B) 7 days after chemotherapy and the percent tumor shrinkage according to RECIST. n = 53, Pearson R = 0.5 and 0.4, respectively (P < .01). CEC levels, but not EPC levels, after 7 and 21 days discriminated between patients with PD (n = 5) and SD/PR (P <.05) (C and D).

