Abstract
Attention has recently been focused on wealth as a source of long-term economic security and on wealth ownership as a crucial aspect of the racial economic divisions in the United States. This literature, however has been concerned primarily with the wealth gap between poor and middle-class families, and between the white and black middle class. In this paper, we investigate the incomes of families at the top and bottom of the family income distribution. We examine the sources of income and the demographic characteristics of these high-income and low-income families using family level data from the 1988-2003 Current Population Surveys.
We find that, at the bottom of the distribution, transfer income is the major income source; in particular, income from social security, supplemental security, and public assistance. At the top, employment income is the largest component of family income. Non-white, female, and non-married householders are disproportionately located at the bottom of the family income distribution. These families consist of both young and old adults, with high-school educations or less, in low-level service occupations. Many are disabled, many are retired. Householders at the top of the income distribution are typically male, white, and married. Householders and spouses at the top are typically middle-age, with college educations, employed in professional service and managerial occupations.
We find that wealth is not an important source of income for families at the highest percentiles. The highest income families during this period in the U.S. were not a “property elite”: their income is mostly from employment. We speculate, however, that they will join the “property elite” later in the life-course as they retire and receive income from their investments.
The Family Income Distribution: Income Components and Demographic Characteristics Introduction
Until the mid-1990s, nearly all discussions of economic inequality focused on income. Income, after all, is the proximate source of material well-being for the overwhelming majority of families and individuals in most societies, and data on income are easily obtained from a wide variety of sources. More recently, however, attention has been focused on wealth as a measure of long-term economic security (Oliver & Shapiro 1997; Keister 2000; Shapiro 2004; Wolf 2002). The distinction between wealth and income is important because wealth signifies ownership of a stock of assets, while income represents a flow of purchasing power. “Wealth represents a more permanent capacity to secure advantages in both the short and long term” (Shapiro 2004, 33), while income is a more short-term capacity to acquire goods and services. Wealth and income are positively correlated, because income that is saved and/or invested thereby becomes wealth, and wealth can be a source of income: families with more income can thereby amass more wealth, and families with more wealth can acquire additional income (Wolf 2002; Keister 2000).
The distribution of wealth is exceedingly unequal in the United States, much more unequal that the distribution of income: In 2004, the bottom 50% of families owned only 2.5% of net worth, while the top 1% owned 33.4%. In contrast, the bottom 50% of families received 23.8% of income, and the top 1% received 13.6% (Kinnickell 2006,Table 11a). The asset most equally distributed among families in the U.S. is the family home1: the bottom 50% of families owned 11.7% of the value of principal residences in 2004, and the next 40% owned over half of that value. It is through home-ownership that most Americans are able to accumulate wealth.
Oliver and Shapiro (1997) and Shapiro (2004) emphasize that, as a form of wealth, home-ownership conveys many of the advantages of wealth-holding, including the ability to leverage home equity to provide better opportunities for ones’ children, to invest in other assets, and to provide a hedge against spells of unemployment or other economic misfortune. They then argue that racial differences in the distribution of home-ownership create a qualitative chasm in life experiences and life chances between the white and black middle class.
In contrast to income-earning assets, however, home-ownership does not produce a flow of additional income, raising the family’s standard of living and, through savings or investment, adding to the family’s stock of wealth. Indeed, it is these income-producing assets (stocks, bonds, businesses, and real estate other than the principal residence) that free families from dependence on the labor market and contribute to economic independence, autonomy, and power. These income-producing assets are the most unequally-distributed of all: In 2004, the top 1% of families owned over half of the value of all directly held stocks, 70% of directly held bonds, 62% of “closely held businesses,” and 47% of non-residential real estate, while the bottom 50% owned less than 1% of these assets (Kinnickell 2006, Table 11a). The unequal distribution of these economic resources is important for several reasons. In market economies, wealth is an important source of economic power, and, in representative democracies, wealth is an important source of political power. As Gates and Collins (2002) suggest, “concentration of wealth and power distort our democratic institutions and economic system and undermine social cohesion.” As a result, the wealthy in America are granted more political power and greater opportunities (Cf. Lindblom, 1977).
Income and wealth are jointly determined. Income can be accumulated as wealth, and wealth is a source of additional income. We expect, therefore, that the highest income families are those with the most substantial wealth holdings and thus the highest income from wealth. Opportunities for the acquisition of both income and wealth in the United States have historically been determined, in part, by race. Blacks’ history of slavery, past and present discrimination in employment and housing, and extremely high levels of residential segregation have all served to create and maintain inequality in the distribution of schooling, jobs, home-ownership, and the ownership of other assets (Shapiro 2004). Therefore, we also expect that families with the highest incomes are predominantly white.
In addition, considering that approximately one-half of all Black households are headed by women, the economic status of Black women in the United States is an important predictor and major force between the consistent and wide-spread disparity between Black and White households (Brown 1997; Rivlin 1992). We therefore expect that black women are most likely to be located at the bottom of the family income distribution.
In what follows, we investigate the distribution of family income by income source, and the demographic characteristics of families at the top and the bottom of the family income distribution. Specifically, we focus on the bottom 10% and 25%, and the top 10%, 1%, and 0.5%. We pay special attention to the very top because of our interest in wealth and income from wealth: as we will show, only those at the very top receive substantial income from wealth. In this paper, we neglect the bottom 1% because their median income is under $1.00 for the entire sample period. On closer examination, the bottom 1% appears to be comprised of two very different populations: poor families with very low incomes, and others with large negative property and self-employment incomes. This is consistent with Lenski’s (1984, p. 191) suggestion that households with large negative incomes and large positive incomes are, in fact, very similar (e.g., entrepreneurs). We also examine what Lenski (1966, p. 340) calls the “property elite”: those whose income from wealth exceeds twice the median income from all sources.
Data and Methods
Data are from the Current Population Survey, Annual Demographic Supplement, 1968-2003. The Current Population Survey (CPS) is a monthly household survey conducted by the Census Bureau and the Bureau of Labor Statistics. The CPS collects monthly economic, social, and demographic data on all persons in the 50,000-60,000 sampled households (Current Population Survey, 2002); in addition, the Annual Demographic Supplement (ADS), collects employment and income data for the previous calendar year. Data are available at the person-, family-, and household-level. Technical details are available in the CPS Technical Paper 63RV (Current Population Survey, 2002). We extracted family-level income data for 1988-2003 from the 2004 CD (CPS Utilities, 2004)2. For each year, we aggregated families into the family income percentiles noted above. For each, we calculated the median income for each income source. Detailed income sources were aggregated into five broad categories: Employment (wages and salaries), Self-employment (self-employment and farm), Property (dividends, interest, and rents), Transfer (alimony, child-support, worker’s compensation, education, financial assistance, public assistance and welfare, retirement, supplemental security from government, survivor benefits, social security/railroad retirement, unemployment compensation, and veteran’s benefits), and “Other”. We did not include the earned-income tax credit (EITC) in any of our income categories. The documentation for this variable states that the actual dollar amount received by families is not the value reported for this variable. It is, instead, a simulation of what the family would have been eligible for, not what they actually received. There is no way to know in the CPS how much the family actually received from the EITC (CPS Utilities, 2004).
The CPS top-codes all incomes at the individual level, and these top-codes changed over time. We recoded all top-codes to the 1988 values before we aggregated individual incomes into families.3 Income is expressed in constant 2003 dollars using the Census Bureau’s Consumer Price Index Research Series (CPI-U-RS)4. We use the ADS family weights for all analyses (N=1,039,305 families).
Analyses
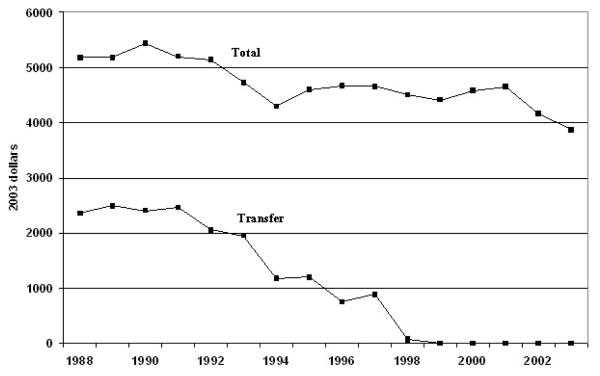
Median family income and income sources for the bottom 10% of families are presented in Figure 1. Median income for these families declined from just over $5,000 in 1988 to under $4,000 in 2003. The only income source with a non-zero median is transfer income, which declined from under $3,000 in 1988 to zero by 19995. Other data (not shown) indicate that much of these transfers consisted of social security, supplemental security, and public assistance6. The demographic characteristics of these families are presented in Table 1. Half of the householders are between 25 and 61 years old, with a median age of 40. Householder’s spouse (for those with a spouse) have a somewhat higher median age, and a narrower age range. Twenty-nine percent of householders are non-white, and over 63% are female. Well over 80% are not married, and more than 20% have unmarried children under 18 living with them. Half of householders did not complete 12 years of schooling, but half of spouses did.
Figure 1.
Median Family Income and Components- Bottom 10% of Family Income
TABLE 1.
Characteristics of Families at the Top and Bottom of the Family Income Distribution
| Bottom 10% (N=103,379) |
Bottom 25% (N=248,526) |
Top 10% (N=101,743) |
||||||||||
|---|---|---|---|---|---|---|---|---|---|---|---|---|
| Md | Q1 | Q3 | Md | Q1 | Q3 | Md | Q1 | Q3 | ||||
| Age | ||||||||||||
| Householder | 40 | 25 | 61 | 45 | 28 | 69 | 47 | 39 | 55 | |||
| Spouse | 47 | 32 | 60 | 51 | 33 | 66 | 45 | 38 | 53 | |||
| Education (years) | ||||||||||||
| Householder | 11 | 8 | 12 | 12 | 8 | 12 | 16 | 12 | 18 | |||
| Spouse | 12 | 9 | 12 | 11 | 8 | 12 | 14 | 12 | 16 | |||
| Race (% White) | ||||||||||||
| Householder | 71.3 | 76.5 | 91.6 | |||||||||
| Spouse | 79.8 | 81.1 | 89.6 | |||||||||
| Sex (% Male) | ||||||||||||
| Householder | 36.6 | 39.3 | 78.4 | |||||||||
| Spouse | 22.2 | 20.3 | 19.0 | |||||||||
| Marital (% Married) | 12.2 | 17.1 | 88.2 | |||||||||
| Children <6 (%1+) | 12.2 | 11.5 | 15.9 | |||||||||
| Children <18 (%1+) | 22.0 | 21.0 | 42.5 | |||||||||
| Employment: (%) | ||||||||||||
| Householder | ||||||||||||
| Employed | 25.9 | 33.1 | 83.7 | |||||||||
| Not at Work/Laid off | 1.6 | 1.8 | 3.0 | |||||||||
| Unemployed | 5.8 | 4.4 | 1.1 | |||||||||
| Unable/Disabled | 12.1 | 9.8 | 0.5 | |||||||||
| Retired | 17.4 | 24.8 | 6.5 | |||||||||
| Other | 37.2 | 26.1 | 5.1 | |||||||||
| Spouse | ||||||||||||
| Employed | 23.1 | 22.1 | 72.5 | |||||||||
| Not at Work/Laid off | 1.6 | 1.4 | 3.2 | |||||||||
| Unemployed | 3.5 | 2.8 | 0.8 | |||||||||
| Unable/Disabled | 6.7 | 7.4 | 0.5 | |||||||||
| Retired | 20.4 | 24.4 | 4.8 | |||||||||
| Other | 44.7 | 41.8 | 18.2 | |||||||||
| Modal Occupations | Food Srvc Pers Srvc Retail |
Food Srvc Retail Pers Srvc |
Exec/Admin Mgmt Superv/Sales |
|||||||||
| Modal Industry | Retail/Const | Retail/Const | Prof/Ed Srvc | |||||||||
| Top 1% (N=10,163) |
Top 0.5% (N=5.047) |
Property Elite (N=5,668) |
||||||||||
|---|---|---|---|---|---|---|---|---|---|---|---|---|
| Md | Q1 | Q3 | Md | Q1 | Q3 | Md | Q1 | Q3 | ||||
| Age | ||||||||||||
| Householder | 50 | 42 | 57 | 50 | 43 | 59 | 61 | 50 | 71 | |||
| Spouse | 48 | 41 | 55 | 48 | 41 | 56 | 58 | 48 | 68 | |||
| Education (years) | ||||||||||||
| Householder | 16 | 15 | 18 | 16 | 15 | 18 | 16 | 13 | 18 | |||
| Spouse | 16 | 13 | 17 | 16 | 14 | 17 | 14 | 12 | 16 | |||
| Race (% White) | ||||||||||||
| Householder | 93.4 | 93.3 | 95.4 | |||||||||
| Spouse | 91.3 | 91.0 | 94.2 | |||||||||
| Sex (% Male) | ||||||||||||
| Householder | 78.8 | 79.7 | 73.6 | |||||||||
| Spouse | 20.2 | 19.2 | 17.5 | |||||||||
| Marital (% Married) | 90.7 | 90.6 | 75.11 | |||||||||
| Children <6 (%1+) | 14.0 | 13.1 | 5.8 | |||||||||
| Children <18 (%1+) | 38.4 | 36.1 | 18.2 | |||||||||
| Employment: (%) | ||||||||||||
| Householder | ||||||||||||
| Employed | 82.9 | 82.4 | 49.7 | |||||||||
| Not at Work/Laid off | 3.4 | 3.4 | 2.7 | |||||||||
| Unemployed | 0.9 | 0.7 | 0.8 | |||||||||
| Unable/Disabled | 0.4 | 0.4 | 1.0 | |||||||||
| Retired | 6.6 | 7.1 | 36.9 | |||||||||
| Other | 5.8 | 5.9 | 8.9 | |||||||||
| Spouse | ||||||||||||
| Employed | 70.6 | 70.6 | 40.2 | |||||||||
| Not at Work/Laid off | 3.8 | 3.5 | 2.8 | |||||||||
| Unemployed | 0.8 | 0.8 | 0.6 | |||||||||
| Unable/Disabled | 0.4 | 0.4 | 1.1 | |||||||||
| Retired | 5.2 | 5.6 | 28.2 | |||||||||
| Other | 19.1 | 19.0 | 27.2 | |||||||||
| Modal Occupations | Exec/Admin Med/Law Teachers |
Exec/Admin Medicine Insure/RE |
Exec/Admin Sales/Finance Teachers |
|||||||||
| Modal Industry | Prof/Health/Ed Srvc |
Prof/Health/Ed Srvc |
Prof/Health/Ed Srvc |
|||||||||
Only about a quarter of householders and spouses were employed during the week prior to the survey, although their unemployment rate of 5.8% for householders is not much above the national average of 5.5% during these years, and the unemployment rate of 3.5% for spouses is below the national average (Bureau of Labor Statistics 2009). Fully 2/3 of householders and 72% of spouses were out of the labor force, the majority for reasons other than disability and retirement. The modal occupations of those who were employed (both householders and spouses) are Food Services, Personal Services, and Retail. The modal industries are Retail Trade and Construction.
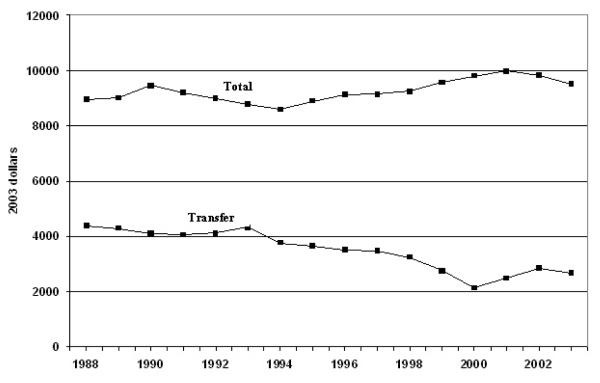
Median family income and income sources for the bottom quartile of family income are shown in Figure 2. Total family income for these families increased slightly over the sample period, from about $9,500 in 1988 to just under 10,000 in 2003. As with the bottom 10%, the only income source with non-zero median income is transfer income, which declined from about $4,500 in 1988 to $2,000 by 2003. Additional analyses (not shown) indicate that, like the bottom 10%, the important transfers are social security, supplemental security, and public assistance. From Table 1, we see that these families have a wide age range (the middle 50% of householders are between 28 and 69, the middle 50% of spouses are between 33 and 66). 61% of householders are female and only 17.1% are married. More than a fifth live with their unmarried children under 18. Half of householders had completed the equivalent of a High School education, and over half of spouses had not. Similar to the bottom 10% of families, most householders and spouses were not employed during the week prior to the survey, despite an unemployment rate well below the national average. As with the bottom 10%, the majority of householders and spouses were not in the labor force. About a quarter were retired, and another 26% of householders and 42% of spouses were not in the labor force for “other” reasons.7 Of those who were employed, the modal occupations and industries are the same as for families in the bottom 10%: Service occupations in Retail and Construction. Compared to the bottom 10%, families in the lower quartile are slightly older, and more likely to be employed or retired.
Figure 2.
Median Family Income and Components- Bottom 25% of Family Income
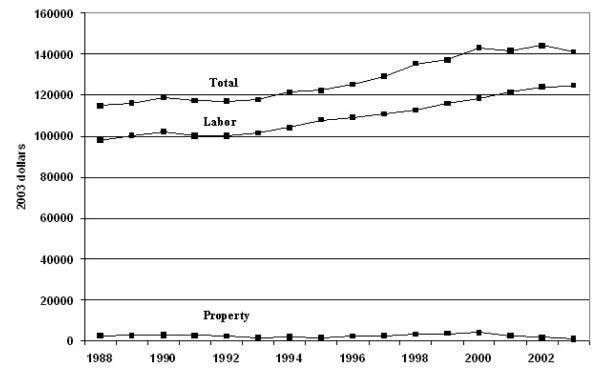
Median family incomes at the top of the distribution differ in important respects from those at the bottom. The top 10% of families are shown in Figure 3. Median family incomes are more than ten times those of the bottom quartile, and labor income accounts for over 80% of the total. Furthermore, median incomes have steadily increased over the period from just under $120,000 in 1988 to just over $140,000 in 2003. Property income appears as a very small component (1-2%). These families are very different from those at the bottom of the income distribution (see Table 1). Householder and spouse are about the same median age as families at the bottom of the distribution, but the age ranges are considerably narrower. The middle 50% of householders are between 39 and 55, their spouses between 38 and 53.
Figure 3.
Median Family Income and Components- Top 10% of Family Income
These families are overwhelmingly white (90%) and married (88%). Compared to families at the bottom of the distribution, they are more likely to have children under 18 at home (42.5% vs 22% and 21% for families at the 10th and 25th percentiles, respectively). More than three-quarters of householders are male (almost twice the percentage of families at the 10th and 25th income percentiles). Half of householders have 4 years of education beyond high school (the median is 16 years) and half of spouses have 2-4 years of education beyond high school.
Over 80% of householders were employed during the week prior to the survey as were almost three-quarters of spouses. Very few householders or spouses were unemployed (1.1% and 0.8%, respectively), and relatively few were not in the labor force (12.1% of householders, mostly retired; 23.5% of spouses, mostly for “other” reasons). Modal occupations for both householder and spouse were Executive and Management positions in Professional and Educational Services.
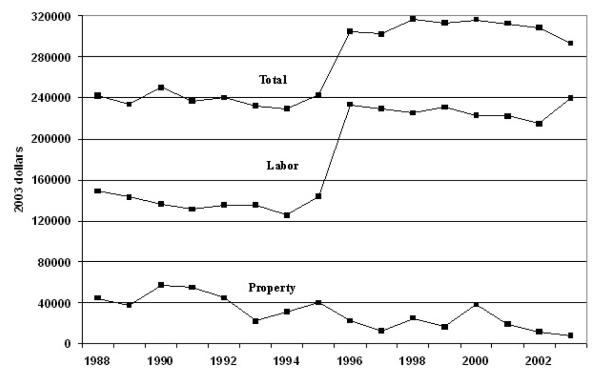
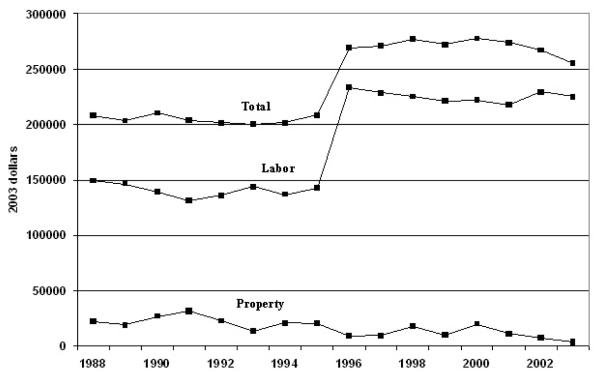
Median incomes for families in the top 1% are almost twice as high as for families in the top 10%, and, as with the top 10%, most (between 75% and 85%) are from earnings. Property income is about 10% of family income at the start of the period, but declines to about 2% by 2003. There is a sharp increase of about 33% in labor income (and about 25% in the total) between 1995 and 1996.8 The same rapid rise in labor incomes at the same time, and the same slow decline in property incomes were observed in entirely different data (income tax data for households) by Piketty and Saez (2006), who interpret this pattern as a sharp increase in executive compensation: “top executives…replaced top capital owners …at the top of the income hierarchy” in the U.S. (p. 204. Cf. Piketty and Saez, 2003; Kaplan and Rauh, 2007). Our data are not sufficiently detailed to confirm or refute this explanation. We note that our data do not show “capital owners” at “the top” of the income distribution, but there are few extremely high earners in the CPS (Kaplan and Rauh [2007] report incomes in the tens of millions of dollars). Because our results are for medians of top-coded data, the sharp rise we observe is consistent with this interpretation.
Families in the top 1% are similar to those in the top 10%: overwhelmingly white, married, two-earner families with children under 18 at home (See Table 1). They are slightly older and better educated (median schooling for both householder and spouse is 4 years beyond high school). As with the top 10%, over 80% of householders are employed, as are 70% of spouses. Also similar to the top 1%, about 1/8 of householders and 1/4 of spouses are not in the labor force. The majority of these householders are retired, and the majority of these spouses are out of the labor force for “other” reasons. Modal occupations are Executive and Administrative, Medicine, Law, and Teaching. Modal industries are Professional, Health, and Educational Services.
Families in the top 0.5% appear almost identical to those in the top1% (see Figure 5 and Table 1). They have somewhat higher total incomes but comparable labor incomes. Labor income is a smaller proportion of the total. Property income makes up the difference, though its contribution is relatively small. Trends in income components are the same as for income components of the top 1%, a large jump in labor income between 1995 and 1996, and slowly declining property income. Aside from their higher property income, not much distinguishes families in the top 0.5% from those in the top 1%. Age and educational distributions are the same, as are distributions of gender, race, marital status, children under 18, and employment status. Modal occupations differ only in that there’s a slight shift away from Law and Teaching and a corresponding shift into Insurance and Real Estate.
Figure 5.
Median Family Income and Components- Top 0.5% of Family Income
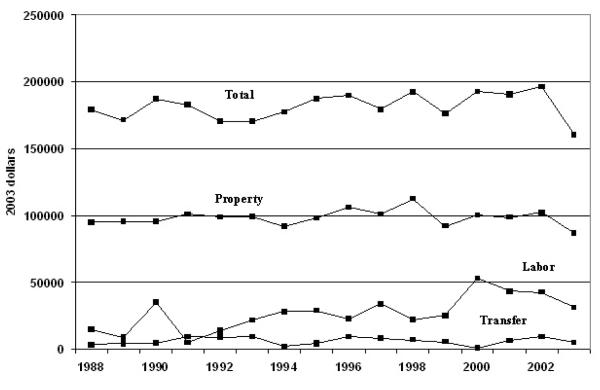
Median family income and income sources for the “Property Elite” are presented in Figure 6. Following Lenski (1966), this elite includes families whose income from wealth is at least twice the median family income from all sources. This elite comprises 0.5% of the families in our data, but these are not the families at the 99.5 percentile of family income. From Figure 6, we see that median family income is considerably lower, that labor income is a much smaller component, and that property income is a much larger component (over half) of the total. Transfers are a very small (2-3%) source of income for these families, mostly social security and retirement income. Labor income rises throughout the period, reflected in a small upward trend in the total.
Figure 6.
Median Family Income and Components- Lenski’s “Property Elite”
It is particularly notable that, unlike the incomes of the top 1% and 0.5%, labor income does not exhibit the sharp rise between 1995 and 1996, and property income does not exhibit the slow decline. If Piketty and Saez (2003, 2006) are correct in their interpretation of these patterns, the “property elite” are not well-compensated executives, the “working rich,” but more closely approximate the “coupon-clipping rentiers” (Picketty and Saez, 2003, p. 17).
These families are considerably older than those at the top of the family income distribution (25% of householders and spouses are over 71 and 68, respectively). Like families at the top, these families are white (95%), married or widowed (86%)9, with fewer children at home. In contrast to families at the top of the income distribution, just under half are employed (50% and 40% of householders and spouses, respectively). Most of those not employed are retired. This may account for the relatively large share of property income that they receive. These families report the same occupations as families at the top of the distribution, suggesting that the “property elite” are the top-income families a decade later.
Summary
Our examination of the bottom and top of the family income distribution found:
At the Bottom
Looking at medians, transfer income is a major income source for families in the 10th and 25th percentiles. Transfer income was largely from social security, supplemental security, and public assistance.
Families in the 10th and 25th percentiles are about 25% non-white, over 60% of householders are female, less than 20% are married, and just over 20% included children under 18. The inter-quartile age range of householders and spouses is quite wide, approximately 30 years. In terms of age, these families are quite diverse, consisting of both younger and older adults.
Typically, householders and spouses have, at most, a high-school education. Less than a third of householders and spouses were working in the week prior to the survey. Many are disabled (7-12%), many are retired (17-25%), most are not in the labor force. Typical jobs are low-level service or sales occupations.
At the Top
For families at the top of the income distribution, the major income source is employment. Property income is a relatively small and declining component of income for these families. In 1996, labor income sharply increased from the previous year, in both amount and as a proportion of the total, for families in the top 1% and 0.5%, but not for families in the top 10% of the income distribution.
Families in the top 10%, 1%, and 0.5% are overwhelmingly white and married, with two income earners. Half of householders were in their early 40s to late-50s. About 40% have children under 18 (and 13-16% have children under 6). Most have a college-level education and most are employed. Typical jobs for the top 10% of families are Executive and Management occupations; typical jobs for the top 1% and 0.5% are in these occupations, and also in Medicine, Law, and Teaching.
“Property Elite”
The “property elite” are high income families who receive about half of their income from wealth. Unlike the top 10%, 1%, and 0.5%, labor income is a relatively small, but increasing, proportion of the total. These families also receive transfer income, in the form of social security and retirement. Their median family income is higher than that of the top 10%, but lower than the top 1% and 0.5%.
Families in this “property elite” are typically older than families in the highest percentiles of the income distribution but, like them, are predominantly white and married (if one includes the widowed). They have fewer children living with them, and a larger proportion were not working in the week prior to the survey. Most of those are retired.
Conclusions and Implications
As anticipated, families at the bottom of the income distribution are disproportionately non-white, female, and non-married. These families consist of both young and old adults, with high-school educations or less, in low-level service occupations. Many are disabled, many are retired. Much of their income is in the form of transfers.
Also as anticipated, families at the top of the income distribution are typically white and married. Householders and spouses are typically middle-age with college educations, employed in professional service and managerial occupations. Although not directly comparable (families at the top of the income distribution are not the same as those at the top of the wealth distribution), these findings are consistent with Keister’s (2000, Table 4-4) findings with respect to the wealth distribution: the wealthiest 1% of households are predominantly white, middle aged, with at least a college education.
Not anticipated is the small contribution of property income to the total family income at the top, and the correspondingly large contribution of income from employment. Our findings do not support the argument that wealth is a primary source of income for families at the highest percentiles. The top 0.5% of families received a median of around $40,000 in property income in 1988 (of a median family income of $240,000), but this declined to $5,000 by 2003 (of a median family income of almost $300,000). The “property elite” do receive over half of their median family income from wealth, but that is by construction. Importantly, the highest income families during this period in the U.S. were not the “property elite”.
The decline in property income and increase in labor income among the highest income families does support the claim of Piketty and Saez (2003, 2006) that executive compensation has increased rapidly in recent years, while income from wealth has gradually declined. The decline in property income is also consistent with Keister’s (2000) finding that mean financial wealth of the top 1% declined between 1989 and 1995 (Table 4-1), and median net worth for families with income of $100,000 or more declined from 1983-1995 (Table 8-5).
How are we to understand the differences between families in the top 10%, 1% and 0.5% of the income distribution? Those in the top 1% are slightly older and better educated than those in the top 10%. We can speculate that those in the top 1% are perhaps further along in their careers and occupy higher executive positions. This would be consistent with Picketty and Saez’s (2003, 2006) explanation of the rapid rise in labor income for the top 1%.but not for the top decile. Alternatively, the top 1% may be more likely to be in the independent professions (Medicine, Law). The only notable difference between families in the top 1% and 0.5% are occupational. We can speculate that the top 0.5% of families are more likely to be self-employed instead of salaried, or simply higher-up in the executive hierarchy. These are areas of future research.
Our finding that age and retirement status are the major distinctions between the “property elite” and those at the very top of the family income distribution is unexpected. It is, however, consistent with Keister’s (2000, p. 232) finding of a life-cycle process whereby salaried and/or entrepreneurial professionals and executives invest high earnings during their careers, then draw income from these investments after retirement. Is this life-cycle process consistent with the theoretical meaning of “property elite”?
Lenski (1966, p.340) uses “property elite” to “understand the political activities of the propertied class [those who control economic resources]” in market systems. These “elite” are a “tiny minority” whose wealth constitutes an important source of economic and political power.
From this perspective, the extreme concentration of wealth in the U.S. has suggested that, despite the trappings of electoral democracy, real political power is concentrated among a small class of wealthy individuals and families (Domhoff 2002, Chapter 3; Lindblom 1977, Chapter 17). But the composition of this class is contentious. Does this class consists of a discrete set of individuals with a common class culture that reproduces itself from one generation to the next, (e.g., Domhoff 2002), or of a set of positions with common interests in property rights and “free enterprise,” that replicate over time along with other societal structures (e.g., Lindblom 1977)? It seems to us that a life-cycle process is consistent with either conceptualization. Families use their wealth to advance their children’s prospects – e.g., through institutional mechanisms described by Domhoff (2002). Alternatively, careers advance through merit or through luck..
Adjudication of these conceptualizations of a propertied class requires detailed information on wealth mobility, and on inheritance processes. We know of no existing data adequate for this purpose, but hope that continued interest in wealth research will promote the development of longitudinal wealth databases. .
Figure 4.
Median Family Income and Components- Top 1% of Family Income
Acknowledgments
We thank Don Hernandez, Kate Strully and two anonymous reviewers for comments on a previous draft.
Footnotes
Kinnickell (2006) includes vehicles as assets, but we regard these as consumer durables instead. The bottom 50% of families owned 26.8% of the value of vehicles in 2004 (Kinnickell, 2006, Table 11a).
Detailed income sources are not available prior to 1988.
Details of the aggregation are available on request.
These were retrieved from <http://www.census.gov/hhes/income/income03/cpiurs.html> on 1/14/07.
The large gaps between median total income and the sum of the median sources of income is due to the fact that the median of a sum is not the same as the sum of medians.
Temporary Assistance for Needy Families (TANF), which took effect in 1997, may be partly responsible for the sudden drop in transfer income for the bottom 10% after 1997.
“Other” includes armed forces, unemployed and not looking for work, and other.
In 1996, the CPS changed some aspects of its sampling procedures, but this discontinuity remains after adjustment for sampling proportions using the family weights included with the data.
10.6 percent are widowed (not shown).
A previous version of this paper was presented at the Annual Meetings of the American Sociological Association in Boston, August 4, 2008.
Publisher's Disclaimer: This is a PDF file of an unedited manuscript that has been accepted for publication. As a service to our customers we are providing this early version of the manuscript. The manuscript will undergo copyediting, typesetting, and review of the resulting proof before it is published in its final citable form. Please note that during the production process errors may be discovered which could affect the content, and all legal disclaimers that apply to the journal pertain.
Contributor Information
Lawrence E. Raffalovich, Department of Sociology University at Albany, SUNY
Shannon M. Monnat, Department of Sociology University of Nevada - Las Vegas
Hui-shien Tsao, Center for Social and Demographic Analysis University at Albany, SUNY.
REFERENCES
- Browne Irene. Explaining the Black-White Gap in Labor Force Participation among Women Heading Households. American Sociological Review. 1997;62:236–252. [Google Scholar]
- Bureau of Labor Statistics [Retrieved 6/25/09];2009 http://www.bls.gov/cps/cpsaat1.pdf.
- CPS utilities [electronic resource]: March files. Unicon Research Corporation; Santa Monica, CA: 2004. [Google Scholar]
- Current Population Survey [Retrieved 1/14/07];Design and Methodology. Technical Paper 63RV. 2002 http://www.census.gov/prod/2002pubs/tp63rv.pdf.
- Domhoff G. William. Who Rules America? Fourth Edition McGraw-Hill; Boston: 2002. [Google Scholar]
- Gates WH, Sr., Collins C. Wealth and Our Commonwealth: Why Americans Should Tax Accumulated Fortunes. Beacon Press; Boston: 2002. [Google Scholar]
- Kaplan Steven N., Rauh Joshua. [retrieved 1/14/07];Wall Street and Main Street: What Contributes to the Rise in the Highest Incomes? 2007 NBER Working Paper 13270. http://www.nber.org/papers/w13270.
- Keister Lisa A. Wealth in America: Trends in Wealth Inequality. Cambridge University Press; Cambridge: 2000. [Google Scholar]
- Kennickell Arthur B. [Retreived 1/14/07];Currents and Undercurrents: Changes in the Distribution of Wealth, 1989-2004. 2006 http://www.federalreserve.gov/pubs/oss/oss2/papers/concentration.2004.5.pdf.
- Lenski Gerhard. Income Stratification in the United States. Research in Social Stratification and Mobility. 1984;3:173–205. [Google Scholar]
- Lenski Gerhard. Power and Privilege. McGraw-Hill; New York: 1966. [Google Scholar]
- Lindblom Charles. Politics and Markets. Basic; New York: 1977. [Google Scholar]
- Oliver Melvin L., Shapiro Thomas M. Black Wealth/White Wealth: a New Perspective on Racial Inequality. Routledge; New York: 1997. [Google Scholar]
- Piketty Thomas, Saez Emmanuel. Income Inequality in the United States, 1913-1998. The Quarterly Journal of Economics. 2003;98:1–39. [Google Scholar]
- Piketty Thomas, Saez Emmanuel. The Evolution of Top Incomes: A Historical and International Perspective. American Economic Association Papers and Proceedings. 2006;96:00–205. [Google Scholar]
- Rivlin AM. Reviving the American Dream: the Economy, the States, and the Federal Government. The Brookings Institute; Washington, D.C.: 1992. [Google Scholar]
- Shapiro Thomas. The Hidden Cost of Being African American: How Wealth Perpetuates Inequality. Oxford; New York: 2004. [Google Scholar]
- Wolf Edward N. Top Heavy. The New York Press; New York: 2002. [Google Scholar]


