Abstract
We report that Heat shock protein 90 (Hsp90) inhibitors selectively kill Diffuse Large B-cell Lymphomas (DLBCL) that are biologically dependent on the Bcl6 transcriptional repressor. Endogenous Hsp90 was found to interact with Bcl6 in DLBCL cells and could stabilize both Bcl6 mRNA and protein. Hsp90 formed a complex with Bcl6 at its target promoters and Hsp90 inhibitors de-repressed Bcl6 target genes. A stable mutant of Bcl6 rescued DLBCL cells from Hsp90 inhibitor induced apoptosis. Bcl6 and Hsp90 were almost invariantly co-expressed in the nuclei of primary DLBCL cells, suggesting that their interaction is relevant in this disease. We examined the pharmacokinetics, toxicity and efficacy of PU-H71, a recently developed purine derived Hsp90 inhibitor. PU-H71 preferentially accumulated in lymphomas compared to normal tissues and selectively suppressed Bcl6-dependent DLBCLs in vivo, inducing reactivation of key Bcl6 target genes and apoptosis. PU-H71 also induced cell death in primary human DLBCL specimens.
Keywords: B-cell lymphoma, Hsp90, Bcl6, targeted therapy
Introduction
The molecular chaperone heat-shock protein 90 (Hsp90) is an emerging therapeutic target for cancer. Hsp90 promotes the proper folding, assembly, and transportation of client proteins across cellular compartments1. Loss of Hsp90 chaperone activity may result in misfolding of client proteins, ultimately leading to their ubiquitylation and proteasomal degradation2. A number of signaling pathway mediators involved in cell growth and survival, as well as aberrant oncogenic fusion proteins, are substrates of Hsp90 and are depleted when tumor cells are exposed to Hsp90 inhibitor drugs1,3–6.
Because of these activities, several Hsp90 inhibitors are under investigation as anti-cancer agents7. The benzoquinone ansamycin 17-AAG was the first to enter clinical trials; however, its hepatotoxicity and limited solubility and stability led to the development of derivative compounds such as 17-DMAG and IPI-5047. Side effects remain a concern for these newer ansamycins because it has not been possible to eliminate the toxic benzoquinone ring without affecting their activity7. In order to avoid these pitfalls, Chiosis and collaborators designed Hsp90 inhibitors using purine (PU) as a scaffold5,8. Optimized water-soluble members of the PU-class of Hsp90 inhibitors have recently been synthesized9–11, among which PU-H71 is the most potent compound in its class12.
Relatively little is known about the contribution of Hsp90 or the efficacy of Hsp90 inhibitors in the more common types of lymphoid malignancies such as diffuse large B-cell lymphomas (DLBCL), which are derived from germinal center B-cells13. The Bcl6 (B-cell Lymphoma 6) transcriptional repressor is the most frequently involved oncoprotein in DLBCL14. The oncogenic effects of Bcl6 are related to its ability to directly repress critical genes such as ATR (Ataxia telangiectasia and Rad3-related) and TP53 (tumor protein p53)15,16. In approximately 40% of DLBCLs, constitutive Bcl6 expression is associated with translocations or mutations of its promoter14. However, many other DLBCLs express Bcl6 in the absence of genetic lesions, suggesting that other factors can also sustain Bcl6 expression. Regardless of whether the BCL6 locus is mutated, the continued presence of the Bcl6 protein is required to sustain proliferation and survival of DLBCL cells17,18. It was recently shown that Hsp90 is frequently expressed in primary DLBCLs19. We hypothesized that sustained Bcl6 expression in DLBCL could be regulated by Hsp90 activity, in which case, Hsp90 inhibition would affect the maintenance of the malignant phenotype by Bcl6.
Results
Hsp90 inhibitors induce apoptosis in Bcl6-dependent B-cell lymphomas
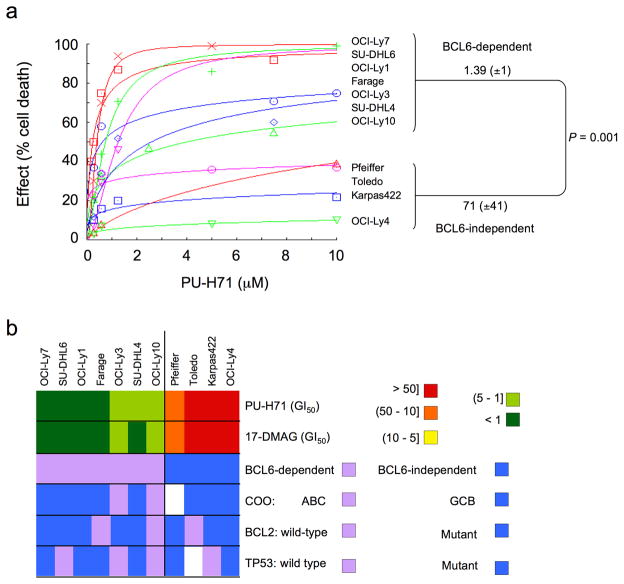
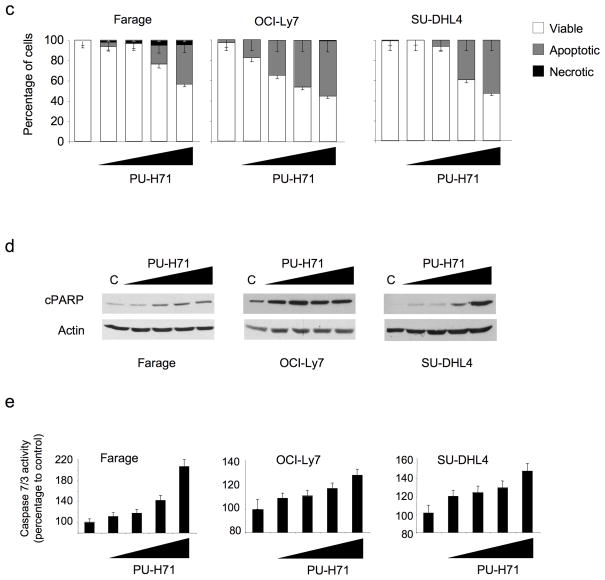
In order to determine the anti-lymphoma activity of Hsp90 inhibitors, a panel of DLBCL cell lines was exposed to increasing concentrations of PU-H71. DLBCLs can be divided into subtypes with distinct gene expression signatures and response to drugs and biological agents. One system for dividing DLBCLs classifies them according to their expression of B-cell receptor (BCR) or oxidative phosphorylation genes20. The BCR DLBCLs display coordinated repression of Bcl6 target genes, depend on Bcl6 for their survival20 and are preferentially sensitive to Bcl6 targeting by specific peptides17,21 and small-interfering RNA (Supplementary Fig. 1). In response to PU-H71, Bcl6-dependent DLBCL cell lines showed decreased growth compared to Bcl6-independent DLBCL cell lines (Fig. 1). The concentration of PU-H71 that inhibited the growth of the cell lines by 50% compared to control (GI50) in BCcl6-dependent DLBCLs was 1.39 μM (± 1.00 μM) compared to a GI50 of 71 μM (± 41 μM) in the Bcl6-independent group (P = 0.001, T test) (Fig. 1a). Other features such as abundance of Hsp90-α or Hsp90-β, BCL2 translocation, TP53 mutation status or the activated B-cell (ABC) or germinal center B-cell (GCB) type gene expression signatures were not associated with the differential response of these cell lines to Hsp90 inhibition (Fig. 1b, Supplementary Fig. 2 and Supplementary Table 1). An identical effect was shown with the Hsp90 inhibitor 17-DMAG (Fig. 1b and Supplementary Table 1). PU-H71 killed DLBCL cells in a dose-dependent manner, preferentially through induction of apoptosis, as shown by nuclear fragmentation observed in ethidium bromide/acridine orange staining, PARP (poly (ADP-ribose) polymerase) cleavage and induction of caspase 7 and 3 activity (Fig. 1c–e).
Figure 1.
Hsp90 inhibition induces apoptosis preferentially in Bcl6-dependent DLBCL. (a) A panel of seven Bcl6-dependent (OCI-Ly7, SU-DHL6, OCI-Ly1, Farage, OCI-Ly3, SU-DHL4 and OCI-Ly10) and four Bcl6-independent (Pfeiffer, Toledo, Karpas422 and OCI-Ly4) DLBCL cell lines were exposed to PU-H71 (from 0.1 to 10 μM) or vehicle control (water) for 48 h and analyzed for viability. Dose-response curves were plotted. The X-axis shows the dose of PU-H71 in μM. The Y-axis shows the effect of PU-H71 as compared to control on cell viability. The goodness of fit for the experimental data to the median-effect equation (linear correlation coefficient) obtained from the logarithmic form of this equation was equal to or higher than 0.90 for each curve. (b) A graphical heat map representation of PU-H71 and 17-DMAG GI50 values. The color reference for each dose range (in μM) is shown on the right. Other cell features are shown in the successive rows. (c) Farage, OCI-Ly7, and SU-DHL4 cells treated for 24 h with control (first lane) or increasing concentrations of PU-H71 (0.1, 0.25, 0.5 and 1 μM) were examined by acridine orange/ethidium bromide staining to categorize the morphological aspect of dead cells. Percentages for each type of dead (apoptotic-like or necrotic in grey and black respectively) and viable cells (white) from triplicate experiments are shown. For each triplicate we categorized at least 300 cells per experimental condition. (d) Immunoblot showing the major fragment of PARP cleavage (89 kD) resulting from caspase activity in cells treated as in (c). (e) Caspase 7 and 3 activity (represented as percentage compared to control) was measured by the cleavage of a specific pro-fluorescent substrate in cells treated as in (c). The Y-axis indicates the caspase 7 and 3 activity over cell number determined by multiplexing with a metabolic assay. Results represent the mean of four biological replicates each of which was performed in experimental triplicates.
Hsp90 maintains the stability of the Bcl6 protein
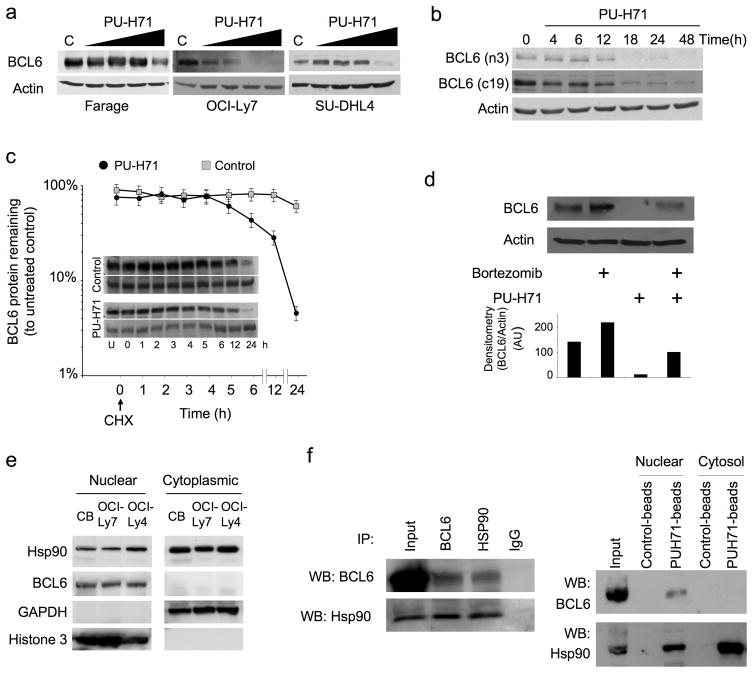
Because the Bcl6-dependent DLBCL subtype was particularly susceptible to Hsp90 inhibition we wondered whether Bcl6 might be an Hsp90 client. Along these lines we found that a 24 h exposure to PU-H71 induced a dose-dependent reduction in Bcl6 protein abundance in Farage, OCI-Ly7 and SU-DHL4 Bcl6-dependent DLBCL cells (Fig. 2a). PU-H71 also induced the depletion of the known Hsp90 client proteins c-Raf22, Akt23 and NEMO (NF-kappa-B essential modifier)24 as well as a compensatory increase in Hsp70 (Heat shock protein 70) (Supplementary Fig. 3a). In addition, PU-H71 induced a similar pattern of dose-dependent changes in protein abundance, including Bcl6 depletion, in the Bcl6-independent DLBCL cell lines (Toledo, Pfeiffer and Karpas422) (Supplementary Fig. 3b). To determine the kinetics of PU-H71-induced Bcl6 protein depletion, we treated OCI-Ly7 cells with 0.5 μM PU-H71 for 4, 6, 12, 18, 24 and 48 h. After 18 h of treatment, Bcl6 was barely detectable (Fig. 2b) using two different antibodies for Bcl6 (N3 and C19). PU-H71 accelerated Bcl6 protein decay after protein translation blockade by Cycloheximide. Relative Bcl6 protein abundance decreased from 100% to 50% in 5 h (± 1 h) in the presence of PU-H71 compared to 24 h (± 2 h) in vehicle-treated cells (Fig. 2c). PU-H71-induced downregulation of Bcl6 was also partially blocked by treatment with the proteasome inhibitor Bortezomib (Fig. 2d).
Figure 2.
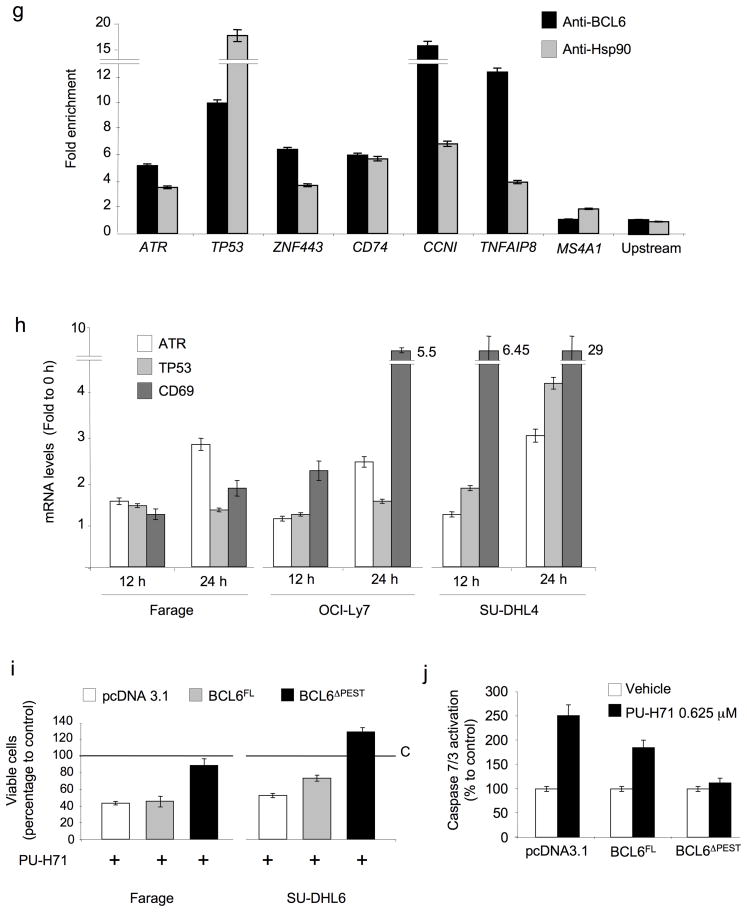
Bcl6 is an Hsp90 client protein. (a) Bcl6 and actin immunoblots performed in Farage, OCI-Ly7 and SU-DHL4 cell lines exposed for 24 h to increasing concentrations of PU-H71 (0.1, 0.25, 0.5 and 1 μM). (b) Western blots for Bcl6 were performed with two different antibodies (N3 and C19, against n –and c– terminal domains respectively) and for actin in OCI-Ly7 cells at the indicated time points after exposure to 0.5 μM of PU-H71. (c) Control or PU-H71-treated OCI-Ly7 cells were incubated with 5 μM Cycloheximide (CHX) for the indicated periods of time. Untreated cells were used as control. Immunoblots for Bcl6 (top) and actin (bottom) are shown for each time point and treatment condition (inset). The relative amount of total Bcl6 to actin was quantified by densitometry (Y-axis) and plotted with respect to time (X-axis). The Bcl6 to actin level in untreated cells (U) was defined as 100%. A similar result was obtained in SU-DHL4 and Farage cells (not shown). (d) PU-H71-treated (0.5 μM for 24 h) OCI-Ly7 cells were exposed to 1 μM of Bortezomib for 24 h and cell lysates analyzed by immunoblot for Bcl6 and actin. The relative amount of total Bcl6 to actin was quantified by densitometry (bottom). (e) Nuclear and cytoplasmic fractions from human centroblasts (CB), OCI-Ly7 and OCI-Ly4 were immunoblotted to determine the abundance of Hsp90 and Bcl6 proteins. Glyceraldehyde 3-phosphate dehydrogenase (GAPDH) and Histone 3 were used as control for the cytoplasmic and nuclear compartments respectively. (f) (Left): OCI-Ly7 nuclear extracts were immunoprecipitated with antibodies for Bcl6, Hsp90 or IgG (Immunoglogublin G as control) and immunoblotted for Bcl6 (top) and Hsp90 (bottom). Nuclear extract lysates were used as input. (Right) OCI-Ly7 nuclear and cytoplasmic extracts were precipitated with control– or PU-H71– coated agarose beads followed by blotting for Bcl6 (top) or Hsp90 (bottom). (g) Quantitative chromatin immunoprecipitation assays performed with Bcl6 or Hsp90 specific antibodies v IgG control for six known Bcl6 target genes (ATR, TP53, ZNF443, CD74, CCNI and TNFAIP8). A TP53 upstream primer set and MS4A1 were used as negative controls. Results are expressed as fold enrichment calculated as the percentage of input for the specific antibody (Bcl6 or Hsp90) over IgG control. Experiments were performed in biological triplicates with triplicate QPCR measurements. (h) The transcript abundance of ATR, TP53 and CD69 was measured by QPCR in Farage, OCI-Ly7 and SU-DHL4 cells exposed to 0.5 μM of PU-H71. Results are expressed as fold change compared to baseline (time 0 h) and were normalized to GAPDH. Experiments were performed five times, each with duplicate QPCR measurements. (i) Viability of Farage and SU-DHL6 cells transfected with pcDNA3.1, BCL6FL and BCL6ΔPEST and treated with PU-H71 0.625 μM for 24 h. Results are expressed as percentage to control from triplicate experiments. (j) Caspase 7 and 3 activity (represented as percentage compared to control) was measured by the cleavage of a specific pro-fluorescent substrate in Farage cells transfected with pcDNA3.1, BCL6FL and BCL6ΔPEST and treated with control (white bars) or PU-H71 0.625 μM (black bars) for 24 h. The Y-axis indicates the caspase 7 and 3 activity over cell number determined by multiplexing with a metabolic assay to control.
Hsp90 forms a complex with Bcl6
For Bcl6 to be a direct molecular client of Hsp90, the two proteins would need to interact, and yet Hsp90 is usually cytoplasmic in normal cells, while Bcl6 is localized in the cell nucleus. However, Hsp90 was localized to both the cytoplasmic and nuclear fractions of Bcl6-dependent and -independent DLBCLs, as well as primary germinal center B-cells (centroblasts) (Fig. 2e). Moreover, the endogenous Bcl6 and Hsp90 proteins were co-immunoprecipitated from the nuclear fraction of OCI-Ly7 cells (Fig. 2f). The Bcl6-Hsp90 complex also co-precipitated in the nuclear fraction of DLBCL cells using PU-H71-coated agarose beads (Fig. 2f), indicating that the drug forms a complex with these two interacting proteins. Protein affinity chromatography experiments using PU-H71-coated agarose beads and in vitro-translated Hsp90 and Bcl6 truncation mutants, revealed that it is the middle repression domain of Bcl6 that mediates binding to Hsp90 (Supplementary Fig. 4). Bcl6 mediates its biological activity by repressing its target genes, therefore we wondered whether Hsp90 might form part of a promoter-associated Bcl6 repression complex. Quantitative ChIP assays revealed the presence of both proteins at each of the six Bcl6 targets examined including the critical targets ATR and TP53, as well as ZNF443 (zinc finger protein 443), CD74 (CD74 molecule, major histocompatibility complex, class II invariant chain), CCNI (cyclin I) and TNFAIP8 (tumor necrosis factor, alpha-induced protein 8) (Fig. 2g). Neither protein was present at an upstream region of the TP53 locus, nor at the MS4A1 (membrane-spanning 4-domains, subfamily A, member 1) promoter. Moreover, the mRNA abundance of the Bcl6 target genes ATR, TP53 and CD69 was de-repressed by PU-H71 in a time-dependent manner (Fig. 2h). Hsp90 may thus function as a corepressor for Bcl6 by maintaining it in a stable conformation directly within Bcl6 repression complexes.
Bcl6 degradation is required for PU-H71 mediated cell death in Bcl6–dependent DLBCL cells
A significant reduction in Bcl6 protein was evident as soon as 4 h after PU-H71 treatment, prior to any evidence of cell death (Supplementary Fig. 5a), indicating that Bcl6 degradation induced by PU-H71 precedes cell death. Moreover, exposure of DLBCL cells to Bcl6 peptide inhibitors17 induced cell death without inducing Bcl6 degradation (Supplementary Fig. 5b), showing that Bcl6 degradation does not necessarily accompany apoptosis in DLBCL cells. To determine whether the sensitivity of Bcl6-dependent DLBCL cells to Hsp90 inhibition was dependent on Bcl6 degradation we examined whether a proteosome-resistant form of Bcl6 could rescue the actions of PU-H71. We first transfected NIH-3T3 cells with a Bcl6 mutant that is more resistant to proteasomal degradation since it lacks the PEST domain25 (BCL6ΔPEST), which is located in the middle region of Bcl6. BCL6ΔPEST was more resistant to PU-H71-induced degradation than full length Bcl6 (BCL6FL) (Supplementary Fig. 6a,b). PU-H71-beads also preferentially precipitated BCL6FL v BCL6ΔPEST (Supplementary Fig. 6c). Most importantly, transfection of BCL6ΔPEST into Farage DLBCL cells more completely rescued the cell killing and caspase 7 and 3 activation effects of PU-H71 compared to transfection of BCL6FL (Fig. 2i,j and Supplementary Fig. 6d,e). A similar effect on cell viability was obtained in SU-DHL6 cells (Fig. 2i). The data indicate that even though Hsp90 blockade leads to degradation of several proteins, its most therapeutically relevant target protein in the context of DLBCL is Bcl6.
Hsp90 maintains the stability of Bcl6 mRNA
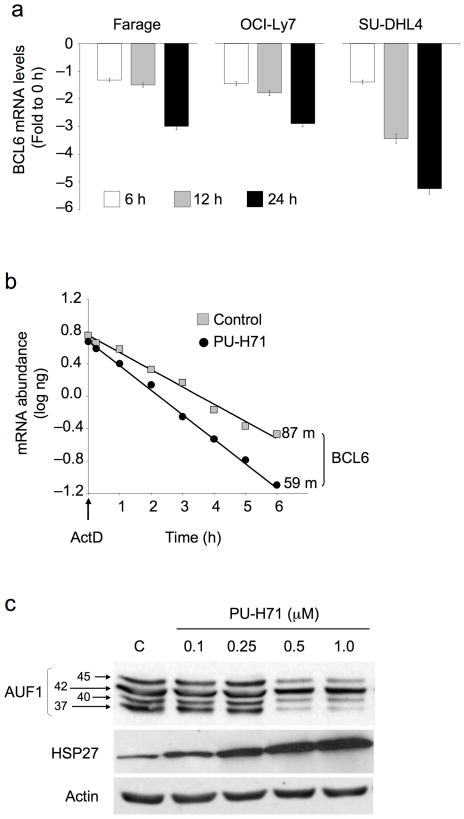
Since a proteosome inhibitor only partially rescued PU-H71 depletion of Bcl6 (Fig. 2d), we wondered whether Hsp90 might also block degradation of Bcl6 mRNA. We exposed DLBCL cells to 0.5 μM of PU-H71 for 6, 12 and 24 h and measured Bcl6 mRNA levels by QPCR. Bcl6 mRNA was reduced in a time-dependent manner (up to 3 to 5.3 fold) at 24 h compared to untreated controls (Fig. 3a). Exposure of OCI-Ly7 cells to the transcriptional inhibitor Actinomycin D in the presence of PU-H71 reduced the half-life of Bcl6 mRNA to 59 min as compared to 87 min in vehicle-treated cells, representing a 32% increase in decay rate (Fig. 3b). Heat shock factors can protect certain mRNAs containing AU-rich elements (ARE) in their 3′ untranslated regions (UTR)26 and Hsp90 inhibitors can reduce the stability of certain ARE-containing cytokine transcripts27. Analysis of the BCL6 3′ UTR revealed the presence of a putative ARE sequence (AUUUA) between nucleotides 3162 and 3168 (not shown). The decay of ARE containing mRNAs can be induced by ARE binding proteins such as the heat shock protein 27 (Hsp27) and can be prevented by the p37AUF1, p40AUF and p45AUF1 isoforms of AUF1 (AU-rich element RNA-binding protein 1)26,28–30. Accordingly, PU-H71 increased the levels of Hsp27 and decreased the levels of p37AUF1, p40AUF1 and p45AUF1 in a dose-dependent manner (Fig. 3c).
Figure 3.
Hsp90 prevents BCL6 mRNA decay. (a) The relative abundance of BCL6 mRNA was determined by QPCR in Farage, OCI-Ly7 and SU-DHL4 cell lines at baseline and 6, 12 and 24 h after treatment with PU-H71 0.5 μM. Results are expressed as fold difference compared to baseline (time 0 h) and were normalized to GAPDH. Experiments were performed five times, each with duplicate QPCR measurements. (b) OCI-Ly7 cells were treated with PU-H71 0.5 μM or control for 2 h, followed by Actinomycin D (ActD) for the indicated times to block transcription. Bcl6 mRNA abundance was determined by QPCR using a standard curve. The plot averages three independent experiments for half-life derivation. Results are expressed as mRNA abundance (log ng) normalized to untreated cells. Bcl6 mRNA half-life in minutes is shown for both experimental conditions. (c) OCI-Ly7 cells were exposed to the indicated concentrations of PU-H71 (or control) and immunoblotted for the ARE-binding proteins p45AUF1, p42AUF1, p40AUF1, p37AUF1 and Hsp27. Actin was used as a control.
Hsp90 and Bcl6 are co-expressed in DLBCL primary tumors
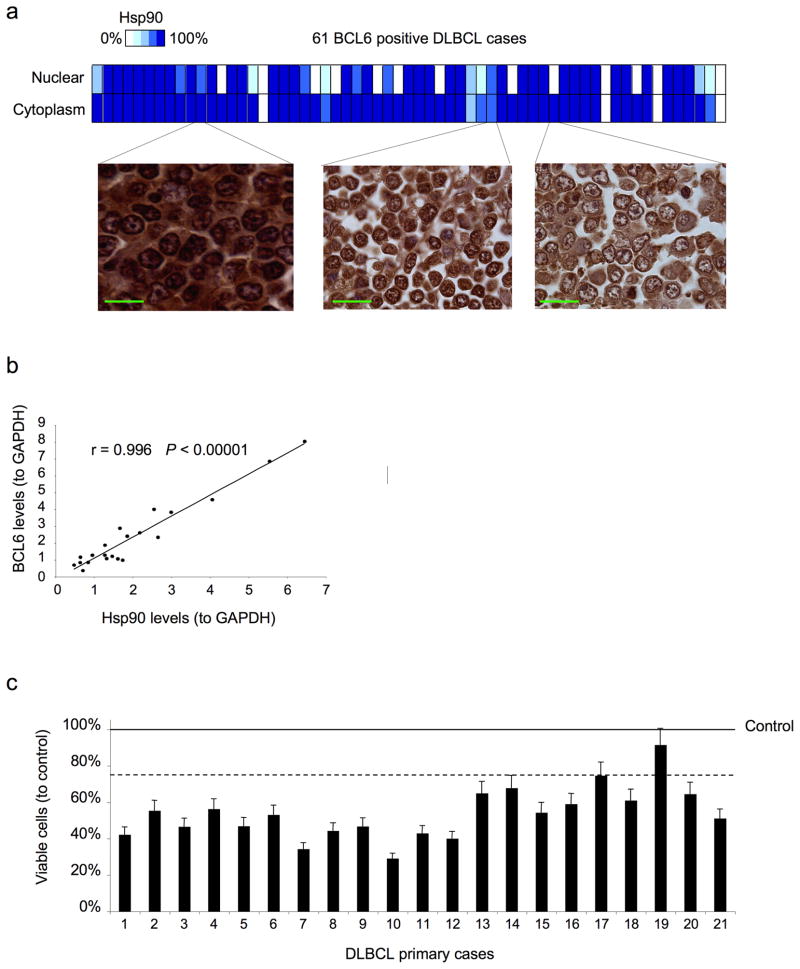
In order to determine whether Hsp90 and Bcl6 are co-expressed in primary DLBCLs we examined a panel of 70 DLBCL cases by immunohistochemistry. Sixty out of 70 (85.7%) patients expressed high levels of Hsp90, which is similar to the reported incidence of Hsp90 expression19. Sixty-one out of 70 (87.1 %) cases were positive for Bcl6. Fifty-seven cases (81.4 %) were positive for both Hsp90 and Bcl6 (Fig. 4a) and there was a strong association between these two proteins (P = 0.00011 by Fisher’s exact test). In DLBCL primary cases Hsp90 was found expressed in both nuclear and cytoplasmic compartments (Fig. 4a). In addition, single cell suspensions from 21 DLBCL biopsy specimens were subjected to Bcl6 and Hsp90 immunoblotting. In accordance with the immunohistochemistry data, we found a strong linear correlation between Bcl6 and Hsp90 levels in these samples (r = 0.996, P < 0.00001, Spearman’s correlation) (Fig. 4b). Therefore, co-expression of Bcl6 and Hsp90 is physiologically relevant in primary DLBCL tumors.
Figure 4.
Hsp90 is expressed in the nuclear and cytoplasmatic compartments of DLBCL and primary cells respond to PU-H71. (a) The expression and cellular compartmentalization of Hsp90 was determined by immunohistochemistry in a panel of 70 DLBCLs. The heat map shows the percentage of expression of Hsp90-β for the nuclear and cytoplasmic compartments in the 61 Bcl6 positive DLBCL cases. Three representative images showing different percentages of nuclear and cytoplasmic localizations are shown on the left. The bars represent 25 μm. (b) Correlation between the normalized (to GAPDH) protein levels of Bcl6 and Hsp90 from single cell suspensions obtained from lymph node biopsies of 21 patients diagnosed with DLBCL. Cell lysates were immunoblotted with specific antibodies and analyzed by densitometry. (c) Cases in (b) were treated with either PU-H71 2.5 μM (bars) or control (line) for 48 h. The Y-axis represents the percent of viable cells compared to control (vehicle), which is represented by the line at 100%. Error bars represent the standard error of the mean for triplicates.
PU-H71 can kill primary human DLBCL cells
Since PU-H71 is a candidate molecule for the treatment of human lymphomas and because biological features may differ between cell lines and primary cells, we wished to know whether primary DLBCLs could also respond to this drug. Single cell suspensions from 21 DLBCL biopsy specimens were exposed to 2.5 μM PU-H71 or vehicle control for 48 hours. Among the 21 DLBCLs, 19 cases displayed greater than 25% loss of viability in response to PU-H71 compared to their respective vehicle-treated controls, demonstrating that responsiveness to PU-H71 is not limited to cell lines (Fig. 4c). Although we detected Bcl6 in all the cases analyzed (Fig. 4b) and the majority of the Bcl6 positive DLBCLs are Bcl6 dependent21, two cases did not respond to 2.5 μM PU-H71. Additional factors, such as sample heterogeneity and proportion of non-tumor cells may also affect the response to the drug.
PU-H71 is preferentially retained in DLBCL xenografts
Hsp90 inhibitors including PU-H71 display preferential uptake in solid tumors compared to normal tissues6,7. To investigate whether a similar effect occurs in DLBCLs, PU-H71 75 mg per kg body weight was administered intraperitoneally to mice bearing 1 cm3 Farage, OCI-Ly7 and Toledo DLBCL xenografts. Animals were sacrificed at 6, 12 and 24 h after PU-H71 administration along with controls. The serum, tumor and normal tissues in Farage and tumor tissues in OCI-Ly7 and Toledo were analyzed for PU-H71 concentration by HPLC-MS. In the Farage mice, PU-H71 was preferentially retained in DLBCLs compared to normal tissues at pharmacologially relevant concentrations at all timepoints (42.1 μg g−1 at 6 h, 27.6 μg g−1 at 12 h and 12 μg g−1 at 24 h) (Supplementary Fig. 7). At 12 h the tumor concentration of PU-H71 was between 11.2 and 125.6 times higher than in normal tissues and PU-H71 was undetectable in serum after the 6 h timepoint. The concentrations of PU-H71 were similar in all of the DLBCL xenografts (Farage, OCI-Ly7 and Toledo) regardless of their response to the drug (Supplementary Fig. 7).
PU-H71 potently suppresses DLBCLs in vivo
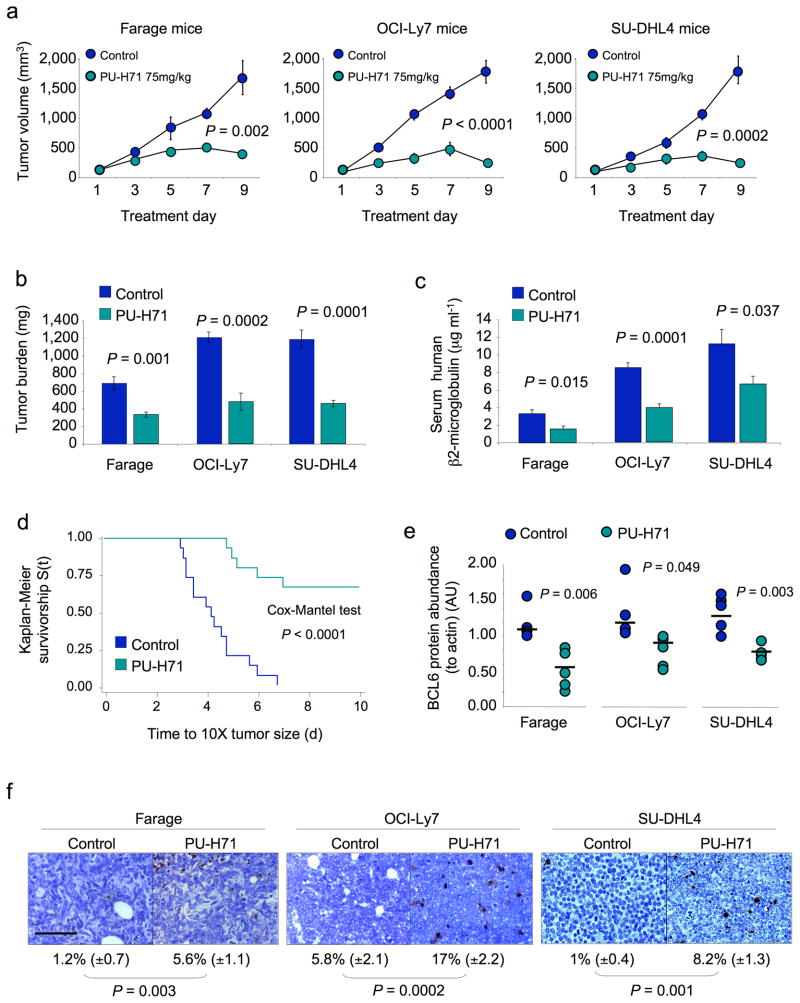
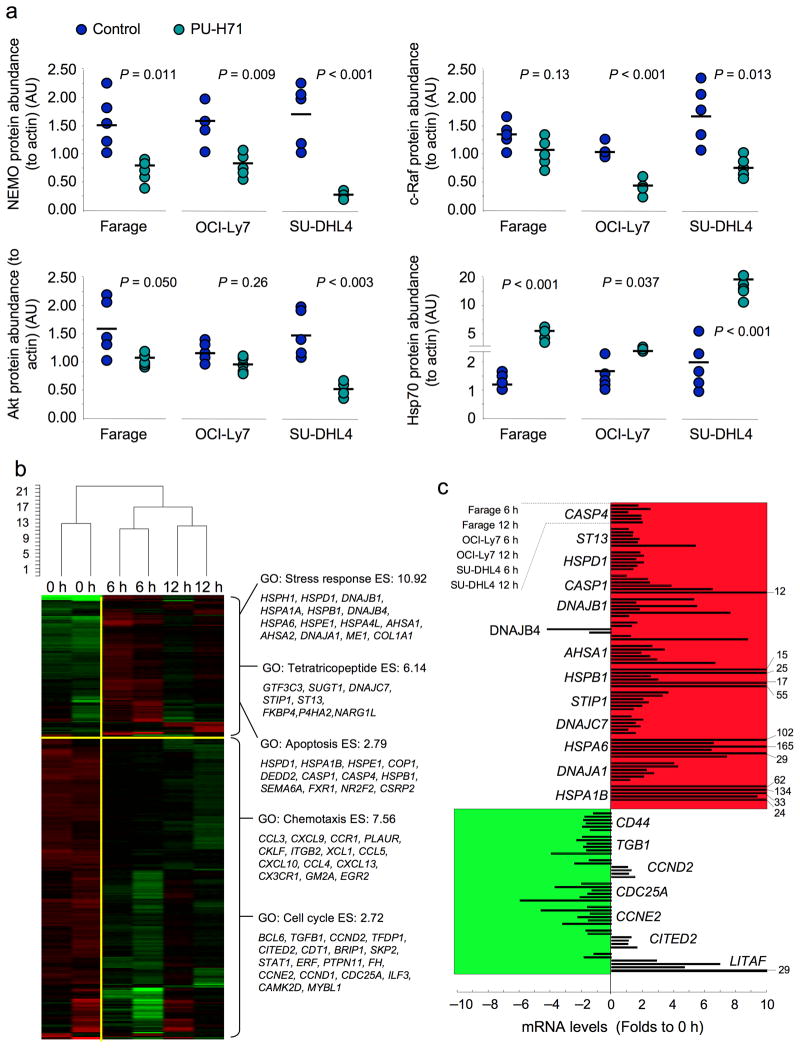
In order to determine the efficacy of PU-H71 in vivo, Farage, OCI-Ly7 and SU-DHL4 DLBCL xenografts were established in ten SCID mice each (total n = 30). Once palpable tumors were detected, pairs of mice were randomized to receive either PU-H71 75 mg per kg body weight per day (n = 5 per cell line) or vehicle (n = 5 per cell line). Animals were sacrificed when two or more controls reached the maximum tumor burden permitted in our animal protocol. Compared to control, PU-H71 potently reduced DLBCL size and weight (Fig. 5a,b). The serum levels of human β2-microglobulin, a marker of tumor burden, were also reduced by PU-H71 (Fig. 5c). Using tumor growth to critical mass as a surrogate for survival, PU-H71 (n = 15) significantly prolonged the survival v controls (n = 15) (Cox’s F test, P < 0.0001; Fig. 5d). In contrast, PU-H71 had no effect on the Bcl6-independent DLBCL Toledo xenografts at a similar dose (Supplementary Fig. 8). PU-H71 induced depletion of Bcl6 protein in the tumor xenografts (Fig. 5e and Supplementary Fig. 9a) and increased the fraction of cells undergoing apoptosis as detected by TUNEL assay and PARP cleavage (Fig. 5f and Supplementary Fig. 9a). Similar to its effects in vitro, PU-H71 decreased the abundance of c-Raf, Akt and NEMO and induced Hsp70 in the DLBCL xenografts (Fig. 6a and Supplementary Fig. 9b). There was no evidence of toxicity from behavioral, macroscopic or microscopic standpoints (Supplementary Fig. 10a and data not shown). Long-term exposure (20 days) to PU-H71 75 mg per kg body weight per day in OCI-Ly7 xenografts caused significant retardation of tumor growth followed by a steady phase in which the tumors maintained a relatively constant volume of 500 mm3 (5 to 6 times the initial size) (Supplementary Fig. 11a). A similar effect was evident with the slow-growing BCL6-dependent SU-DHL6 xenograft, although these tumors were more completely suppressed and did not grow beyond 100 mm3 (Supplementary Fig. 11a). PU-H71 at 75 mg per kg body weight per day was able to decelerate tumor growth in these models even when the tumors were allowed to reach 500 mm3 prior to initiating treatment (Supplementary Fig. 11b). Again, there was no evidence of toxicity in these animals (data not shown). A more extensive toxicity study performed in normal Balb/c mice treated with either 50 mg per kg body weight per day (n = 5) or 75 mg per kg body weight per day (n = 5) of PU-H71 for 10 days (compared to vehicle; n = 5) showed no evidence of macroscopic or microscopic toxicity (Supplementary Fig. 10b and Supplementary Fig. 12). There was also no evidence of hematologic, renal or hepatic toxicity as determined by complete blood counts, blood chemistry, liver function tests and thyroid hormone testing (since PU-H71 is iodinated) (Supplementary Fig. 10c).
Figure 5.
PU-H71 suppresses DLBCL xenografts. (a) Tumor growth plots in Farage, OCI-Ly7 and SU-DHL4 xenografted mice treated with control (blue circles) or PU-H71 at 75 mg per kg body weight per day (green circles) for 10 consecutive days. The Y-axis indicates tumor volume (in mm3) and X-axis days of treatment. The P values represent the comparison of tumor volumes at day nine by T-test. (b) Tumor burden (in mg) at day ten in control (blue bars) and PU-H71 at 75 mg per kg body weight per day (green bars) treated Farage, OCI-Ly7 and SU-DHL4 mice. (c) Serum levels of human β2-microglobulin (in μg ml-1) at day 10 in control (blue bars) and PU-H71 at 75 mg per kg body weight per day (green bars) treated Farage, OCI-Ly7 and SU-DHL4 mice. (d) Kaplan-Meier survival curves for the pooled mice treated with control (blue line) and PU-H71 75 mg per kg body weight per day (green line) treated mice. (e) The relative abundance of Bcl6 protein (to actin) was determined by immunoblotting lysates from Farage, OCI-Ly7 and SU-DHL4 xenografts. Circles (blue for control, green for PU-H71) represent the densitometry values (in arbitrary units) of Bcl6 to actin. Bars represent the mean for each group. P values were obtained by T-test comparisons. (f) Representative images from Farage, OCI-Ly7 and SU-DHL4 mice tumors after being treated with control or PU-H71 75 mg per kg body weight per day and assayed for apoptosis by TUNEL. The number of apoptotic cells over total cells and the statistical significance are shown at the bottom. The bar represents 100 μm.
Figure 6.
PU-H71 induces additional changes in protein levels and a specific gene expression signature in DLBCLs. (a) Relative abundance of the NEMO, c-Raf, Akt and Hsp70 proteins (to actin) was measured by immunoblotting in tumor lysates from Farage, OCI-Ly7 and SU-DHL4 mice. Circles represent the densitometry values (in AU) of the specific protein to actin ratios for each mouse xenograft. The bar represents the mean for each group. P values were obtained by T-test comparisons. (b) A graphical heat map representation of the transcript abundance of down-regulated and up-regulated genes measured after treatment of three pairs of Farage xenograft-bearing mice with 75 mg per kg body weight PU-H71 for 6 and 12 h v controls (0 h). The dendrogram on the top represents the unsupervised hierarchical clustering of the six samples. Selected gene ontology (GO) categories with enrichment scores (ES) for up- and down-regulated genes are shown on the right. (c) Selected transcripts from (b) were measured by Q-PCR in three cell lines (Farage, OCI-Ly7 and SU-DHL4) after 6 or 12 h in vitro exposure to 0.5 μM of PU-H71 v control (0 h). Results are expressed as fold change compared to baseline (time 0 h) and were normalized to the average of 3 housekeeping genes (GAPDH, B2M and HPRT, hypoxanthine phosphoribosyltransferase 1). Experiments were performed in triplicate with duplicate QPCR measurements.
PU-H71 induces specific changes in gene expression in DLBCL cells
In order to further characterize the actions of PU-H71 in DLBCL cells, we administered 75 mg per kg body weight PU-H71 to three pairs of Farage xenograft-bearing mice, harvested the tumors at 6 and 12 h, and performed gene expression profiling compared to vehicle treated mice. In total, 204 unique genes were downregulated and 79 upregulated by exposure to PU-H71 (Fig. 6b, Supplementary Table 2 and Supplementary Fig. 13). The list of upregulated genes was enriched for those involved in stress response, proteins containing tetratrico-peptide repeats and apoptosis (Fig. 6b). Downregulated genes were enriched for chemotaxis and cell cycle regulation (Fig. 6b). A selected number of genes from both lists were independently confirmed by QPCR in three cell lines (Farage, OCI-Ly7 and SU-DHL4) at the same time points (6 and 12 h) after 0.5 μM of PU-H71 or control (0 h) (Fig. 6c). The proportion of human mRNAs that contain functional AREs was estimated to be in the vicinity of 8%31. Using the same approach, we found that 23.5% (48/204) of the downregulated genes and 18.9% (15/79) of the upregulated genes contained ARE elements (Supplementary Table 2), a significant overrepresentation compared to 8% of ARE elements present in the whole array (P < 0.0001 and P = 0.0007 respectively for up and down regulated genes, Proportion test with continuity correction). BCL6 was among the down-regulated ARE-containing genes (Fig. 6b). Among the up-regulated ARE-containing genes, we found 60% (9/15) related to the heat shock-ubiquitin-proteasome pathway (Supplementary Table 2). To determine whether these effects were common among Hsp90 inhibitors, we queried the Broad Institute connectivity map using the gene set affected by PU-H71. High connectivity scores were found for multiple instances of the four Hsp90 inhibitors present in the database: geldanamycin, 17-AAG, 17-DMAG and monorden (Supplementary Table 3). These results suggest that PU-H71, though structurally dissimilar from other Hsp90 inhibitors, induces similar effects.
Discussion
In examining the response of DLBCL cells to Hsp90 inhibitors we discovered that Bcl6, the most commonly involved oncoprotein in DLBCL, is an Hsp90 client protein. The relationship between Hsp90 and Bcl6 occurs at multiple levels and has implications for understanding the biology of normal germinal center B-cells and DLBCL pathogenesis. Approximately 70% of DLBCLs are Bcl6 positive, yet only about half of these cases contain translocations or point mutations that could drive constitutive Bcl6 expression14. Yet DLBCLs lacking these genetic lesions can still be biologically dependent on this oncogene17,18,21. The physical and functional interaction of Hsp90 and Bcl6 may at least in part explain this phenomenon, by virtue of directly stabilizing both the Bcl6 mRNA and protein. Although the proportional contribution of Hsp90 to Bcl6 mRNA versus Bcl6 protein stability cannot be precisely asserted, our data indicates that both effects contribute to maintain Bcl6 levels. Upregulation of Bcl6 is required for normal B-cells to form germinal centers, within which B-cells undergo affinity maturation. The fact that Hsp90 localizes to the nucleus of normal centroblasts raises the possibility it could contribute to B-cell differentiation by allowing Bcl6 to accumulate in germinal center B-cells. These data suggest that BCL6 might in fact function as a stress response gene that forms part of a larger, post-transcriptionally regulated program governed by Hsp90.
Bcl6 mediates its transcriptional repressor effect through corepressor recruitment to its target gene promoters14. The presence of Hsp90 at Bcl6 target genes may reflect a mechanism whereby Hsp90 could maintain Bcl6 stability while it is actively repressing target genes. Hsp90 might play additional roles in Bcl6 repression, for example, by stabilizing other components of the Bcl6 repression complex. Along these lines we found that Hsp90 can also bind and stabilize the critical Bcl6 corepressor BCoR (BCL6 co-repressor) which, like Bcl6, is expressed preferentially in germinal center B-cells and in DLBCLs (data not shown). Our data extend the transcriptional regulatory function of Hsp90 that have been uncovered over the years32–34.
The fact that Bcl6 is required for survival of a subtype of DLBCLs is consistent with it being a critical target of Hsp90 inhibitors in DLBCL, and this scenario was confirmed by experiments showing that a degradation resistant form of Bcl6 was sufficient to rescue DLBCL cells from the effects of PU-H71. Nonetheless, it is possible that degradation of other Hsp90 clients could also contribute to some of the activities of Hsp90 inhibitors. For example, it was shown that avian B-cells depleted of Hsp90 showed defective B-cell receptor signaling 35. A detailed examination of the B-cell receptor pathway in DLBCL cells might thus yield additional targets of interest. A recent report also showed that Akt could be a target of Hsp90 in DLBCL cells36.
From the therapeutic standpoint it is imperative to identify drugs that could improve the efficacy and reduce the toxicity of standard anti-lymphoma therapy. Our data show that Hsp90 inhibitors preferentially accumulate within lymphomas to a much greater extent and duration than normal tissues. Moreover, PU-H71 is a remarkably potent and well-tolerated anti-lymphoma agent in vivo. The ability of PU-H71 to facilitate the derepression of Bcl6 target genes involved in DNA damage checkpoints suggests that these drugs might enhance the cytotoxic effects of chemotherapy drugs, and it has been shown that 17-DMAG can in fact induce such an effect in several lymphoid cell lines (including DLBCLs)37. Taken together, this study demonstrates, and describes the mechanistic basis for, the efficacy of therapeutic targeting of DLBCLs with Hsp90 inhibitors and provides a rationale for initiation of clinical trials of PU-H71 for patients with Bcl6-dependent DLBCLs.
Methods
Cell lines and drugs
The DLBCL cell lines OCI-Ly1, OCI-Ly4, OCI-Ly7 and OCI-Ly10 were grown in medium containing 90% Iscove’s and 10% FCS, and supplemented with penicillin G/streptomycin, and the NIH-3T3 and DLBCL cell lines Karpas422, Pfeiffer, Toledo, Farage, SU-DHL6, SU-DHL4 and OCI-Ly3, were grown in medium containing 90% RPMI and 10% FCS supplemented with penicillin G/streptomycin, L-glutamine and HEPES. PU-H71 and 17-DMAG were added from a concentrated stock solution to the 10% serum-containing culture medium. Bortezomib was from EMD Biosciences. The Bcl6-peptide inhibitor RI-BPI corresponds to sequence S6.2 as previously published17. Control and RI-BPI peptides were from Biosynthesis.
Growth inhibition determination
DLBCL cell lines were grown at respective concentrations sufficient to keep untreated cells in exponential growth over the 48h drug exposure time. We determined cell viability using a fluorometric resazurin reduction method (CellTiter-Blue, Promega) and trypan blue dye-exclusion or acridine orange/ethidium bromide based method (Easycount, Immunicon). Fluorescence (560Ex/590Em) was determined using the Synergy4 microplate reader (BioTek). The number of viable cells was calculated by using the linear least-squares regression of the standard curve. Optical density was determined for 6 replicates per treatment condition and cell viability in drug-treated cells was normalized to their respective controls. We verified cell viability by the Sulforhodamine B assay (Sigma) following manufacturer’s instructions with minor modifications for cells grown in suspension or with an ATP-based luminescent method (CellTiter-Glo, Promega). Experiments were performed in triplicate. We used the CompuSyn software (Biosoft) to plot dose-effect curves and determine the drug concentration that inhibits the growth of cell lines by 50% compared to control (GI50). Data are presented as the mean GI50 with 95% confidence interval.
Mice xenotransplant studies
The Animal Institute Committee of the Albert Einstein College of Medicine approved all animal procedures. Six to eight-week old male SCID mice were purchased from the US National Cancer Institute and housed in a barrier environment. Mice were subcutaneously injected in the left flank with low-passage 107 human DLBCL cells (OCI-Ly7, SU-DHL4, SU-DHL6, Farage and Toledo). Tumor volume was monitored every other day using electronic digital calipers in two dimensions. Tumor volume was calculated using the formula: Tumor Volume (mm3) = (smallest diameter2 × largest diameter)/2. When tumors reached a palpable size (approximately 75 to 100 mm3 after 24 to 33 days post-injection depending on the cell line), the mice were randomized to different treatment arms. We kept under observation an additional cohort of mice (OCI-Ly7 and SU-DHL6) until the mean of the tumors reached 500 mm3 before starting with the treatments. We stored PU-H71 lyophilized at room temperature until it was reconstituted with sterile pure water immediately before using. We administered PU-H71 by intra-peritoneal injection. Mice were weighed every other day. All mice were euthanized by cervical dislocation under anesthesia when at least two out of ten tumors reached 20 mm in any dimension (equivalent to one gram), which was generally on day nine or ten of the treatment schedule. An additional cohort of OCI-Ly7 and SU-DHL6 mice was treated with PU-H71 for 20 days. At euthanasia, blood was collected (StatSampler, Iris) and tumors and other tissues were harvested and weighted, and microscopically examined by specialized pathologists.
Primary cells treatment
De-identified patient tissues were obtained in accordance with and approval from the IRB of the New York Presbyterian Hospital. We obtained single cells suspensions from lymph node biopsies by physical disruption of tissues followed by cell density gradient separation (Fico/Lite LymphoH, Atlanta Biologicals). Cell number and viability were determined by an dye-exclusion-based method (Easycount, Immunicon) and cells were cultivated in medium containing 80% RPMI and 20% human serum supplemented with antibiotics, L-glutamine and HEPES for 48 h. Primary cells were exposed to 2.5 μM of PU-H71 or control (water) in triplicates. After 48 h of exposure viability was determined by using an ATP-based luminescent method (CellTiter-Glo, Promega) and dye-exclusion based method (Easycount, Immunicon).
Statistics
The comparisons between treated and control mice were performed using two-tailed T-test or the Wilcoxon’s Rank Sum Test (Statistix, Analytical Software). The tissue microarray was analyzed using the Fisher’s exact test. Survival time was considered as the time elapsed (in days) from the start of the treatment (T0) until death or until the tumor volume increase 10 times from T0 (whatever event occurs first). Survival curves were calculated using the Kaplan-Meier method and groups were compared using Cox’s F test for two-group comparisons.
Supplementary Material
Acknowledgments
We thank J.C. Zenklusen for his contribution with gene expression profiling, D. Zatorska for the synthesis of PU-H71, L. Neckers (Urologic Oncology Branch, NCI, Rockville, MD) for providing pGEM4Z Hsp90 vectors, V. Bardwell (University of Minnesota, Minneapolis, MN) for providing T7plink vectors, and B.H. Ye (Albert Einstein College of Medicine, Bronx, NY) for providing FUW-hBCL6 plasmid constructs. G.C. is supported by the Geoffrey Beene Cancer Research Center of the Memorial Sloan-Kettering Cancer Center, Mr. William H. and Mrs. Alice Goodwin and the Commonwealth Foundation for Cancer Research, the Leukemia and Lymphoma Society, and the Experimental Therapeutics Center of Memorial Sloan-Kettering Cancer Center. A.M. is supported by the Leukemia and Lymphoma Society S-7032-04, US National Cancer Institute R01-CA104348, and the Chemotherapy Foundation. This research was supported in part by the Intramural Research Program of the US National Institutes of Health – National Cancer Institute – Center for Cancer Research.
Footnotes
Author Contributions
L.C. and E.C.L. contributed equally to this research. L.C. and A.M. conceived the project. L.C., E.C.L., SN.Y., K.H., K.B., L.T., A.M., A.R., J.W. and R.S. performed experiments and analyzed data. L.C., E.C.L., A.M., L.V., K.B. and G.C. designed the studies and supervised research. K.B and L.V. gave scientific advice. L.C., A.M. and G.C. wrote the manuscript.
Accession number
Expression profiling data have been deposited in NCBI’s Gene Expression Omnibus and are accessible through GEO series accession number GSE13401 (http://www.ncbi.nlm.nih.gov/geo/query/acc.cgi?acc=GSE13401).
Additional Methods are described in Supplementary Materials.
References
- 1.Neckers L. Heat shock protein 90: the cancer chaperone. J Biosci. 2007;32:517–530. doi: 10.1007/s12038-007-0051-y. [DOI] [PubMed] [Google Scholar]
- 2.Wandinger SK, Richter K, Buchner J. The Hsp90 chaperone machinery. J Biol Chem. 2008;283:18473–18477. doi: 10.1074/jbc.R800007200. [DOI] [PubMed] [Google Scholar]
- 3.Bonvini P, Gastaldi T, Falini B, Rosolen A. Nucleophosmin-anaplastic lymphoma kinase (NPM-ALK), a novel Hsp90-client tyrosine kinase: down-regulation of NPM-ALK expression and tyrosine phosphorylation in ALK(+) CD30(+) lymphoma cells by the Hsp90 antagonist 17-allylamino, 17-demethoxygeldanamycin. Cancer Res. 2002;62:1559–1566. [PubMed] [Google Scholar]
- 4.Nimmanapalli R, O’Bryan E, Bhalla K. Geldanamycin and its analogue 17-allylamino-17-demethoxygeldanamycin lowers Bcr-Abl levels and induces apoptosis and differentiation of Bcr-Abl-positive human leukemic blasts. Cancer Res. 2001;61:1799–1804. [PubMed] [Google Scholar]
- 5.Chiosis G, et al. A small molecule designed to bind to the adenine nucleotide pocket of Hsp90 causes Her2 degradation and the growth arrest and differentiation of breast cancer cells. Chem Biol. 2001;8:289–299. doi: 10.1016/s1074-5521(01)00015-1. [DOI] [PubMed] [Google Scholar]
- 6.Caldas-Lopes E, et al. Hsp90 inhibitor PU-H71, a multimodal inhibitor of malignancy, induces complete responses in triple-negative breast cancer models. Proc Natl Acad Sci U S A. 2009;106:8368–8373. doi: 10.1073/pnas.0903392106. [DOI] [PMC free article] [PubMed] [Google Scholar]
- 7.Taldone T, Gozman A, Maharaj R, Chiosis G. Targeting Hsp90: small-molecule inhibitors and their clinical development. Curr Opin Pharmacol. 2008 doi: 10.1016/j.coph.2008.06.015. [DOI] [PMC free article] [PubMed] [Google Scholar]
- 8.Chiosis G. Discovery and development of purine-scaffold Hsp90 inhibitors. Curr Top Med Chem. 2006;6:1183–1191. doi: 10.2174/156802606777812013. [DOI] [PubMed] [Google Scholar]
- 9.Chiosis G, et al. Development of purine-scaffold small molecule inhibitors of Hsp90. Curr Cancer Drug Targets. 2003;3:371–376. doi: 10.2174/1568009033481778. [DOI] [PubMed] [Google Scholar]
- 10.Chiosis G, Lucas B, Shtil A, Huezo H, Rosen N. Development of a purine-scaffold novel class of Hsp90 binders that inhibit the proliferation of cancer cells and induce the degradation of Her2 tyrosine kinase. Bioorg Med Chem. 2002;10:3555–3564. doi: 10.1016/s0968-0896(02)00253-5. [DOI] [PubMed] [Google Scholar]
- 11.He H, et al. Identification of potent water soluble purine-scaffold inhibitors of the heat shock protein 90. J Med Chem. 2006;49:381–390. doi: 10.1021/jm0508078. [DOI] [PubMed] [Google Scholar]
- 12.Chiosis G, Rodina A, Moulick K. Emerging Hsp90 inhibitors: from discovery to clinic. Anticancer Agents Med Chem. 2006;6:1–8. doi: 10.2174/187152006774755483. [DOI] [PubMed] [Google Scholar]
- 13.Klein U, Dalla-Favera R. Germinal centres: role in B-cell physiology and malignancy. Nat Rev Immunol. 2008;8:22–33. doi: 10.1038/nri2217. [DOI] [PubMed] [Google Scholar]
- 14.Ci W, Polo JM, Melnick A. B-cell lymphoma 6 and the molecular pathogenesis of diffuse large B-cell lymphoma. Curr Opin Hematol. 2008;15:381–390. doi: 10.1097/MOH.0b013e328302c7df. [DOI] [PMC free article] [PubMed] [Google Scholar]
- 15.Phan RT, Dalla-Favera R. The BCL6 proto-oncogene suppresses p53 expression in germinal-centre B cells. Nature. 2004;432:635–639. doi: 10.1038/nature03147. [DOI] [PubMed] [Google Scholar]
- 16.Ranuncolo SM, et al. Bcl-6 mediates the germinal center B cell phenotype and lymphomagenesis through transcriptional repression of the DNA-damage sensor ATR. Nat Immunol. 2007;8:705–714. doi: 10.1038/ni1478. [DOI] [PubMed] [Google Scholar]
- 17.Cerchietti LC, et al. A peptomimetic inhibitor of BCL6 with potent antilymphoma effects in vitro and in vivo. Blood. 2009;113:3397–3405. doi: 10.1182/blood-2008-07-168773. [DOI] [PMC free article] [PubMed] [Google Scholar]
- 18.Polo JM, et al. Specific peptide interference reveals BCL6 transcriptional and oncogenic mechanisms in B-cell lymphoma cells. Nat Med. 2004;10:1329–1335. doi: 10.1038/nm1134. [DOI] [PubMed] [Google Scholar]
- 19.Valbuena JR, et al. Expression of heat-shock protein-90 in non-Hodgkin’s lymphomas. Mod Pathol. 2005;18:1343–1349. doi: 10.1038/modpathol.3800459. [DOI] [PubMed] [Google Scholar]
- 20.Monti S, et al. Molecular profiling of diffuse large B-cell lymphoma identifies robust subtypes including one characterized by host inflammatory response. Blood. 2005;105:1851–1861. doi: 10.1182/blood-2004-07-2947. [DOI] [PubMed] [Google Scholar]
- 21.Polo JM, et al. Transcriptional signature with differential expression of BCL6 target genes accurately identifies BCL6-dependent diffuse large B cell lymphomas. Proc Natl Acad Sci U S A. 2007;104:3207–3212. doi: 10.1073/pnas.0611399104. [DOI] [PMC free article] [PubMed] [Google Scholar]
- 22.Schulte TW, Blagosklonny MV, Ingui C, Neckers L. Disruption of the Raf-1-Hsp90 molecular complex results in destabilization of Raf-1 and loss of Raf-1-Ras association. J Biol Chem. 1995;270:24585–24588. doi: 10.1074/jbc.270.41.24585. [DOI] [PubMed] [Google Scholar]
- 23.Sato S, Fujita N, Tsuruo T. Modulation of Akt kinase activity by binding to Hsp90. Proc Natl Acad Sci U S A. 2000;97:10832–10837. doi: 10.1073/pnas.170276797. [DOI] [PMC free article] [PubMed] [Google Scholar]
- 24.Broemer M, Krappmann D, Scheidereit C. Requirement of Hsp90 activity for IkappaB kinase (IKK) biosynthesis and for constitutive and inducible IKK and NF-kappaB activation. Oncogene. 2004;23:5378–5386. doi: 10.1038/sj.onc.1207705. [DOI] [PubMed] [Google Scholar]
- 25.Niu H, Ye BH, Dalla-Favera R. Antigen receptor signaling induces MAP kinase-mediated phosphorylation and degradation of the BCL-6 transcription factor. Genes Dev. 1998;12:1953–1961. doi: 10.1101/gad.12.13.1953. [DOI] [PMC free article] [PubMed] [Google Scholar]
- 26.Laroia G, Cuesta R, Brewer G, Schneider RJ. Control of mRNA decay by heat shock-ubiquitin-proteasome pathway. Science. 1999;284:499–502. doi: 10.1126/science.284.5413.499. [DOI] [PubMed] [Google Scholar]
- 27.Wax S, Piecyk M, Maritim B, Anderson P. Geldanamycin inhibits the production of inflammatory cytokines in activated macrophages by reducing the stability and translation of cytokine transcripts. Arthritis Rheum. 2003;48:541–550. doi: 10.1002/art.10780. [DOI] [PubMed] [Google Scholar]
- 28.Sinsimer KS, et al. Chaperone Hsp27, a novel subunit of AUF1 protein complexes, functions in AU-rich element-mediated mRNA decay. Mol Cell Biol. 2008 doi: 10.1128/MCB.00431-08. [DOI] [PMC free article] [PubMed] [Google Scholar]
- 29.Dean JL, Sully G, Clark AR, Saklatvala J. The involvement of AU-rich element-binding proteins in p38 mitogen-activated protein kinase pathway-mediated mRNA stabilisation. Cell Signal. 2004;16:1113–1121. doi: 10.1016/j.cellsig.2004.04.006. [DOI] [PubMed] [Google Scholar]
- 30.Ing NH, Massuto DA, Jaeger LA. Estradiol up-regulates AUF1p45 binding to stabilizing regions within the 3′-untranslated region of estrogen receptor alpha mRNA. J Biol Chem. 2008;283:1764–1772. doi: 10.1074/jbc.M704745200. [DOI] [PubMed] [Google Scholar]
- 31.Bakheet T, Frevel M, Williams BR, Greer W, Khabar KS. ARED: human AU-rich element-containing mRNA database reveals an unexpectedly diverse functional repertoire of encoded proteins. Nucleic Acids Res. 2001;29:246–254. doi: 10.1093/nar/29.1.246. [DOI] [PMC free article] [PubMed] [Google Scholar]
- 32.Liu J, DeFranco DB. Chromatin recycling of glucocorticoid receptors: implications for multiple roles of heat shock protein 90. Mol Endocrinol. 1999;13:355–365. doi: 10.1210/mend.13.3.0258. [DOI] [PubMed] [Google Scholar]
- 33.Abu-Farha M, et al. The tale of two domains: proteomics and genomics analysis of SMYD2, a new histone methyltransferase. Mol Cell Proteomics. 2008;7:560–572. doi: 10.1074/mcp.M700271-MCP200. [DOI] [PubMed] [Google Scholar]
- 34.Zhao R, Houry WA. Hsp90: a chaperone for protein folding and gene regulation. Biochem Cell Biol. 2005;83:703–710. doi: 10.1139/o05-158. [DOI] [PubMed] [Google Scholar]
- 35.Shinozaki F, et al. Depletion of hsp90beta induces multiple defects in B cell receptor signaling. J Biol Chem. 2006;281:16361–16369. doi: 10.1074/jbc.M600891200. [DOI] [PubMed] [Google Scholar]
- 36.Abramson JS, et al. The heat shock protein 90 inhibitor IPI-504 induces apoptosis of AKT-dependent diffuse large B-cell lymphomas. Br J Haematol. 2009;144:358–366. doi: 10.1111/j.1365-2141.2008.07484.x. [DOI] [PMC free article] [PubMed] [Google Scholar]
- 37.Robles AI, et al. Schedule-dependent synergy between the heat shock protein 90 inhibitor 17-(dimethylaminoethylamino)-17-demethoxygeldanamycin and doxorubicin restores apoptosis to p53-mutant lymphoma cell lines. Clin Cancer Res. 2006;12:6547–6556. doi: 10.1158/1078-0432.CCR-06-1178. [DOI] [PubMed] [Google Scholar]
Associated Data
This section collects any data citations, data availability statements, or supplementary materials included in this article.


