

Abstract
Much remains to be understood about the differential contributions from primary and secondary sensory cortices to sensory-guided decision making. To address this issue we simultaneously recorded activity from neuronal ensembles in primary [gustatory cortex GC)] and secondary gustatory [orbitofrontal cortex (OFC)] cortices while rats made a taste-guided decision between two response alternatives. We found that before animals commenced a response guided by a tastant cue, GC ensembles contained more information than OFC about the response alternative about to be selected. Thereafter, while the animal's response was underway, the response-selective information in ensembles from both regions increased, albeit to a greater degree in OFC. In GC, this increase depends on a representation of the taste cue guiding the animal‘s response. The increase in the OFC also depends on the taste cue guiding and other features of the response such as its spatiomotor properties and the behavioral context under which it is executed. Each of these latter features is encoded by different ensembles of OFC neurons that are recruited at specific times throughout the response selection process. These results indicate that during a taste-guided decision task both primary and secondary gustatory cortices dynamically encode different types of information.
Introduction
Adaptive decision-making requires processing information provided by sensory cues to guide the selection of a behavioral response and obtain a desired outcome. Typically, this response selection process is conceptualized as an interaction between primary sensory and motor areas, which interface through higher-order brain regions (Shadlen and Newsome, 1996; Glimcher, 2001; Schall, 2003). One such higher-order region is the orbitofrontal cortex (OFC), a cortical region that has been the focus of much inquiry (Schultz, 2004; O'Doherty, 2007; Wallis, 2007). The OFC is a functionally heterogeneous structure and its connectivity to other brain areas gives it access to a wide range of disparate information types that must be integrated to optimize response selection. In this regard, the OFC has strong connections with limbic structures (Shi and Cassell, 1998; Price, 2007), through which it receives input regarding incentive value and spatial information that can guide the animal behavioral response selection process. OFC neurons have also been found to respond following the execution of sensory-guided tasks with reference to both the incentive value assigned to the available outcomes as well as their spatiomotor properties (Schoenbaum et al., 1998; Feierstein et al., 2006).
With regard to taste-guided behavior, the OFC receives direct inputs from the primary gustatory cortex (GC) (Shi and Cassell, 1998; Price, 2007), which have led to proposals that the OFC functions, at least in part, as a secondary taste cortex (Rolls, 2004). However, the precise contribution of the GC and OFC to the process of animal behavioral response selection is not well understood. In particular, it is unclear to what extent the response-selective properties of neuronal populations in GC compare with those observed in OFC. To address this issue, we simultaneously recorded neuronal ensembles from GC and OFC in rats trained on a taste-cued two-alternative forced choice task (2-AFC). Under this design, all neurons recorded from both regions are subjected to the same overt behaviors of the animal thereby facilitating between-region comparisons. We tested the hypothesis that neuronal ensembles in GC act in concert with those in OFC to guide and monitor taste-guided decision-making. To our knowledge, these experiments constitute the first within-subject direct comparison between ensemble neuronal responses from primary (GC) and secondary (OFC) sensory cortical neurons during a sensory-guided decision-making task.
Materials and Methods
Subjects and behavioral procedure.
Five adult male Long–Evans rats were subjected to a daily 23.5 h water deprivation schedule. Rats were given 15 min access to water 30 min after the end of the task. All protocols were approved by the Duke University Institutional Animal Care and Use Committee.
Behavioral testing was performed in a standard operant chamber (MED-PC, MED Associates). Three recessed panels were positioned from left to right on the front wall at the same height. Each recessed panel had a small hole in the middle, through which the rat could gain access to a lick spout. Each panel was equipped with two photodiodes and phototransistors; one to detect head entry into the recess and another to detect the rat's tongue contacting the lick spout. Several concealed tubes could deliver multiple tastants to any of the three lick-spouts, which were delivered by opening solenoid valves for 20 ms when the photobeam was interrupted. The tubes were interfaced with an air-tank in which pressure was adjusted to deliver 20 μl of tastant per valve opening.
Thirsty rats were tested on a taste-related 2-AFC task. The rats were trained so that the concentration of NaCl (i.e., its intensity) presented during a trial, reliably cued which of two response alternatives should be selected to obtain the water reward. A trial started when 20 μl of NaCl solution was delivered after each of two successive licks on the central lick spout (the Sample spout) (Fig. 1a). The two aliquots of NaCl delivered during the trial were always of the same concentration. The NaCl concentration that was delivered during the trial was pseudorandomly chosen from one of four concentrations (30, 47, 76, and 120 mm NaCl) that were approximately equally spaced on a log scale. The lowest and highest concentrations (Low—30 mm NaCl; High—120 mm NaCl) were chosen because they are qualitatively similar to rats (i.e., “salty”), even though their intensities (“saltiness”) differ (Yamamoto et al., 1994). Also, NaCl does not activate trigeminal chemosensitive neurons over this concentration range (Carstens et al., 1998).
Figure 1.
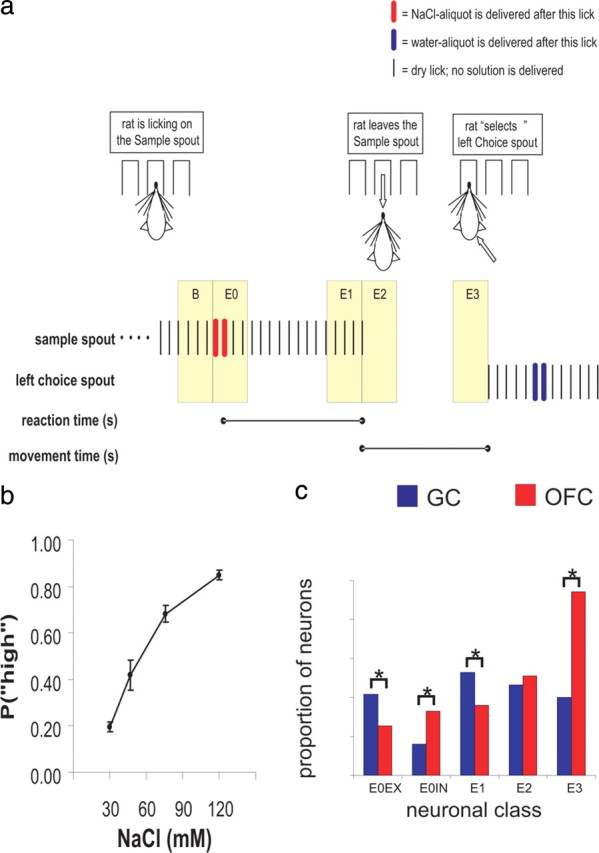
Two-alternative forced choice task. a, An illustration of a trial. Licks on a particular spout are depicted as vertical ticks. Color-coded bars are placed over licks that are followed by solution delivery (red = NaCl, blue = water). RT and MT are indicated by lines that mark their beginning and end and are aligned to the relevant trial events. The Epochs E0–E3 and Baseline (B), each being 500 ms, are highlighted in beige during the trial, and described in the text. The delivery of a particular cue (i.e., a single NaCl concentration) determines which choice response will most likely result in reward. b, This plot depicts the mean probability [P(“high”)], of the rat choosing the High choice spout as a function of NaCl concentration. c, A bar graph showing the relative proportions of event-related neurons from E0–E3 in GC (red) and OFC (blue). A black line that bridges two bars indicates a significant difference (p < 0.05; χ2 test) between the groups represented by each bar.
After the second NaCl delivery during the trial, the rat was free to make a choice response by selecting one of the lick spouts positioned to the left or right of the Sample spout. These spouts are referred to as Choice spouts (Fig. 1a). Before selecting a Choice spout, all of the rats made several additional licks on the Sample spout even though no solution was delivered. Consequently, we refer to these as “dry licks” (Fig. 1a). The Low NaCl concentration reliably cued water availability on only one Choice spout (Low response). For an individual rat, the side (left or right) that was considered a Low response was fixed across training and testing. Similarly, the High NaCl concentration reliably cued water availability on the other Choice spout (High response) and, as above, was fixed across training and testing. If the rat made its first lick on a correct Choice spout, the next trial could be started immediately after a water reward was delivered (Fig. 1a). If the rat made its first lick on an incorrect Choice spout, the trial was aborted and it was given a 10 s timeout (e.g., a Low response following 120 mm delivery and vice versa).
When an intermediate NaCl concentration (47 and 76 mm NaCl) was delivered during a trial, the rat was not rewarded for either a Low or High response. Despite the absence of reward during these trials, rats nevertheless made Low or High-responses; this was a product of the training protocol that we designed and implemented (see supplemental Materials and Methods). During these nonrewarded trials, response selection was guided by how similar the intermediate NaCl value was to the Low and High NaCl concentration. In this way, the 47 mm NaCl concentration resulted in a Low-response more often than a High-response. The opposite pattern was observed after 76 mm NaCl concentration was delivered (Fig. 1b). This 2-AFC task may also be considered a bisection procedure, which has been applied in psychology to both humans and nonhumans many times before (Stevens, 1957; Fagot, 1963; Boakes, 1969; Penney et al., 2008). Here bisection procedures are used to quantify the relationship between specific values of a sensory feature that is presented (e.g., concentration) and the judgment of magnitude that is made thereafter (i.e., psychophysical scaling). To our knowledge, this is the first time a bisection task has been adapted to the study of the chemical senses.
Electrodes, surgery, and histology.
Recordings of extracellular activity were obtained using custom-built double microelectrode-arrays. Each array was made from 16 moveable 35 μm diameter microwires that were arranged in a 4 × 4 design with ∼250 μm spacing between adjacent wires. In each rat, one array was implanted in the left hemisphere in OFC (3.0 mm anterior to bregma, 3.25 mm lateral to bregma, 3.50 mm ventral to the brain surface) and one in the left hemisphere of GC (1.2 mm anterior to bregma, 5.3 mm lateral to bregma, 3.80 mm ventral to the brain surface). All rats were allowed 1 week to recover. After the session, the arrays were advanced in ∼125 μm increments. Recording was stopped when the estimated position of the electrode bundle was consistent with passage beyond the region of interest. Using our knowledge of the number of turns made while lowering the arrays, we could estimate their more dorsal coordinates. The arrays that targeted the OFC were mainly confined to the lateral orbital area, whereas the arrays that targeted the GC monitored neurons from the ventral-most granular insular region, the whole extent of the dysgranular insular region, and the dorsal-most part of the agranular insular region (Shi and Cassell, 1998) (see supplemental Fig. S1, available at www.jneurosci.org as supplemental material). Neurons were sorted off-line by following standard methods from this lab and have been described previously (Stapleton et al., 2006) (see supplemental Materials and Methods for additional details).
Behavioral measurements.
For each rat, the probability of selecting a High response [P(“high”)] was calculated as a function of NaCl concentration. A one-way ANOVA was used to test the effect of concentration on P(“high”). On each trial during a session we also measured the reaction time (RT). The RT was defined as the interval starting from the lick that produces the second NaCl delivery during the trial to the final dry lick on the Sample spout before the rat initiated a choice response (Fig. 1a). A session's RTs were sorted according to the rat selecting a Low or High response during a trial, and for each rat the mean RT was determined as a function of this response selection during the session. We also determined the number of licks following the final delivery of NaCl (post-NaCl licks) for each trial during a session. Like the RT measurement, the post-NaCl licks were sorted according to the rat's response selection. These data also permitted measurements of the movement time (MT), which was defined as the time starting from the last dry lick on the Sample spout to the first lick on the Choice spout (Fig. 1a). A session's MTs were sorted according to whether the rat selected the Low or High response during a trial and, for each rat, the mean MT was determined as a function of response selection during the session. Finally, after the first NaCl delivery in the trial, we obtained the mean of the three subsequent interlick intervals (ILIs) for each trial and session (Fig. 1c).
Classification of neurons with respect to Epochs.
As presented in Figure 1a, a trial was divided into five 500 ms long Epochs (B, and E0–E3) whose duration encompassed trial-relevant events. Epoch B is the baseline Epoch and its end coincided with the first NaCl delivery, which also marked the beginning of E0. Epoch E0 encompassed the two NaCl deliveries and subsequent dry licks (to 500 ms). Epoch E1 is the 500 ms interval preceding the final dry lick on the Sample spout. After the rat's termination of the lick sequence on the Sample spout, the rat moved toward one of the Choice spouts. The start of E2 was chosen to coincide with the final lick on the Sample spout; therefore E2 encompassed approximately the first half of the movement toward a Choice spout (Fig. 1a). Altogether, the final lick on the Sample spout during the trial was straddled on each side by E1 and E2 such that in real time these Epochs were contiguous. Finally, we defined E3 as the 500 ms interval preceding the first lick on the Choice spout. Therefore, E3 encompassed the last 500 ms interval before a Choice spout was selected.
For each of the E0–E3 epochs, we made use of a two-sample Kolmogorov–Smirnov test and made four comparisons to Epoch B. The null-hypothesis was that the trial-by-trial spike counts for Epoch B and the Epoch of interest (E0–E3) came from the same distribution. Our α value was set at p = 0.05. If the E0 and B comparison yielded a statistically significant result, we further assigned the neuron into one of two categories: if the change from B to E0 was positive, the neuron was considered E0EX, whereas a negative change resulted in an E0IN-neuron assignment. For E1–E3, only excitatory responses were considered. In this way, a neuron from one of these Epochs was considered event-related during an Epoch if it was classified as excitatory. Unclassified neurons during the same Epoch were considered event-unrelated. Because a neuron could be assigned to more than one class, a neuron can be event-related in more than one Epoch.
Constructing PSTHs and population PSTHs.
PSTHs were made by using custom scripts for Matlab (MathWorks) or purchased software (Neuroexplorer, Plexon). A PSTH was determined for each neuron in a population of interest with reference to the start of the Epoch under consideration. We used 20 ms time bins and smoothed the PSTH using a box-car filter of 3 bins. Subsequently, the mean PSTH across the whole population could be determined. The population PSTH was normalized so that the minimum activity during the time of interest is set to 1.0. In addition, we determined 99% confidence intervals for each point that makes up the population PSTH.
Calculating the ensemble discrimination index for GC and OFC during a session.
We determined the firing rate for a neuron during an Epoch of interest (E0–E3) and with reference to response selection (Low or High response). The neuron's firing rate during the Epoch was expressed as a vector that was 25 elements long (500 ms), and each element represented the firing rate during a 20 ms time bin. The neuron's firing rate was normalized to the time bin with the highest firing rate across E0–E3.
To assign an ensemble discrimination index (eDI) to a GC or OFC ensemble during an experiment, all of the 25 element vectors (neuron) within a given region and Epoch were concatenated. However, only vectors associated with the same response selected (Low or High response) were concatenated. The result of this operation yielded two n × 25 (where n = number of neurons from that region) element-long vectors—one for the Low response (ai—see equation below) and one for the High response (bi—see equation below). These vectors represent a spatiotemporal pattern of neuronal firing within a region that is associated with response selection during an Epoch of interest. The obtained vectors for each response selected—ai and bi—were compared with one another using a variant of the Euclidean distance measure as described in the following equation:
 |
where N = total number of elements in one concatenated vector, which is the same number in each condition. We divided by N because the number of neurons from each region during an experiment was not always equal. In this case, the total number of elements contributing to the sum of the squared differences would not be equal. Therefore, we normalized the obtained value by the number of contributing elements.
Comparing the eDIs from GC and OFC across Epochs E1–E3.
For each experiment and Epoch, the eDI was separately calculated for GC and OFC ensembles. We first conducted a three-way ANOVA with repeated measures on factor Concentration, Epoch, and Region. There was no main effect of Concentration (F(3,51) = 1.51, p = 0.22) on eDI but there was an effect of Epoch (F(3,51) = 32.0, p < 0.001) and Region (F(1,17) = 12.32, p < 0.001) on the eDI. The interaction between Epoch and Region was significant (F(3,51) = 6.61, p < 0.001) but no other interactions were significant (all other F values <1, all p values >0.46). The results from this analysis prompted us to pool all of trials together only as a function of response selection and regardless of the NaCl concentration. Moreover, the lack of any reliable effect of NaCl concentration on the eDI also indicates that the measure is not influenced by whether the NaCl is or is not rewarded.
Comparing the eDI for event-related and event-unrelated neurons.
For each experiment and Epoch, GC and OFC neurons were divided into event-related and event-unrelated. For example, in E0 one subpopulation consisted of E0-neurons (i.e., event-related during E0) and the remaining subpopulation was composed of neurons that were E0-unrelated (i.e., event-unrelated during E0). Using the methods described above, for each experiment and Epoch, we calculated an eDI for ensembles of neurons composed only of event-related and event-unrelated neurons.
Comparing the eDI change during the Post-Cue period to the eDI during the Post-Choice period.
In this analysis, we compared the eDI obtained from E1, E2 and E3 to three Epochs called C1, C2 and C3 that define three different 500 ms time-periods during a trial. The C1–C3 Epochs are shown (see Fig. 7, top) as is their relation to E1–E3. The C1–C3 Epochs encompass the time when a rat terminates licking on one of the Choice spouts, then initiates a lateral movement (i.e., to its left or right) to the Sample spout to start a new trial. The end of C1 marks the final dry lick on the Choice spout. The beginning of C2 is placed at the final dry lick on the Choice spout, so that in real time C1 and C2 are contiguous. Finally, the end of C3 is placed at the first dry lick on the Sample spout made after terminating its response on the Choice spout. As above, each neuron's firing rate was normalized to the bin with the highest firing rate across E1–E3 and C1–C3 to make the 25 element vectors.
Figure 7.

The increase in the ensemble discrimination index (eDI) from E1–E3 depends on taste guiding response selection in GC but to a lesser extent in OFC. a, The mean eDI for GC (mean ± SEM) across analogous Epochs (E1–C1, E2–C2 and E3–C3) and as a function of Post-Cue or Post-Choice condition. b, The eDI (mean ± SEM) in GC for E0–E3 as a function of Post-Cue or Post-Choice displayed as a line-plot. c, The mean eDI for OFC (mean ± SEM) across analogous Epochs (E1–C1, E2–C2 and E3–C3) and as a function of Post-Cue or Post-Choice condition. d, The mean eDI (mean ± SEM) in OFC for E0–E3 as a function of Post-Cue or Post-Choice displayed as a line-plot.
Results
Behavioral performance during a taste-cued decision-making task
To obtain a water-reward, thirsty rats were trained to associate a particular concentration of NaCl solution (delivered from a centrally positioned lick-spout) with the selection of one of two laterally positioned lick-spouts. The lowest concentration of NaCl (30 mm) was reliably associated with one response option (the Low response), whereas the highest concentration of NaCl (120 mm) was reliably associated with the other response option (the High response). Figure 1a displays the relevant sequence of events that constitute a trial, which consists of the sequence of events starting with the rat licking NaCl solutions from the central lick-spout (Sample spout) and finishing with its selection of one of the lateral lick-spouts (Choice spout), after which a new trial follows. Because a correct response depended on the rats correctly evaluating the intensity of NaCl solution, we first determined the extent to which the NaCl concentration effectively guided response selection. We calculated the probability of rats selecting the High response as a function of NaCl concentration [P(“high”), Fig. 1b]. The P(“high”) increased monotonically with increasing NaCl concentration and post hoc comparisons confirmed that the values of P(“high”) differed from one another at each NaCl concentration [Tukey's honestly significant difference (HSD), all p values <0.02). These data show that, across rats, the animal behavioral response selection was guided by the perceived intensity of NaCl.
Our experimental design presupposed that the response selection was uniquely determined by the NaCl concentration. Therefore, we determined whether other behavioral measures incidental to the NaCl delivery covaried with response selection. The mean interlick interval (ILI) during NaCl delivery (see Materials and Methods) did not change as a function of the rat's response selection (0.148 ± 0.005 s mean ± SE; one-way repeated-measures ANOVA, F(1,4) = 1.56, p = 0.28). Therefore, after NaCl delivery the lick rate did not predict the animal's behavioral response selection. We also inquired as to whether response selection could be predicted by the RT (Fig. 1a)—i.e., the time taken by the rat to initiate response selection following the delivery of the second NaCl aliquot during the trial. There was no difference in RT as a function of response selection (1.49 ± 0.30 s mean ± SE; one-way repeated-measures ANOVA, F(1,4) = 1.05, p = 0.36). We note that before initiating a movement toward one of the Choice spouts, rats reliably dry licked for an additional ∼1.5 s on the Sample spout. In other words, after the final second NaCl delivery they averaged nearly 10 additional dry licks (mean ± SE = 9.9 ± 1.8; no main effect of response selection; one-way repeated-measures ANOVA, F(1,4) = 0.53, p = 0.55). We also determined whether response selection varied as a function of MT (Fig. 1a), defined as the time taken by the rat to move from the Sample spout and then make the first lick on the selected Choice spout. Once again, there was no significant effect of response selection on MT (1.20 ± 0.07 s mean ± SE; one-way repeated-measures ANOVA, F(1,4) = 0.94, p = 0.39). Together, these results demonstrate that behavioral measures incidental to NaCl cue delivery did not differ as a function of response selection.
GC and OFC neurons were responsive to the different Epochs that composed a single trial
A total of 337 distinct single neurons (nGC = 125; nOFC = 212) were recorded in 19 experimental sessions from 5 rats (mean = 4.20 per rat, SD = 2.78). A unique set of neuronal units was obtained each session because each moveable array was independently lowered after an experiment (see Materials and Methods for details). To compare the neuronal responses from GC and OFC with reference to E0–E3, we broadly defined five classes of neurons (E0EX, E0IN, E1, E2 and E3). If the modulation of a neuron's firing rate during an Epoch was significantly different from Baseline (depicted in Fig. 1a), it was considered “event-related” during that Epoch and “event-unrelated” if not. Overall, the OFC (69%, nOFC = 146) had significantly more event-related neurons than did the GC (58%, nGC = 72; χ2 test, p = 0.04). However, the proportion of event-related neurons found in both GC and OFC was dependent on the Epoch (Fig. 1c) (discussed in more detail below). We also observed oscillatory activity in many neurons whose periodicity matched the licking frequency observed in the rat (∼6–7 Hz). Supplemental Figure S2a (available at www.jneurosci.org as supplemental material) illustrates the results of an analysis that shows that event-related neurons from GC exhibited more oscillatory responses in the 6–10 Hz (theta) range than those from the OFC population.
Figure 2 illustrates representative examples of neurons from GC (left column) and OFC (right column) that were event-related across E0–E3 (rows 1–5). In addition, we also provide in Figure 3 the population PSTHs for each class of event-related neuron from GC and OFC in reference to the Epoch under consideration. Two classes of event-related neurons during E0 were identified depending on whether the response to NaCl was excitatory (E0EX) (Fig. 2, row 1) or inhibitory (E0IN) (Fig. 2, row 2). In both classes, the response to NaCl was rapid given that maximum excitation (E0EX) or inhibition (E0IN) was typically reached by 250 ms (Fig. 3a,b). As seen in Figure 1c, there were proportionally more E0EX-neurons in GC (21%, nGC = 26) compared with OFC (13%, nOFC = 27; χ2 test, p = 0.05), and there were more E0IN-neurons in OFC (17%, nOFC = 35) than GC (8%, nGC = 10; χ2 test, p < 0.001). Therefore, the E0-neurons differed between GC and OFC in reference to whether the NaCl cue was more likely to evoke rapid excitation or inhibition.
Figure 2.
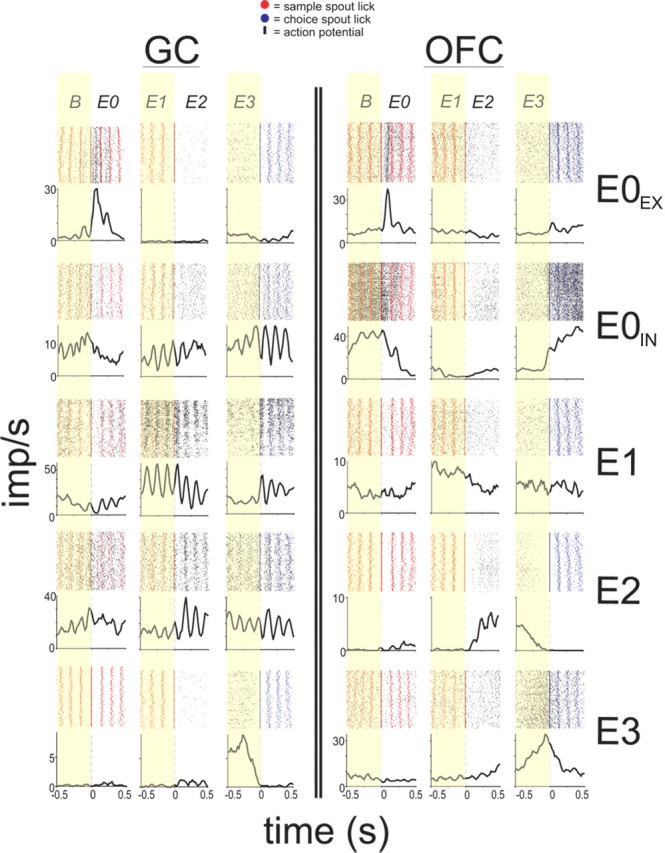
GC and OFC neurons show selective responses during trial-relevant Epochs. The raster plots and PSTHs of representative neurons from five neuron classes. A representative GC and OFC neuron from each class is shown with reference to the Baseline (B) and Epochs E0–E3 as seen in Figure 1a and described in the text. The regions are separated by double black lines. Within each region, a neuron class is represented by a row and each column denotes the trial Epoch (B and E0–E3) to which the PSTH is time-locked. The PSTHs reflect all trials in the session, regardless of response selection.
Figure 3.
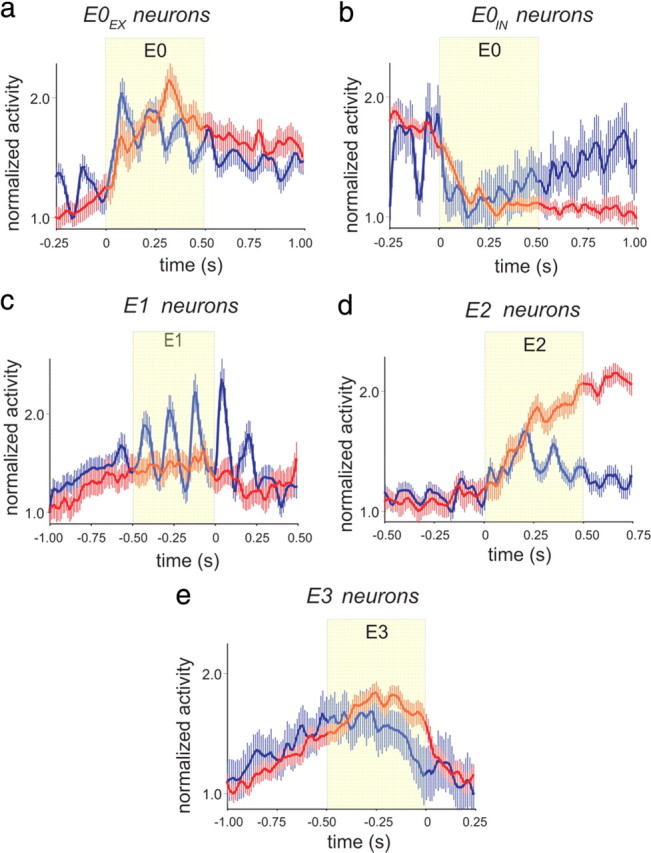
Event-related neurons in GC and OFC. a, Population PSTH (mean ± 99% confidence interval) for E0EX-neurons from GC (red) and OFC (blue) referenced to the start of E0. b, Population PSTH for E0IN-neurons from GC (red) and OFC (blue) referenced to the start of E0. c, Population PSTH for E1 neurons from GC (red) and OFC (blue) referenced to the end of E1 and beginning of E2. d, Population PSTH for E2 neurons from GC (red) and OFC (blue) referenced to the end of E1 and beginning of E2. e, Population PSTH for E3 neurons from GC (red) and OFC (blue) referenced to the end of E3. In all panels data are presented as mean ± 99% confidence interval.
Figure 2 (row 3) depicts a representative E1 response from both GC (left column) and OFC (right column). These neurons are distinguished by a slower latency of response to NaCl and a peak of activity occurring just before the rat terminated dry licking on the Sample spout (Fig. 3c). There was a higher proportion of E1 neurons in GC (26%, nGC = 33) compared with OFC (18%, nOFC = 36; χ2 test, p = 0.04) (Fig. 1c). Interestingly, the activity of E1 neurons in GC were strongly oscillatory in the 6–10 Hz range (Fig. 3c; supplemental Fig. S2a, available at www.jneurosci.org as supplemental material), and its important to note that these oscillations were not simply somatosensory because these cells were relatively inactive around E0 and the oscillatory activity often extended into E2 and E3 (see also supplemental Fig. S2b, available at www.jneurosci.org as supplemental material) during which the rats were not licking.
A representative E2 response from GC and OFC is shown in Figure 2 (row 4). The E2 responses were generally observed to abruptly increase activity during the rat's initiation of a choice response (Fig. 3d). The GC (23%, nGC = 29) and OFC (25%, nOFC = 54) contained equivalent proportions of E2-type neurons (χ2 test, p = 0.98) (Fig. 1a). Also shown in Figure 2 (row 5) is a representative E3 response from the GC (left column) and OFC (right column). In both regions, the E3 responses ramped up their activity during the choice response but rapidly decreased their activity just before the first lick on the Choice spout (Fig. 3e). As seen in Figure 1c, the proportion of E3 neurons was significantly higher in OFC (47%, nOFC = 100) compared with GC (20%, nGC = 25; χ2 test, p < 0.001).
In our analysis we allowed for a neuron to be assigned to more than one class. In the supplemental material (supplemental Fig. S3, available at www.jneurosci.org), we present tables of data that describe the number (top) or proportion (bottom) of neurons for GC and OFC from one class that are also assigned to any of the other four remaining class. Altogether, these results support a broad distinction between GC and OFC neuronal responses. Specifically, there are greater proportions of neurons from GC that increase their activity earlier in the trial, while the rat is evaluating the NaCl-cue and preparing to initiate a choice response (E0–E1). Conversely, there a higher proportion of OFC neurons that increase their activity just before rats select a response on the basis of the NaCl cue (E3). Nevertheless, it is important to note that neurons in both regions can modulate their firing rate in distinct epochs of the task trial.
Ensemble response selectivity increases during response execution for both GC and OFC ensembles, but at different rates
Although the previous analysis reveals some interesting neural responses during the trial as well as some regional cortical specializations, our principal aim was to compare GC and OFC neuronal ensembles with regard to response selection while the taste-guided decision process evolves. The following analyses were based on measuring the spatiotemporal pattern of activity from GC and OFC neuronal ensembles during E0–E3.
An example of this analysis is illustrated in Figure 4(see Materials and Methods for complete details). Figure 4a depicts an OFC neuron that responded during E3 to a much greater extent to a Low-choice response than to a High-choice response. In comparison, Figure 4b illustrates a neuron that responded similarly to the Low and High-responses. Each PSTH and raster plot corresponds to only those trials, regardless of NaCl concentration, in which the rat selected the Low or High response. The E3 segment from each Low- and High-response PSTH, which is highlighted, is converted into a vector that was N-elements long (where N is the number of time bins in the Epoch) so that the neuron has associated with it two 1×N vectors (i.e., E3 activity vectors in Fig. 4a,b). We quantify the difference between the two vectors to yield an ensemble discriminative index (eDI) (see Materials and Methods for calculation). The smaller degree of response selectivity of the neuron seen in Figure 4b compared with the neuron shown in Figure 4a is reflected by a smaller eDI score.
Figure 4.
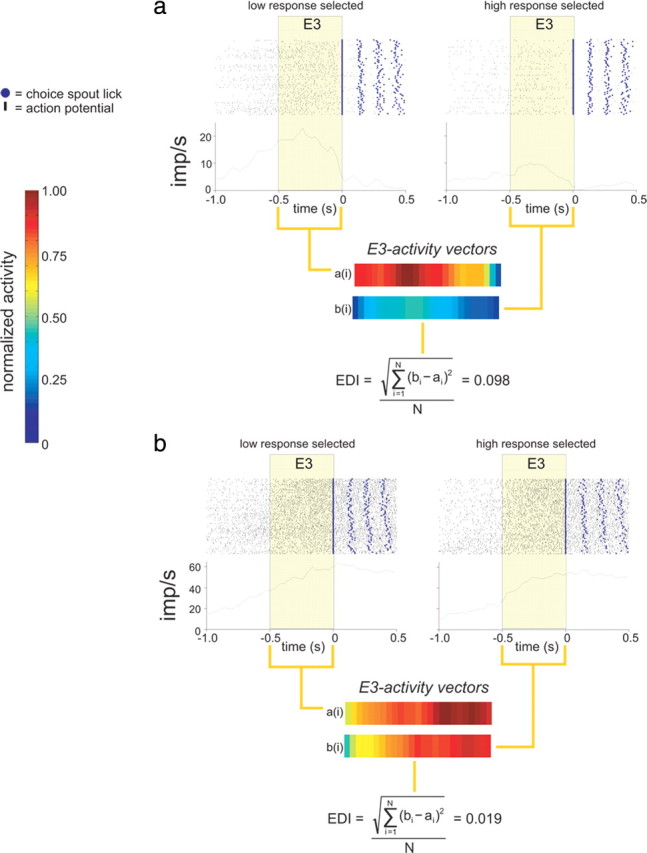
The ensemble discrimination index (eDI) reflects a neuronal population's response selectivity. a, Two PSTHs (20 ms time bins) and associated raster plots are shown for a single OFC neuron under the Low response (left) and High response (right) selection condition. The PSTHs are referenced to the end of E3, which is highlighted in beige. The PSTH during E3 in each response selection condition is converted into a column vector (activity vectors) reexpressing activity as a normalized value between 0 and 1. Each column vector is directly compared using the equation depicted to generate an eDI value = 0.098. b, The same process as described above is performed for a different OFC neuron with an eDI value = 0.019, indicating the response is more similar to that than the neuron's response depicted in a.
From these two examples, it is easy to extrapolate from the single-neuron case to an ensemble with multiple neurons from the same brain region. For a given region (i.e., GC or OFC), the Low response vector derived from each neuron were concatenated, resulting in a longer vector of r×N elements in length (where r is the number of neurons within a region). The same procedure was done to generate an r×N element-long High response vector. In this manner, the difference between each r×N element-long vector from the Low and High response can be quantified for a specific recording session. Note that each vector represents the same ensemble under the Low and High response condition. The eDI quantifies the difference between the spatiotemporal patterns of neural activity observed for the Low- and High-choice ensemble. Thus, the greater the eDI value, the greater the difference in ensemble activity during trials associated with Low versus High response selection. In this manner, for E0–E3 and across sessions, we quantified the response selection from GC and OFC ensembles.
In regard to decision-making, the neural activity correlated with behavioral response selectivity is typically assessed by first restricting one's analysis to the period between sensory-stimulus presentation and the initiation of the choice response (i.e., the RT period; Glimcher, 2001; Schall, 2003; Shadlen and Newsome, 1996). Therefore, once the response selection is completed and the animal is committed to the execution of the response, any change in neural responses during E2 and E3 might be construed to arise at least in part from motor (i.e., movement) aspects of the response. To this point, we verified that the eDI does not correlate with any incidental measures of motor behavior that may be uniquely associated with each choice response and could influence the eDI. Specifically, there was no relationship between the eDI and either the ILIs for the final four licks on the Sample spout or the MTs recorded during each session (supplemental Fig. S4, available at www.jneurosci.org as supplemental material).
Although a neuron may be active during an Epoch (i.e., event-related), this observation does not address the degree to which this activity differs depending on a behavioral response selection. Consequently, we also inquired whether event-related neurons were more response selective than those that were event-unrelated. The separate calculation of eDIs for event-related and event-unrelated neurons across Epochs E0–E3 allowed for a more comprehensive description of response selectivity during Epochs E0–E3. The results from this analysis are discussed in detail within the supplemental material (supplemental Figs. S5, S6, available at www.jneurosci.org). Overall, these analyses confirm that our earlier neuronal classification scheme (event-related neurons) was useful beyond a heuristic standpoint, to the extent that in most cases the event-related neurons are more response selective than event-unrelated neurons.
To complete these analyses, we determined the animal's behavioral response selectivity from GC and OFC ensembles as a function of E0–E3 by comparing the mean eDI for GC ensembles to the mean eDI for OFC ensembles across sessions. A three-way ANOVA with repeated-measures on factor Epoch, Region and Concentration revealed no main effect of Concentration (F(3,51) = 1.51, p = 0.22) nor any other interactions having to do with Concentration (F values <1.0, p > 0.46 for all interactions, except for a Epoch × Region, F(3,51) = 6.61, p < 0.001; see Materials and Methods for more details). For these reasons, all of the data were pooled across concentrations. A two-way ANOVA with repeated-measures on factor Epoch and Region was conducted on the eDIs. This analysis revealed a main effect of Epoch (F(3,54) = 37.75, p < 0.001), but no effect of Region (F(1,18) = 2.86, p = 0.11). However, there was an interaction between Epoch and Region (F(3,54) = 7.29, p < 0.001) indicating that the difference in the eDI observed between each region depended on the Epoch. Post hoc comparisons (Tukey's HSD) confirmed that the eDI differed between regions during E1 (p = 0.005), but not during E0 (p = 0.13), E2 (p = 0.89) or E3 (p = 0.33). Therefore, these results show that only in E1 was the eDI from GC greater than the eDI from OFC (Fig. 5a).
Figure 5.
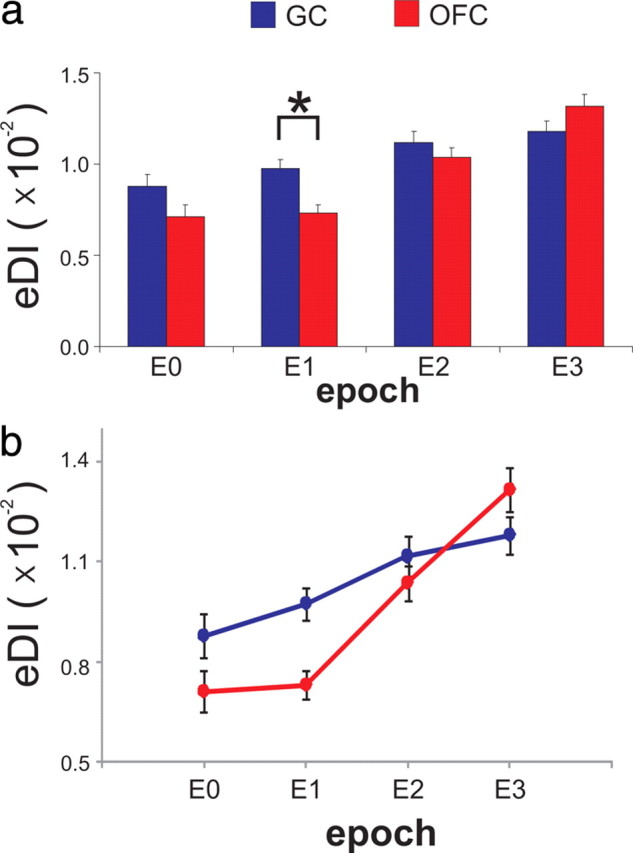
The ensemble discrimination index (eDI) increases from E0 to E3. a, The eDI (mean ± SEM) for E0–E3 as a function of region. b, The eDI for E0–E3 for data in a displayed as a line-plot to better illustrate the eDI increase across Epochs and regions.
As seen in Figure 5b, in each region the eDIs changed across E0–E3 albeit at different rates. To determine how the eDIs changed across Epochs, a post hoc contrast analysis was conducted on each region separately. We focused on E1–E3, which represents the time during which the rat was terminating dry licking on the Sample spout (E1) as well as the execution of the choice response (E2–E3). In both GC (F(1,18) = 12.3, p = 0.003) and OFC (F(1,18) = 107.5, p < 0.001), a linear effect of Epoch on eDI was obtained. Although the eDI increased linearly across E1–E3 in GC and OFC, the change was greater in OFC. To confirm this, we compared the mean change in the eDI (ΔeDI) across E1–E3 in GC and OFC and found that the ΔeDI was significantly greater in OFC compared with GC (meanGC ± SE = 2.1 × 10⁻³ ± 5.9 × 10⁻⁴, meanOFC ± SE = 5.9 × 10⁻³ ± 5.6 × 10⁻⁴; paired t test, t(18) = 4.23, p < 0.001).
Overall, these results revealed that the spatiotemporal ensemble patterns obtained from neurons recorded in GC and OFC changed such that after NaCl delivery their response selectivity increased at different rates. Moreover, these results show that during E1, GC ensembles were significantly more response selective than those from OFC. Note that the NaCl solution was delivered only during the first 60% (2 licks or ∼300 ms) of E0 (Fig. 1a) and ∼1.5 s (∼10 dry licks) reliably passed between the last NaCl delivery and the final dry lick on the Sample spout during the trial (E1). This is important because although the rat was freely licking on the Sample spout during E1, no solution was delivered during this time and thus the greater response selectivity during this Epoch might reflect information regarding the forthcoming choice response.
In GC, but not OFC, the increase in response selectivity depends on whether the choice response is guided by NaCl
Each choice response is a lateralized movement in different directions (e.g., to the rat's left or right), but with a common starting point at the Sample spout. Therefore, the spatial topography of the two choice responses (i.e., the spatiomotor properties) diverges from start to finish. Accordingly, for each choice response we initially asked whether the change in the eDI across E1–E3 could be accounted for by differences in each choice response's spatiomotor properties. To determine whether this is the case, we first defined a Post-Choice condition, which takes place after the rat makes a response on the choice spout. This Post-Choice condition is composed of three new 500 ms Epochs (C1–C3). In particular, C1–C3 describes the time during which the rat prepares to terminate its response on the Choice spout and then make a lateralized response (left or right) toward the Sample spout to start a new trial (Fig. 6a). Therefore, the rat's behaviors from a movement perspective are analogous during the E1–E3 and C1–C3 Epochs. If the eDIs increase simply reflects the growing difference between spatiomotor properties of each response, then the eDI during the C1–C3 Post-Choice condition should increase to the same degree as that observed during E1–E3, or the Post-Cue condition (Fig. 6b).
Figure 6.

The laterally directed choice (E1–E3) responses are compared with the laterally directed responses that precede the start of a trial (C1–C3). a, A continuation of the single trial depicted in Figure 1a, in relation to the rat's movements after a water reward is delivered. Licks on a particular spout are depicted as vertical ticks. Color-coded bars are placed over licks that are followed by solution delivery (blue = water). The C1–C3 time periods are highlighted in beige together with the E1–E3 time periods. Black lines that connect the E1–C1, E2–C2 and E3–C3 time periods are considered to be analogous in regard to the type of behavior in which the rat is engaging. b, Depicts the left- and right-directed movement in egocentric space for the Post-Cue (left) and Post-Choice (right) condition.
Figure 7a shows the eDIs for GC neurons during both Post-Cue and Post-Choice conditions. A two-way ANOVA with repeated-measures on factor Epoch (here we use Epoch to refer to E1–E3 and C1–C3) and Condition (Post-Cue or Post-Choice) revealed that the eDIs differed across Epochs (F(2,36) = 3.33, p = 0.05) and between Conditions (F(1,18) = 5.23, p = 0.03). Moreover, there was an interaction between Epoch and Condition (F(2,36) = 6.04, p = 0.005), which indicates that the difference in the eDIs between conditions depended on the Epoch. Post hoc comparisons (Tukey's HSD) confirmed that the eDI differed between conditions during E3 (p = 0.02) but not during E1 (p = 0.87) or E2 (p = 0.06). Under each condition we conducted a separate contrast analysis on the eDI to determine, in each condition, whether it changed linearly across Epochs. Whereas the eDI increases linearly in the Post-Cue condition (F(1,18) = 20.22, p < 0.001), it did not increase in the Post-Choice condition (F(1,18) = 0.22, p = 0.64). This result is most clearly seen in Figure 7b, which displays the same data from Figure 7a as a line-plot. Indeed, in the GC the mean change in the ΔeDI across E1–E3 was greater than the mean change across C1–C3 (meanpost-cue ± SE = 2.4 × 10⁻³ ± 5.4 × 10⁻⁴, meanpost-choice ± SE = 0.3 × 10⁻³ ± 6.2 × 10⁻⁴; paired t test; t(18) = 3.54, p = 0.002). In fact, unlike the changes observed during E1–E3 (single-sample t test, Ho: eDIE3 − eDIE1 = 0; t(18) = 4.50, p < 0.001) there was no change across C1–C3 (single-sample t test, Ho: eDIC3 − eDIC1 = 0; t(18) = 0.47, p = 0.64).
For the OFC responses the mean eDI across the Post-Cue (E1–E3) and Post-Choice (C1–C3) conditions is illustrated in Figure 7c. Here the eDI differed across Epochs (F(2,36) = 34.84, p < 0.001) and between Conditions (F(1,18) = 11.10, p = 0.004). An interaction between Epoch and Condition was found (F(2,36) = 7.52, p = 0.002), which indicates that the difference in the eDIs between conditions depends on the Epoch. During E3, post hoc comparisons (Tukey's HSD) confirmed that the eDIs differed between conditions (p = 0.005) but not during E1 (p = 0.78) or E2 (p = 0.06). However, unlike in GC, in the OFC the contrast analyses confirmed a linear change in the eDI during both the Post-Cue (F(1,18) = 36.63, p < 0.001) and Post-Choice (F(1,18) = 31.77, p < 0.001) condition. This result is illustrated in Figure 7d, which displays the same data from Figure 7c as a line-plot. Although the eDI increased in both conditions (single-sample t test, Ho: eDIC3 - eDIC1 = 0; Post-Cue: t(18) = 6.05, p < 0.001; Post-Choice: t(18) = 5.64, p < 0.001, the change was greater in the Post-Cue condition. The ΔeDI differed between the Post-Cue and Post-Choice conditions (meanpost-cue ± SE = 6.5 × 10⁻³ ± 1.1 × 10⁻³, meanpost-choice ± SE = 2.6 × 10⁻³ ± 4.7 × 10⁻⁴; paired t test; t(18) = 3.36, p = 0.003).
Overall, the results from these analyses suggest that in GC the increase in response selectivity during E1–E3 depends on the NaCl cue guiding the choice response. However, compared with GC the increase in response selectivity across E1–E3 in OFC is less dependent on the NaCl cue guiding the choice response. Indeed, the response selectivity in OFC increases during behaviors that are similar to the choice response from a spatiomotor standpoint.
The OFC contains distinct neuronal ensembles that encode different types of task-relevant information
As seen above, the response selectivity in OFC ensemble's increases during both conditions but at different rates. This observation raises two important questions. First, do different neuronal ensembles within the OFC exclusively activate during Post-Cue or Post-Choice conditions? Second, if so, do these ensembles differ in their response selectivity, which might explain the different rates at which the eDI increases during Post-Cue and–Choice conditions?
To address these questions, we first identified the mean proportion of OFC neurons that increased their response rate exclusively during the Post-Cue (across E1–E3) or Post-Choice conditions (across C1–C3) (Fig. 8a). Then we obtained the proportion of neurons activated in “Both” conditions (across similar time-periods in each condition: where E1 C1, E2C2, E3C3). For comparison, we also provide the same data for the GC responses. Compared with OFC neurons, we found a higher proportion of GC neurons that are active exclusively during the Post-Cue period (χ2 test, p = 0.002). Figure 8a shows that a small proportion of neurons in GC are active during Post-Choice and Both conditions. However, compared with GC, there is a higher proportion of OFC neurons active during the Post-Choice condition (χ2 test, p = 0.02), and especially under Both conditions (χ2 test, p < 0.001). These results suggest that there exists in OFC a more diverse range of task-relevant information, which is encoded by distinct neuronal ensembles within the region.
Figure 8.
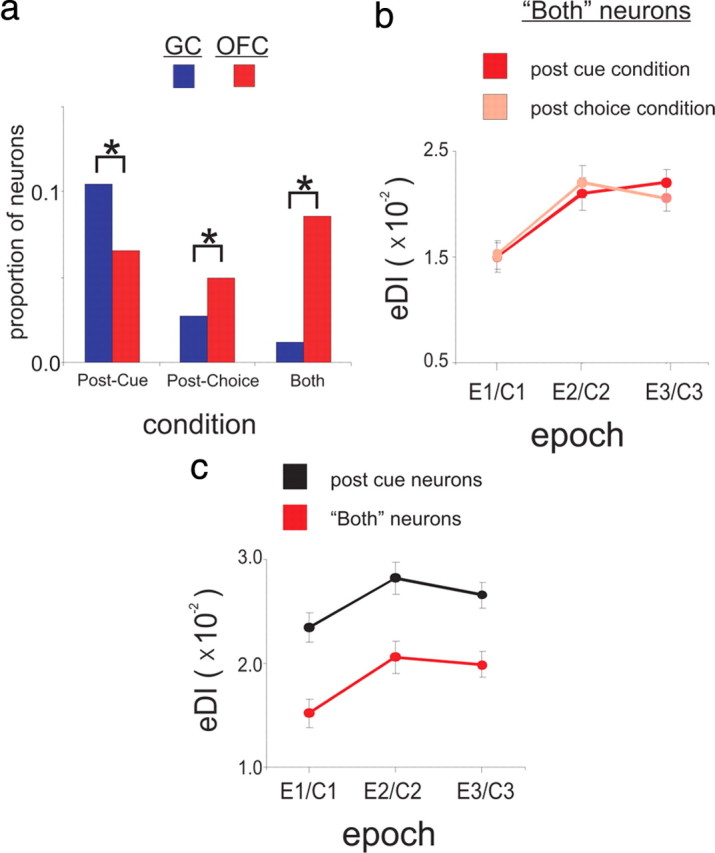
The OFC contains three distinct neuronal ensembles that are differentiated by when they become active in relation to the Choice response. a, A bar graph showing the relative proportions of neurons active in the Post-Cue (left), Post-Choice (center), or Both (right) conditions in GC (red) and OFC (blue). A black line that bridges two bars indicates a significant difference (p < 0.05; χ2 test) between the groups represented by each bar. b, The eDI (mean ± SEM) for OFC Both neurons during the Post-Cue (light blue) or Post-Choice (dark blue) condition and as a function of Epoch (where we assumed E1C1, E2C2 and E3C3 for the analysis). c, The eDI (mean ± SEM) for OFC Both neurons (light blue—see text) and OFC Post-Choice neurons (black—see text) only during the Post-Choice condition and expressed as a function of C1–C3.
Given the relatively large proportion of OFC neurons active during each of the three conditions, we performed additional analyses to better characterize the function of each neuronal ensemble by conducting a two-way ANOVA on the eDI with repeated measures on factor Condition (Post-Cue or Post-Choice) and Epoch (where we assumed E1C1, E2C2 and E3C3 for the analysis). In fact, the response selectivity from OFC neurons active during Both conditions were the same during the Post-Cue and Post–Choice condition (no main effect of Condition F(1,86) = 0.53, p = 0.47) (Fig. 8b). There was, however, a main effect on the eDI of Epoch (F(2,86) = 9.40, p < 0.001), but no interaction between the two factors (F(2,86) = 0.32, p = 0.73). This finding is consistent with the proposal that OFC ensembles encode spatiomotor properties of the response itself, which are equivalent between conditions. This conclusion is also consistent with a recent study reporting the encoding of spatiomotor properties by OFC neurons (Feierstein et al., 2006). We note that although the two Post-Choice responses share the same direction and distance covered as the two Post-Cue responses, each condition describes a distinctly different behavioral context. We regard the behavioral context as one factor that can distinguish between similar motor responses that take place under different trial conditions. Indeed, the Post-Cue responses are initiated toward a Choice spout before feedback about the taste-guided response is presented. In contrast, the Post-Choice responses are initiated from a Choice spout after feedback about the taste-guided response has been presented. That neurons can exclusively activate during either condition may reflect the encoding of this behavioral context.
The dissociation between spatiomotor and behavioral context encoding during the Post-Choice condition is further supported by a separate analysis that is presented in Figure 8c. A two-way ANOVA was conducted with the eDIs using repeated measures on factors Condition (Both or Post-Choice neurons) and Epoch (where we assumed E1C1, E2C2 and E3C3 for the analysis). Here it is shown that the response selectivity by OFC neurons exclusively active during the Post-Choice conditions is higher than those neurons active during Both conditions There was also an effect of Epoch on the eDI during each Condition (F(2,69) = 3.31, p = 0.04) but no interaction between the two factors (F(2,69) = 0.06, p = 0.93).
These results suggest that across E1–E3, the increase in response selectivity by GC neuronal ensembles, but not those in OFC, depend almost exclusively on the NaCl cue that was processed ∼1.5 s earlier and guides the ongoing choice response. In OFC, two distinct ensembles encode response selectivity with reference to the behavioral context of a rat's movement and a third encodes the spatiomotor properties of responses regardless of behavioral context. A much larger proportion of these latter neuronal populations are recruited in OFC compared with GC. Together, the response selectivity in OFC increases more while the taste cue is used to select and guide a motor response compared with when the taste cue is not guiding behavior. However, the activity from different OFC ensembles appears sufficient to increase response selectivity during motor responses that are executed in the Post-Choice condition.
Discussion
In this study, we simultaneously recorded neuronal ensembles from the rat primary (GC) and secondary (OFC) cortices while rats evaluated the intensity of NaCl cue to guide their selection of a response. During this process, ensembles of GC and OFC neurons both exhibited similar and dynamic activity profiles (Figs. 1, 2). However, our novel analysis allowed us to quantify and thus directly compare encoding by GC and OFC neuronal ensembles for the behavioral response selected by the rat. Importantly, our analyses also revealed how response selective encoding was influenced by certain task-relevant variables.
We found that within 500 ms of a NaCl-cue delivery (E0), neuronal ensembles from both GC and OFC were response selective at comparable levels (Fig. 5a). As preference can increase as a function of tastant concentration (i.e., intensity), the increase in OFC may reflect affective value of the stimulus, whereas in GC it may reflect its perceived intensity (Small et al., 2003). However, in neither region did the ensembles exhibit an effect of concentration on response selectivity. This observation suggests that the eDI measure is more a reflection of the behavioral response selected rather than the sensory features being used to guide the process.
One major finding was that before response execution (E1), neuronal ensembles in GC differentiate the animal's behavioral response selection better than neuronal ensembles in OFC (Fig. 5a). During E1 the rats were licking without receiving any fluid, suggesting that they were using this time to make a decision. We considered the possibility that during E1 the increased response selectivity observed in GC arises from NaCl that remains on the rat's tongue after its delivery. However, the response selectivity and its change across E0–E3 in GC and OFC did not depend on NaCl concentration. Nevertheless, we did not monitor whether the animal swallowed during this period (Weijnen et al., 1984; Travers and Jackson, 1992) although freely licking rats are observed to swallow regularly every 5–8 licks (Weijnen, 1998). That rats dry lick ∼10 times before the end of E1 suggests that the likelihood of NaCl remaining on the tongue the entire time is highly unlikely.
If the GC's greater response selectivity during E1 is not exclusively attributable to chemosensory information, what can account for the difference between it and the OFC response? One explanation is that the GC contributes more than the OFC to the taste-guided response that is about to be selected (Fig. 4a). Here we note that a higher proportion of GC neurons follow a late time course of responding to NaCl (Fig. 1c). These neurons responded when dry licking began and peaked at the very end of the dry lick sequence on the Sample spout. We also found that particularly during E1 (Fig. 3; supplemental Fig. S2a, available at www.jneurosci.org as supplemental material), event-related GC neurons were more oscillatory within the 6–10 Hz (theta) range than OFC neurons. Many other “natural” behaviors used to sample sensory stimuli take place in the 6–10 Hz (theta) range such as sniffing (Komisaruk, 1970; Macrides et al., 1982), whisking (Semba and Komisaruk, 1984; Nicolelis et al., 1995) and eye movements during restrained but active exploration (Kemp and Kaada, 1975). Because theta rhythm is hypothesized to contribute to information transfer (Siapas et al., 2005) and sensorimotor integration (Nicolelis et al., 1995; Bland and Oddie, 2001; Kay, 2005; Bland et al., 2006) among brain structures, we speculate that ongoing GC activity within the theta range facilitates taste-related information transfer across brain regions to guide response selection. These findings further challenge a strict chemosensory interpretation of E1 response and support a more prominent role for rodent GC than OFC in response selectivity during this Epoch.
In light of our results, it is useful to consider an important series of experiments conducted with monkeys (Ifuku et al., 2002, 2003, 2006). Their results indicated that lower order cortical regions (area G and orosensory regions of area 3) contribute more to processing the basic chemosensory properties of the taste rather than response selection. In this way, response-selective information is thought to increase while gustatory information ascends the cortical taste hierarchy (Ogawa et al., 2005).
On the other hand, a recent report confirms a prominent cognitive role for the monkey's GC in a task that makes large demands on taste working memory (Lara et al., 2009). In this experiment, a comparable proportion of GC and OFC neurons selectively encoded the representation of a specific taste that had to be sustained over the course of a delay period so that a response could eventually be selected. In addition, an equivalent proportion of GC and OFC neurons encoded the behavioral response selected.
Taking into account the obvious differences among the studies (e.g., species, task, analyses), all of these results may be reconciled if GC function is particularly sensitive to demands for maintaining or retrieving a representation of a taste feature over time (E1) to guide response selection. In our task, correct response selection requires that the NaCl intensity is accurately perceived during E0 and maintained until (or available by) the end of E1, which is ∼1.5 s later. Given that two licks (∼300 ms) is sufficient time for a trained rat to discriminate among qualities of tastants (Halpern and Tapper, 1971), the animals may use this additional time to select a response based on “within-quality” discrimination among NaCl intensities.
We believe our emphasis on GC's role in taste-guided response selection is consistent with a long-standing proposal that it is fundamental to acquisition and the normal expression of learned behaviors that are cued by taste, as is the case with conditioned taste aversion (CTA—Braun et al., 1982; Kiefer et al., 1984; Braun, 1990). Indeed, both lesion (Lorden, 1976; Yamamoto et al., 1980; Braun et al., 1981; Kiefer et al., 1984; Braun, 1990) and imaging (Yasoshima and Yamamoto, 1998; Accolla and Carleton, 2008; Grossman et al., 2008) studies not only confirm a role for the GC in CTA acquisition but also in retention (i.e., the expression of a CTA). Our results extend these findings outside the CTA context and show that neuronal ensemble activity in GC dynamically reflects the retention and expression of a learned behavioral response that is selected because of a taste cue.
What is the nature of the increase in response selectivity by GC and OFC while the choice response is in progress?
We showed that while the rat is making a taste-guided choice response the spatiotemporal patterns of activity recorded from neuronal ensembles in GC and OFC diverge (Fig. 5). This divergence depends on differential activation in GC and OFC by task-relevant variables, which are encoded while carrying out the taste-guided response. During the taste-guided response, the increase in GC response selectivity depends on the taste-cue guiding the response (Fig. 7a,b). During the same time, the response selectivity in OFC increased much faster than GC, although this effect is less dependent on taste per se than in GC (Fig. 7c,d). In contrast, the OFC provides a “richer” representation of the taste-guided response. One population of OFC neurons activates similarly under two distinctly different behavioral contexts, which likely reflects the encoding of spatiomotor information (Fig. 8a,b). However, there are also OFC neurons that encode responses that are similar from a spatiomotor perspective, but differ in relation to whether feedback has been given about its choice response (Fig. 8a,c). In this way, the OFC can disambiguate similar spatiomotor responses by means of task-relevant information. This finding is also consistent with a function in globally monitoring goal-directed responses (Feierstein et al., 2006). Indeed, our results extend these conclusions by confirming an important role for the OFC in responses selected by a taste cue.
A system's level approach to sensory-guided behavior reveals neuronal population dynamics that differ between regions
The sensory-guided decision and subsequent response made by an organism is in fact expressed as an organized sequence of behaviors that unfold over time. We emphasize a systems level approach to understanding how multiple brain regions cooperate to mediate this complex process (MacDonald and Meck, 2004; Nicolelis, 2007). By making explicit comparisons between brain regions from which neurons are simultaneously recorded, one can better separate the functional contributions of these areas to taste-related decision making. Our results provide support for a distributed cortical network that mediates taste-guided decision making. Although generally GC and OFC neurons activate similarly during a taste-guided decision, each region in the network can be distinguished by their relative contribution to what types of information (e.g., taste and/or spatial) are encoded and when the encoding takes place while taste is guiding a response to obtain an outcome. Importantly, our results also suggest that the function of the primary taste cortex is intimately tied to encoding relations between the taste and any learned response that is eventually selected and executed as a result of the taste. In this way, the GC may act as a specialized (i.e., taste specific) sensorimotor interface to mediate the expression of taste-guided behavior.
Footnotes
This work was supported in part by National Institutes of Health Grant DC-01065. We thank Dr. Ivan de Araujo for his comments and Jim Meloy and Gary Lehew for their technical expertise.
References
- Accolla R, Carleton A. Internal body state influences topographical plasticity of sensory representations in the rat gustatory cortex. Proc Natl Acad Sci U S A. 2008;105:4010–4015. doi: 10.1073/pnas.0708927105. [DOI] [PMC free article] [PubMed] [Google Scholar]
- Bland BH, Jackson J, Derrie-Gillespie D, Azad T, Rickhi A, Abriam J. Amplitude, frequency, and phase analysis of hippocampal theta during sensorimotor processing in a jump avoidance task. Hippocampus. 2006;16:673–681. doi: 10.1002/hipo.20210. [DOI] [PubMed] [Google Scholar]
- Bland BH, Oddie SD. Theta band oscillation and synchrony in the hippocampal formation and associated structures: the case for its role in sensorimotor integration. Behav Brain Res. 2001;127:119–136. doi: 10.1016/s0166-4328(01)00358-8. [DOI] [PubMed] [Google Scholar]
- Boakes RA. The bisection of a brightness interval by pigeons. J Exp Anal Behav. 1969;12:201–209. doi: 10.1901/jeab.1969.12-201. [DOI] [PMC free article] [PubMed] [Google Scholar]
- Braun JJ. Gustatory cortex: definition and function. In: Kolb B, Tees RC, editors. The cerebral cortex of the rat. Cambridge, MA: MIT; 1990. pp. 407–430. [Google Scholar]
- Braun JJ, Kiefer SW, Ouellet JV. Psychic ageusia in rats lacking gustatory neocortex. Exp Neurol. 1981;72:711–716. doi: 10.1016/0014-4886(81)90020-0. [DOI] [PubMed] [Google Scholar]
- Braun JJ, Lasiter PS, Kiefer SW. The gustatory neocortex of the rat. Physiol Psychol. 1982;10:13–45. [Google Scholar]
- Carstens E, Kuenzler N, Handwerker HO. Activation of neurons in rat trigeminal subnucleus caudalis by different irritant chemicals applied to oral or ocular mucosa. J Neurophysiol. 1998;80:465–492. doi: 10.1152/jn.1998.80.2.465. [DOI] [PubMed] [Google Scholar]
- Fagot RF. On the psychophysical law and estimation procedures in psychophysical scaling. Psychometrika. 1963;28:145–160. [Google Scholar]
- Feierstein CE, Quirk MC, Uchida N, Sosulski DL, Mainen ZF. Representation of spatial goals in rat orbitofrontal cortex. Neuron. 2006;51:495–507. doi: 10.1016/j.neuron.2006.06.032. [DOI] [PubMed] [Google Scholar]
- Glimcher PW. Making choices: the neurophysiology of visual-saccadic decision making. Trends Neurosci. 2001;24:654–659. doi: 10.1016/s0166-2236(00)01932-9. [DOI] [PubMed] [Google Scholar]
- Grossman SE, Fontanini A, Wieskopf JS, Katz DB. Learning-related plasticity of temporal coding in simultaneously recorded amygdala-cortical ensembles. J Neurosci. 2008;28:2864–2873. doi: 10.1523/JNEUROSCI.4063-07.2008. [DOI] [PMC free article] [PubMed] [Google Scholar]
- Halpern BP, Tapper DN. Taste stimuli: quality coding time. Science. 1971;171:1256–1258. doi: 10.1126/science.171.3977.1256. [DOI] [PubMed] [Google Scholar]
- Ifuku H, Ohgushi M, Ito S, Ogawa H. Neurons associated with behavioral context errors in the primary and higher-order gustatory cortices in the monkey. Neurosci Lett. 2002;319:121–123. doi: 10.1016/s0304-3940(01)02546-0. [DOI] [PubMed] [Google Scholar]
- Ifuku H, Hirata S, Nakamura T, Ogawa H. Neuronal activities in the monkey primary and higher-order gustatory cortices during a taste discrimination delayed GO/NOGO task and after reversal. Neurosci Res. 2003;47:161–175. doi: 10.1016/s0168-0102(03)00194-9. [DOI] [PubMed] [Google Scholar]
- Ifuku H, Nakamura T, Hirata S, Ogawa H. Neuronal activities in the reward phase in primary and higher-order gustatory cortices of monkeys. Neurosci Res. 2006;55:54–64. doi: 10.1016/j.neures.2006.02.001. [DOI] [PubMed] [Google Scholar]
- Kay LM. Theta oscillations and sensorimotor performance. Proc Natl Acad Sci U S A. 2005;102:3863–3868. doi: 10.1073/pnas.0407920102. [DOI] [PMC free article] [PubMed] [Google Scholar]
- Kemp IR, Kaada BR. The relation of hippocampal theta activity to arousal, attentive behaviour and somato-motor movements in unrestrained cats. Brain Res. 1975;95:323–342. doi: 10.1016/0006-8993(75)90110-9. [DOI] [PubMed] [Google Scholar]
- Kiefer SW, Leach LR, Braun JJ. Taste agnosia following gustatory neocortex ablation: dissociation from odor and generality across taste qualities. Behav Neurosci. 1984;98:590–608. doi: 10.1037//0735-7044.98.4.590. [DOI] [PubMed] [Google Scholar]
- Komisaruk BR. Synchrony between limbic system theta activity and rhythmical behavior in rats. J Comp Physiol Psychol. 1970;70:482–492. doi: 10.1037/h0028709. [DOI] [PubMed] [Google Scholar]
- Lara AH, Kennerley SW, Wallis JD. Encoding of gustatory working memory by orbitofrontal neurons. J Neurosci. 2009;29:765–774. doi: 10.1523/JNEUROSCI.4637-08.2009. [DOI] [PMC free article] [PubMed] [Google Scholar]
- Lorden JF. Effects of lesions of the gustatory neocortex on taste aversion learning in the rat. J Comp Physiol Psychol. 1976;90:665–679. doi: 10.1037/h0077237. [DOI] [PubMed] [Google Scholar]
- MacDonald CJ, Meck WH. Systems-level integration of interval timing and reaction time. Neurosci Biobehav Rev. 2004;28:747–769. doi: 10.1016/j.neubiorev.2004.09.007. [DOI] [PubMed] [Google Scholar]
- Macrides F, Eichenbaum HB, Forbes WB. Temporal relationship between sniffing and the limbic theta rhythm during odor discrimination reversal learning. J Neurosci. 1982;2:1705–1717. doi: 10.1523/JNEUROSCI.02-12-01705.1982. [DOI] [PMC free article] [PubMed] [Google Scholar]
- Nicolelis MAL. Boca Raton, FL: CRC; 2007. Methods for neural ensemble recordings. [PubMed] [Google Scholar]
- Nicolelis MA, Baccala LA, Lin RC, Chapin JK. Sensorimotor encoding by synchronous neural ensemble activity at multiple levels of the somatosensory system. Science. 1995;268:1353–1358. doi: 10.1126/science.7761855. [DOI] [PubMed] [Google Scholar]
- O'Doherty JP. Lights, camembert, action! The role of human orbitofrontal cortex in encoding stimuli, rewards, and choices. Ann N Y Acad Sci. 2007;1121:254–272. doi: 10.1196/annals.1401.036. [DOI] [PubMed] [Google Scholar]
- Ogawa H, Ifuku H, Nakamura T, Hirata S. Possible changes in information from the primary to higher-order gustatory cortices, studied by recording neural activities during a taste discrimination GO/NOGO task in monkeys. Chem Senses. 2005;30(Suppl 1):i78–i79. doi: 10.1093/chemse/bjh122. [DOI] [PubMed] [Google Scholar]
- Penney TB, Gibbon J, Meck WH. Categorical scaling of duration bisection in pigeons (Columba livia), mice (Mus musculus), and humans (Homo sapiens) Psychol Sci. 2008;19:1103–1109. doi: 10.1111/j.1467-9280.2008.02210.x. [DOI] [PubMed] [Google Scholar]
- Price JL. Definition of the orbital cortex in relation to specific connections with limbic and visceral structures and other cortical regions. Ann N Y Acad Sci. 2007;1121:54–71. doi: 10.1196/annals.1401.008. [DOI] [PubMed] [Google Scholar]
- Rolls ET. The functions of the orbitofrontal cortex. Brain Cogn. 2004;55:11–29. doi: 10.1016/S0278-2626(03)00277-X. [DOI] [PubMed] [Google Scholar]
- Schall JD. Neural correlates of decision processes: neural and mental chronometry. Curr Opin Neurobiol. 2003;13:182–186. doi: 10.1016/s0959-4388(03)00039-4. [DOI] [PubMed] [Google Scholar]
- Schoenbaum G, Chiba AA, Gallagher M. Orbitofrontal cortex and basolateral amygdala encode expected outcomes during learning. Nat Neurosci. 1998;1:155–159. doi: 10.1038/407. [DOI] [PubMed] [Google Scholar]
- Schultz W. Neural coding of basic reward terms of animal learning theory, game theory, microeconomics and behavioural ecology. Curr Opin Neurobiol. 2004;14:139–147. doi: 10.1016/j.conb.2004.03.017. [DOI] [PubMed] [Google Scholar]
- Semba K, Komisaruk BR. Neural substrates of two different rhythmical vibrissal movements in the rat. Neuroscience. 1984;12:761–774. doi: 10.1016/0306-4522(84)90168-4. [DOI] [PubMed] [Google Scholar]
- Shadlen MN, Newsome WT. Motion perception: seeing and deciding. Proc Natl Acad Sci U S A. 1996;93:628–633. doi: 10.1073/pnas.93.2.628. [DOI] [PMC free article] [PubMed] [Google Scholar]
- Shi CJ, Cassell MD. Cortical, thalamic, and amygdaloid connections of the anterior and posterior insular cortices. J Comp Neurol. 1998;399:440–468. doi: 10.1002/(sici)1096-9861(19981005)399:4<440::aid-cne2>3.0.co;2-1. [DOI] [PubMed] [Google Scholar]
- Siapas AG, Lubenov EV, Wilson MA. Prefrontal phase locking to hippocampal theta oscillations. Neuron. 2005;46:141–151. doi: 10.1016/j.neuron.2005.02.028. [DOI] [PubMed] [Google Scholar]
- Small DM, Gregory MD, Mak YE, Gitelman D, Mesulam MM, Parrish T. Dissociation of neural representation of intensity and affective valuation in human gustation. Neuron. 2003;39:701–711. doi: 10.1016/s0896-6273(03)00467-7. [DOI] [PubMed] [Google Scholar]
- Stapleton JR, Lavine ML, Wolpert RL, Nicolelis MA, Simon SA. Rapid taste responses in the gustatory cortex during licking. J Neurosci. 2006;26:4126–4138. doi: 10.1523/JNEUROSCI.0092-06.2006. [DOI] [PMC free article] [PubMed] [Google Scholar]
- Stevens SS. On the psychophysical law. Psychol Rev. 1957;64:153–181. doi: 10.1037/h0046162. [DOI] [PubMed] [Google Scholar]
- Travers JB, Jackson LM. Hypoglossal neural activity during licking and swallowing in the awake rat. J Neurophysiol. 1992;67:1171–1184. doi: 10.1152/jn.1992.67.5.1171. [DOI] [PubMed] [Google Scholar]
- Wallis JD. Orbitofrontal cortex and its contribution to decision-making. Annu Rev Neurosci. 2007;30:31–56. doi: 10.1146/annurev.neuro.30.051606.094334. [DOI] [PubMed] [Google Scholar]
- Weijnen JA. Licking behavior in the rat: measurement and situational control of licking frequency. Neurosci Biobehav Rev. 1998;22:751–760. doi: 10.1016/s0149-7634(98)00003-7. [DOI] [PubMed] [Google Scholar]
- Weijnen JA, Wouters J, van Hest JM. Interaction between licking and swallowing in the drinking rat. Brain Behav Evol. 1984;25:117–127. doi: 10.1159/000118857. [DOI] [PubMed] [Google Scholar]
- Yamamoto T, Matsuo R, Kawamura Y. Localization of cortical gustatory area in rats and its role in taste discrimination. J Neurophysiol. 1980;44:440–455. doi: 10.1152/jn.1980.44.3.440. [DOI] [PubMed] [Google Scholar]
- Yamamoto T, Shimura T, Sako N, Yasoshima Y, Sakai N. Some critical factors involved in formation of conditioned taste aversion to sodium chloride in rats. Chemical Senses. 1994;19:209–217. doi: 10.1093/chemse/19.3.209. [DOI] [PubMed] [Google Scholar]
- Yasoshima Y, Yamamoto T. Short-term and long-term excitability changes of the insular cortical neurons after the acquisition of taste aversion learning in behaving rats. Neuroscience. 1998;84:1–5. doi: 10.1016/s0306-4522(97)00636-2. [DOI] [PubMed] [Google Scholar]