Abstract
Human type 2 diabetes mellitus (T2DM) is often characterized by obesity-associated insulin resistance (IR) and β-cell function deficiency. Development of relevant large animal models to study T2DM is important and timely, because most existing models have dramatic reductions in pancreatic function and no associated obesity and IR, features that resemble more T1DM than T2DM. Our goal was to create a canine model of T2DM in which obesity-associated IR occurs first, followed by moderate reduction in β-cell function, leading to mild diabetes or impaired glucose tolerance. Lean dogs (n = 12) received a high-fat diet that increased visceral (52%, P < 0.001) and subcutaneous (130%, P < 0.001) fat and resulted in a 31% reduction in insulin sensitivity (SI) (5.8 ± 0.7 × 10⁻⁴ to 4.1 ± 0.5 × 10⁻⁴ μU·ml−1·min−1, P < 0.05). Animals then received a single low dose of streptozotocin (STZ; range 30–15 mg/kg). The decrease in β-cell function was dose dependent and resulted in three diabetes models: 1) frank hyperglycemia (high STZ dose); 2) mild T2DM with normal or impaired fasting glucose (FG), 2-h glucose >200 mg/dl during OGTT and 77–93% AIRg reduction (intermediate dose); and 3) prediabetes with normal FG, normal 2-h glucose during OGTT and 17–74% AIRg reduction (low dose). Twelve weeks after STZ, animals without frank diabetes had 58% more body fat, decreased β-cell function (17–93%), and 40% lower SI. We conclude that high-fat feeding and variable-dose STZ in dog result in stable models of obesity, insulin resistance, and 1) overt diabetes, 2) mild T2DM, or 3) impaired glucose tolerance. These models open new avenues for studying the mechanism of compensatory changes that occur in T2DM and for evaluating new therapeutic strategies to prevent progression or to treat overt diabetes.
Keywords: obesity, animal models, streptozotocin, insulin secretion
type 2 diabetes mellitus (T2DM) is a highly prevalent disease with an enormous public and individual health impact. According to the Centers for Disease Control National Diabetes Fact Sheet, in 2007 23.6 million people in the US (7.8% of population) had diabetes, and an estimated 57 million people had prediabetes [impaired fasting glucose (IFG), impaired glucose tolerance (IGT), or both] (10). The disease's increasing prevalence requires adequate and strong intervention for prevention of new cases and new or improved therapeutic tools for the existing cases (11). T2DM is characterized by a combination of resistance to insulin action and an inadequate compensatory insulin secretory response and is usually associated with obesity (15). Increased body fat and especially visceral fat accumulation have been shown to be risk factors for the development of IGT or diabetes (14). The mechanisms of the initial alterations in the development of T2DM, related to fat deposition and the associated changes in liver, muscle, and adipocyte, are not fully elucidated. Studying the relationship between insulin resistance and hyperinsulinemic compensation (or failure thereof) and the change from normal glucose tolerance to IGT and finally to T2DM requires complex interventional, closely controlled studies that are not always possible in humans.
The search for better understanding of complex mechanisms of human T2DM and the need for new therapy emphasize the role of appropriate animal models that reproduce the natural history and the characteristics and causes of T2DM in humans. Rodent models have provided useful insights in the physiopathology of T2DM (26). However, there remains a need for large animal models that reproduce the natural history of T2DM and also allow for invasive clinical measurements that can be followed longitudinally. Canine, swine (pig or minipig), and nonhuman primate animal models of diabetes are currently available. In most of these models, pancreatectomy or chemical alteration of β-cells [streptozotocin (STZ), alloxan] is used to induce diabetes (as reviewed in Refs. 3, 33, and 38). The resulting phenotype is often characterized by frank hyperglycemia with dramatic reduction in insulin secretion, but without obesity and associated insulin resistance. Such models can be of substantial value in studying the complications of diabetes and the effect of prolonged hyperglycemia, but they may be less suitable for studying the milder changes that occur in the preclinical stages of type 2 diabetes, i.e., “prediabetes” and the factors involved in progression to overt fasting hyperglycemia and loss of glucose tolerance.
We have previously developed a high-fat, high-calorie diet model of canine obesity and insulin resistance. Although weight gain is modest (∼10–15%), the animals exhibit a significant 76% increase in body fat (in both the visceral and subcutaneous depots) and an ∼30% decrease in insulin sensitivity. The reduced insulin sensitivity (SI) is usually compensated adequately by an increase in insulin secretion such that normal glycemia is maintained (22). Similarly, in many obese individuals, insulin resistance is compensated by hyperinsulinemia. Only when less than appropriately reduced insulin output occurs is glycemic control lost, resulting in hyperglycemia (4). The goal of our current study was to create a canine model of mild T2DM in which obesity-associated insulin resistance is first induced, followed by a STZ-induced decrease in pancreatic β-cell function, yielding a syndrome that more closely resembles T2DM or, alternatively, a mild “prediabetic” state.
MATERIALS AND METHODS
Animals
We studied 12 male dogs [initial body weight (BW): 29.0 ± 0.9 kg] housed under controlled kennel conditions in the University of Southern California (USC) Medical School Vivarium. All surgical and experimental procedures were approved by the USC Institutional Animal Care and Use Committee.
Experimental Design
The experimental design is presented in Fig. 1.
Fig. 1.
Experimental design. MA, full metabolic assessment [euglycemic hyperinsulinemic clamp, stepped hyperglycemic clamp, intravenous glucose tolerance test (IVGTT), and oral glucose tolerance test (OGTT)]. STZ, streptozotocin; CON, control.
After of period of acclimatization of 2–3 wk in which animals were presented once a day with a standard diet containing 3,684 kcal/day (27% protein, 38% carbohydrate, and 35% fat), in each animal an initial metabolic assessment was performed to evaluate insulin sensitivity and pancreatic function. All animals were deprived of food for 18 h before the experiments and were studied in the conscious, relaxed state. The metabolic assessment consisted of three protocols: 1) a hyperinsulinemic euglycemic clamp (EGC), 2) a stepped hyperglycemic clamp (HGC), and 3) an intravenous glucose tolerance test (IVGTT). Additionally, 4) in some of the animals oral glucose tolerance tests (OGTTs) were performed to assess the possible contribution of gastrointestinal hormones to glycemic control. In all animals, abdominal MRI was performed to assess body composition. After the initial characterization, animals were placed on a high-fat hypercaloric diet (5,110 kcal/day: 20% from protein, 27% from carbohydrate, and 53% from fat), and they remained on this diet for the rest of the study. After 6–8 wk of the hypercaloric diet, the animals underwent a second period of metabolic assessment (IVGTT, EGC, HGC, and OGTT) and an MRI. Animals then received one dose of STZ by intravenous injection followed by IVGTTs at 1 and 2 wk post-STZ and full metabolic assessment and MRI at 4 and 10 wk after STZ. Weekly fasting plasma samples were taken to measure glucose, insulin, C-peptide, and other parameters of glucose metabolism. Food intake was measured daily, and body weight was recorded once/wk.
Metabolic Assessments
IVGTT.
Blood samples were drawn from a peripheral vein at −20, −10, and −1 min. Fasting values were defined as the average of the three basal samples. At t = 0, 0.3 g/kg BW glucose (50% dextrose, 454 mg/ml; B Braun, Irvine, CA) was injected into a peripheral vein. Additional samples were taken at 2, 3, 4, 5, 6, 8, 10, 12, 14, 16, and 19 min. At t = 20 min, a bolus of 0.03 U/kg porcine insulin was injected into a peripheral vein followed by sampling at 22, 23, 24, 25, 30, 40, 50, 60, 70, 80, 90, 100, 120, 140, 160, and 180 min.
Euglycemic hyperinsulinemic clamps.
On the morning of the experiment, after a basal plasma sample, a continuous infusion of tritiated glucose (0.25 uCi/min) was initiated in a peripheral vein and maintained for the entire duration of the experiment. After 120 min, peripheral infusions of somatostatin (1 μg·kg−1·min−1) and insulin (0.75 mU·kg−1·min−1) were started and continued for 180 min. Plasma glucose was maintained at euglycemic levels via a variable rate peripheral infusion of glucose spiked with [3-3H]glucose (to avoid large fluctuations in plasma-specific activity).
HGC.
After basal plasma sampling, peripheral glycemia was raised sequentially via an exogenous glucose infusion to three glycemic levels: 100 (t = 0–60 min), 150 (t = 60–150 min), and 200 mg/dl (t = 150–240 min). Plasma samples were obtained every 10 min. Hyperglycemic clamp data was not used for a single animal in the control period.
ECGs and hyperglycemic clamps were not performed in animals if they exhibited fasting hyperglycemia >200 mg/dl.
OGTT.
Basal blood samples were drawn from a peripheral vein at −20, −10, and −1 min. At t = 0, 25 g of glucose (55 ml of 50% dextrose, 454 mg/ml) was given as a bolus by oral gavage. Additional blood samples were taken at 15, 30, 45, 60, 90, 120, and 180 min.
MRI.
Abdominal MRIs were performed in animals fasted overnight using a 1.5 T Gemsow scanner (General Electric). Dogs were preanesthetized with 1.35 mg sc of atropine sulfate (Phoenix Pharmaceuticals, Burlingame, CA) plus 5 mg of acepromazine (Boehringer Ingelheim, St. Joseph, MO) and then anesthetized with a single intravenous dose of a mixed solution of 10 mg/kg ketamine (Bioniche Pharma, Lake Forest, IL) and 0.5 mg/kg diazepam (Bioniche Pharma). The scanning consisted of 30 contiguous slices 1 cm thick [T1 weighted: repetition time = 500 ms (TR 500), echo time = 14.0 ms (TE:14)], placing the first slice at the level of the junction between the inferior limb and the trunk. The left renal hilum was chosen as midpoint landmarks for all sessions.
Induction of Pancreatic Defect with STZ
Animals were fasted overnight and brought to the laboratory, where a peripheral vein catheter was placed. STZ powder (Sigma-Aldrich, St. Louis, MO) was dissolved in citrate buffer solution (HPCE, pH 4.5; Sigma-Aldrich) immediately before injection to obtain a 62.5 mg/ml STZ-citrate solution. One of four STZ doses was used in each animal: 30, 22.5, 18.5, or 15 mg/kg (n = 2 animals for the 30 and 22.5 mg/kg doses, n = 4 for the 18.5 and 15 mg/kg doses). STZ solution was administered within 1 h of mixing via intravenous injection. All animals reacted to STZ administration by vomiting within 1–2 h and reduction of food intake for the following 24–48 h. All animals recovered their food intake and normal behavior 1–7 days after STZ administration. Animals were monitored frequently during the first 48 h to avoid episodes of hypoglycemia.
Monitoring and Assessment
Before the STZ injection, the animals were monitored by daily measurement of food intake and weekly measurement of BW, glucose, insulin, and other plasma measurements. After the STZ injection, plasma glucose was measured daily or twice daily, as necessary, until plasma glucose stabilized. Ketone bodies and glucosuria were monitored using urine test strips (Keto-Diastix; Bayer, White Plains, NY). Renal and hepatic function were assessed before and after treatment with STZ by measurement of serum creatinine, blood urinary nitrogen (BUN), and serum alanine (ALT) and aspartate aminotransferase (AST). Exocrine pancreatic function was assessed by measuring serum amylase and lipase (Antech Diagnostics, Irvine, CA). After STZ administration, some animals developed overt diabetes, with a fasting plasma glucose of >200 mg/dl. In these animals, insulin therapy was initiated 2 days after STZ administration. Intermediate acting insulin (Humulin; Eli Lilly, Indianapolis, IN) was administered subcutaneously once daily at meal time to maintain glycemia <200 mg/dl.
Pancreas Histology and Imaging
Animals were euthanized at the end of the monitoring period with pentobarbital sodium (350 mg/ml, 20-ml iv injection; Virbac, Carros, France), and pancreatic tissue was fixed in 10% formalin. Paraffin-embedded 5-μm sections were immunostained with guinea pig anti-human insulin antibody (Millipore, St. Charles, MO) followed by Cy 2-conjugated donkey anti-guinea pig (Jackson ImmunoResearch, West Grove, PA), as described (19). Fluorescent images were acquired and analyzed using Ariol SL-50 (Applied Imaging, San Jose, CA). The Ariol scanner is based on an Olympus BX61 microscope with motorized stage and autofocus capabilities equipped with a black-and-white video camera (Jai CVM2CL). Slides were scanned at ×20 objective magnification with the 4,6-diamidino-2-phenylindole and FITC filters. Optimal exposure times were determined before automated scanning. After scanning, threshold levels of the individual signals were optimized before final analysis. Analytical readouts of user-defined areas included area of signal (area above threshold), and total area analyzed was calculated by the software. Scanning and analyses were performed through the Translational Pathology Core Laboratory, Department of Pathology and Laboratory Medicine, David Geffen School of Medicine, at the University of California Los Angeles. Islet images were taken at the Multi-Photon Core at the USC Keck School of Medicine using a Leica TCS SP5 AOBS multi-photon confocal microscope system.
Blood Sampling and Assays
Blood samples were collected in heparinized tubes containing EDTA (for glucose, insulin, and lactate), EDTA and Trasylol (for peptides), or EDTA and dipeptidyl peptidase IV inhibitor [for active glucagon-like peptide-1 (GLP-1)]. Plasma glucose concentration was determined using the YSI 2300 autoanalyzer (Yellow Springs Instruments, Yellow Springs, OH), and remaining plasma was stored at −80°C for further analysis. Insulin was measured using a human insulin enzyme-linked immunoassay kit (Millipore) adapted in our laboratory for dog plasma. C-peptide and glucagon were measured using RIA kits (Millipore). Active GLP-1 was measured by ELISA (Millipore). Free fatty acids were determined using a colorimetric assay (Wako, Neuss, Germany). The radioactivity of plasma glucose and tracer infusates was determined as follows; samples were diluted and deproteinized with barium hydroxide and zinc sulfate. After being dried overnight, the samples were resuspended in water, scintillation cocktail was added, and then the samples were measured in a scintillation counter.
Calculations
MRI analysis.
Eleven slices (5 above and 5 below the landmark) were used for analysis of total trunk body fat, visceral fat, and subcutaneous fat. Images were analyzed using Scion Image for Windows (Alpha 4.0.3.2.; Scion, Frederick, MD). Fat was differentiated from nonfat tissue on the basis of pixel intensity. Visceral adipose tissue was defined as the fat located in the intra- and retroperitoneal region, and this region was separated from the subcutaneous adipose tissue by manual trace. For each slice, the area was calculated in cm2 (area of 226 × 256 pixels equivalent to 34.9 × 34.9 cm2) and multiplied by the thickness of the slice to obtain the volume.
IVGTT-derived indexes: calculation of minimal model parameters.
SI and glucose effectiveness (SG) were calculated by the application of the minimal model of glucose kinetics to the time course of glucose and insulin from the IVGTT using MINMOD Millennium software (version 6.02, 2004). The acute insulin response to glucose (AIRg) was calculated as the AUC of the insulin concentrations above the average of the basal values, from 0 to 10 min. The disposition index (DI) was calculated as the product SI × AIRg for each experiment. Kg (glucose tolerance) was calculated as the slope of the linear regression of the natural log of plasma glucose concentration vs. time from 10 to 19 min.
EGC-derived indices.
Endogenous glucose production (EGP) and glucose disappearance (Rd) were calculated using Steele's equation modified for use with labeled glucose infusion (16) after data smoothing using OOPSEG (optimized optimal segments) (9). Whole body insulin sensitivity (SI clamp) was calculated as SI clamp = ΔGinf/(ΔIns × Glcss), where ΔGinf is the increase in glucose infusion from basal to steady state, ΔIns is the increase in insulin from basal to steady state, and Glcss is the steady-state glucose level. Peripheral insulin sensitivity (SI Rd) was calculated as SI Rd = ΔRd/(ΔIns × Glcss), where ΔRd is the change in Rd from basal to steady state. Hepatic SI (SI EGP) was calculated as ΔEGP/(ΔIns × Glcss), where ΔEGP is the change in EGP from basal to steady state.
HGC.
Steady state was defined as the last 30 min of each hyperglycemic step. β-Cell response to glucose was calculated as the slope of the line relating plasma insulin to plasma glucose concentration for each of the three steps of the clamp.
OGTT data analysis.
Post-STZ OGTT glucose and insulin data were compared with glucose and insulin plasma levels from OGTT performed in a lean group of dogs (n = 13, including 5 of the 12 dogs used in the current study; OGTT-CON).
Fasting parameters were calculated (unless indicated otherwise) as the average of all of the fasting values in experiment days for the specific time point.
Statistical Analysis
Results are presented as means ± SE unless indicated otherwise. Statistical analyses were done using t-tests or repeated-measurements ANOVA as appropriate. Area under the curve (AUC) was calculated as increase from basal using the trapezoid rule. All differences were considered statistically significant when P < 0.05.
RESULTS
Induction of Obesity and Insulin Resistance Via a High-Fat Hypercaloric Diet
BW and body composition.
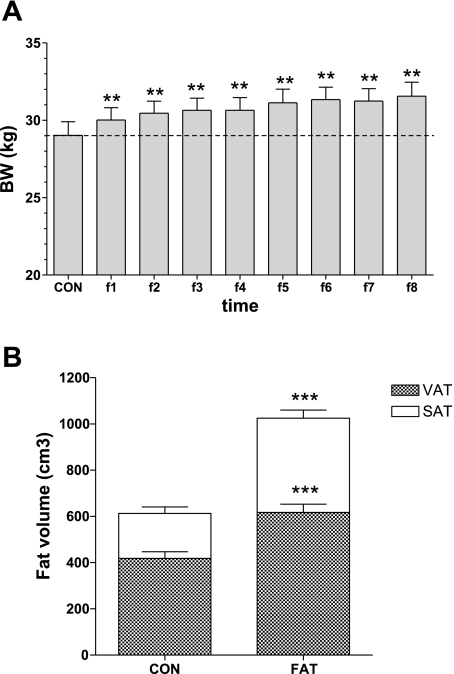
Initiation of fat feeding resulted in a significant increase in body weight (Fig. 2A), an increase that was maintained for the duration of the fat feeding. After 6–8 wk of fat feeding, the average BW was 31.4 ± 0.8 kg, an 8.3% increase from baseline (29.0 ± 0.9 kg, P < 0.0001). This modest increase in overall weight belied a striking 74% increase in total body fat (from MRI, from 613 ± 51 to 1,025 ± 60 cm3; Fig. 2B). There were increases in both visceral (52% increase, from 418 ± 29 to 617 ± 36 cm3) and subcutaneous fat (130% increase, from 195 ± 28 to 408 ± 35 cm3).
Fig. 2.
Body weight (BW; A) and total, visceral, and subcutaneous fat volume (B) during the CON period and after the hypercaloric high-fat diet (**P < 0.01 and ***P < 0.001 vs. control). VAT, visceral adipose tissue; SAT, subcutaneous adipose tissue.
Glucose tolerance, SI, and pancreatic β-cell function after fat feeding.
Intravenous glucose tolerance, as reflected in the Kg, was not changed by fat feeding (Table 1). This was due to reciprocal changes in SI, which declined by ∼30% (−29% by IVGTT and −27% by euglycemic clamp), and insulin response, which increased correspondingly. The decline in SI was accounted for by decreased peripheral sensitivity, with no measureable change in SI of the liver (Table 1). The peripheral insulin resistance was compensated exquisitely by an increase in insulin response, as measured by first-phase insulin IVGTT AIRg (+45%) and IVGTT C-peptide AUC (+58%), as well as hyperglycemic clamp (+23%), such that neither glucose tolerance (Kg) nor secretory function (DI) was reduced (Table 1). There were no changes in GLP-1 or glucagon with fat feeding and body fat accumulation (data not shown).
Table 1.
Parameters of glucose homeostasis after fat feeding and weight gain
| Control | After Weight Gain | |
|---|---|---|
| IVGTT | ||
| Kg/min−1 (× 10−2) | 3.3±0.3 | 3.7±0.4 |
| DI | 2,946±498 | 2,917±353 |
| SI, μU·ml−1·min−1 | 5.8±0.7 | 4.1±0.5* |
| AIRg, μU·ml−1·min | 497±50 | 719±47** |
| C-peptide0-10 min, pM·min | 4,306±390 | 6,837±554** |
| Euglycemic hyperinsulinemic clamp | ||
| SI, dl·kg−1·min−1·pM−1 (× 10−4) | 7.1±0.8 | 5.2±0.5† |
| SI EGP, dl·kg−1·min−1·pM−1 (× 10−4) | 1.0±0.2 | 0.7±0.1 |
| SI Rd, dl·kg−1·min−1·pM−1 (× 10−4) | 5.9±0.6 | 4.4±0.5† |
| FFA suppression, ΔmM | 0.53±0.06 | 0.48±0.07 |
| Hyperglycemic clamp | ||
| β-Cell function, pM·mg−1·dl−1 | 4.8±0.5 | 6.2±0.5* |
Values are means ± SE. IVGTT, intravenous glucose tolerance test; DI, disposition index; SI, insulin sensitivity; AIRg, acute insulin response to glucose; EGP, endogenous glucose production; Rd, glucose disappearance; FFA, free fatty acids.
P < 0.05,
P < 0.01, and
P = 0.05.
These data recapitulate the remarkable ability of the intact glucoregulating system in the dog to compensate appropriately with hyperinsulinemia for SI decrease. It also speaks to the normal adaptability of insulin kinetics in this animal model.
β-Cell Defect in Obese Insulin-Resistant Animals With STZ
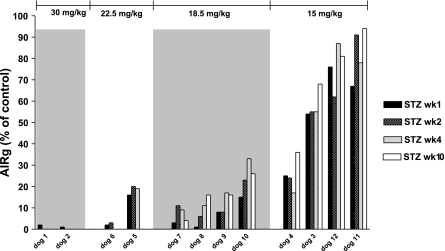
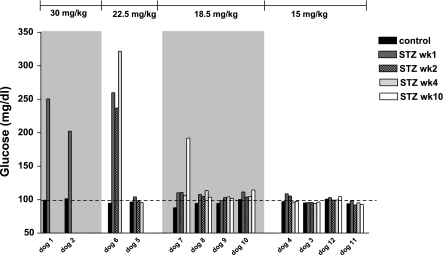
Fat-fed obese animals were subsequently administered a single dose of STZ ranging from 15 to 30 mg/kg. Figure 3 shows the dose dependency of AIRg reduction induced by STZ administration. Just two animals received 30 mg/kg; they showed a almost total reduction in pancreatic β-cell function (98 and 99%) 1 wk after STZ, with fasting hyperglycemia >200 mg/dl, requiring insulin therapy (Fig. 4). Two additional animals received a lower 22.5 mg/kg STZ dose. One likewise exhibited fasting hyperglycemia (259 mg/dl) and a 99% depletion of AIRg immediately after STZ (Figs. 3 and 4). The second animal that received the 22.5 mg/kg dose showed 84% reduction in first-phase insulin response without fasting hyperglycemia. Because we were interested in developing a model of mild diabetes, and based upon these pilot results, we turned to lower doses of STZ in the fat-fed obese models.
Fig. 3.
Dose-response relationship between STZ dose and IVGTT-acute insulin response to glucose (AIRg) at 1, 2, 4, and 10 wk after the STZ injection.
Fig. 4.
Dose-response relationship between STZ dose and IVGTT fasting plasma glucose during CON period and 1, 2, 4, and 10 wk after the STZ injection.
Doses of 15 and 18.5 mg/kg STZ produced variable reduction in AIRg, between 17 and 74% for the lowest dose and 76 and 93% for the 18.5 mg/kg dose (Fig. 3). Despite the latter reductions, fasting plasma glucose was within normal range after both doses (Fig. 4).
Thus, the two highest STZ doses (22.5–30 mg/kg) produced a dramatic reduction in pancreatic function in the four animals studied and fasting hyperglycemia in three of the four animals. The overweight animals that received the lower doses (15–18.5 mg/kg) had more modest decreases in pancreatic β-cell function. Because we were searching for a model of mild T2DM, we chose to phenotype in more detail animals on the lesser two doses. These animals were followed for a period of 12 wk and underwent full metabolic assessment as well as measurements of BW, food intake, and body fat.
Characteristics of 18.5 mg/kg STZ dose, the “obese mild T2DM model.”
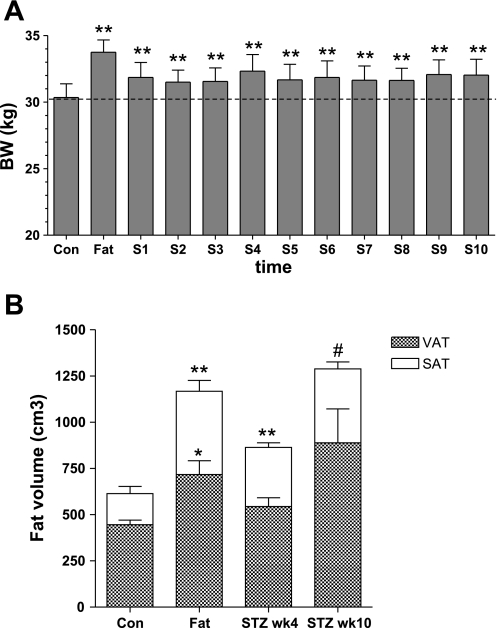
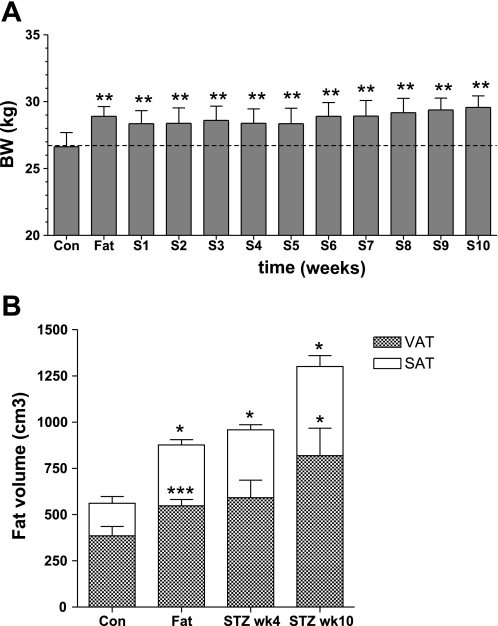
BW decreased immediately following STZ, in parallel with decreased post-STZ food intake (data not shown), but BW remained higher than in the control period (Fig. 5A). Despite the STZ injection, by week 4 post-STZ animals had on average recovered their preinjection BW and still showed increases in both visceral and subcutaneous fat over pre-STZ control (23 and 108%, respectively; Fig. 5B). Over the following week, as the animals continued to consume the high-fat diet, BW remained almost constant (32.3 ± 1.2 kg at week 4 and 32.0 ± 1.2 at week 10), masking large increases in body fat (103% increase in visceral fat and 187% increase in subcutaneous fat at 10 wk). Total body fat increased from 21% during control to 28% at 4 wk and 33% at 10 wk after STZ.
Fig. 5.
BW (A) and total, VAT, and SAT volume (B) during the CON period, after fat feeding, before STZ, and 4 and 10 wk after the STZ injection (dose 18.5 mg/kg). **P < 0.01, *P < 0.05, and #P = 0.05 vs. CON.
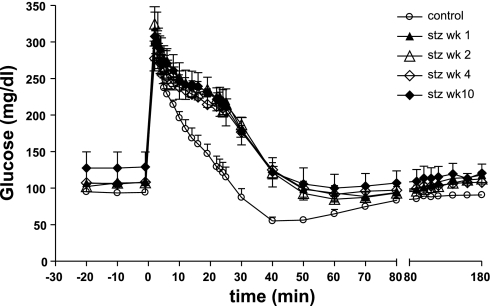
Figure 6 shows plasma glucose during IVGTT in the control period and at 1, 2, 4, and 10 wk after the 18.5 mg/kg STZ injection. Kg decreased 75% after STZ and remained virtually identical over the following weeks (Table 2).
Fig. 6.
Plasma glucose during IVGTT in the CON period and at 1, 2, 4, and 10 wk post-18.5 mg/kg STZ.
Table 2.
Parameters of glucose homeostasis for the 18.5 mg/kg STZ dose group
| STZ |
||||||
|---|---|---|---|---|---|---|
| Control | Fat | Week 1 | Week 2 | Week 4 | Week 10 | |
| IVGTT | ||||||
| Kg/min−1 (× 10−2) | 3.2±0.5 | 4.0±1.0 | 0.8±0.0* | 0.7±0.1** | 1.1±0.2* | 1.0±0.1* |
| DI | 2,504±449 | 2,783±798 | 69±28** | 127±36** | 203±51** | 234±52** |
| SI, μU·ml−1·min−1 | 5.5±0.5 | 3.7±1.0 | 2.7±0.4* | 2.5±0.3** | 2.9±0.3* | 3.8±0.3 |
| AIRg, μU·ml−1·min | 441±51 | 752±93** | 25±10** | 48±8** | 68±11** | 63±14** |
| C-peptide AUC0-10 min, pM·min | 5,224±1,011 | 7,574±184 | NA | NA | 1,005±149* | 889±425* |
| Euglycemic hyperinsulinemic clamp | ||||||
| SI, dl·kg−1·min−1·pM−1 (× 10−4) | 7.1±0.8 | 3.6±0.4 | NA | NA | 4.0±0.6 | 3.6±0.5 |
| SI EGP, dl·kg−1·min−1·pM−1 (× 10−4) | 0.8±0.1 | 0.7±0.2 | NA | NA | 0.5±0.2 | 0.8±0.1 |
| SI Rd, dl·kg−1·min−1·pM−1 (× 10−4) | 4.6±0.3 | 2.8±0.5 | NA | NA | 3.6±0.6 | 2.8±0.4 |
| FFA suppression, Δmmol/l | 0.56±0.08 | 0.46±0.05 | NA | NA | 0.63±0.13 | 0.51±0.07 |
| Hyperglycemic clamp | ||||||
| β-Cell function, pM·mg−1·dl−1 | 5.7±0.7 | 6.0±0.6 | NA | NA | 0.8±0.4** | 0.4±0.1 |
Values are means ± SE; n = 4. STZ, streptozotocin; AUC, area under the curve; NA, not available.
P < 0.05 and
P < 0.01 vs. control.
With this 18.5 mg/kg STZ dose, pancreatic β-cell function assessed by IVGTT was decreased 77–93%, as shown by the lower AIRg and C-peptide AUC (Table 2). At week 10, AIRg was the same as at week 4, indicating that the STZ-induced β-cell defect was not transient. The hyperglycemic step clamp likewise reflected the decrease in pancreatic β-cell function (Table 2).
SI post-STZ showed similar patterns by IVGTT or by euglycemic clamp (Table 2). SI IVGTT decreased 33% with fat feeding, from 5.5 ± 0.5 to 3.7 ± 1.0 μU·ml−1·min−1, for this group. Post-STZ SI further decreased and remained lower than control for the duration of the monitoring period such that at the end of 10 wk it was 40% lower than in the control period. EGC analysis revealed a similar trend, with the animals being 44 and 50% less sensitive at 4 and 10 wk, respectively, after STZ.
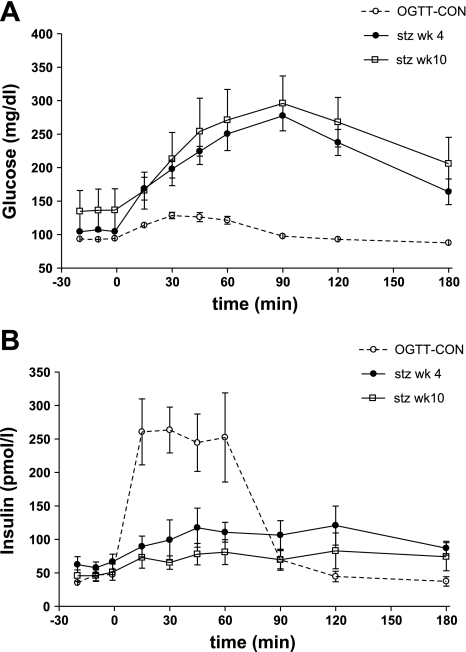
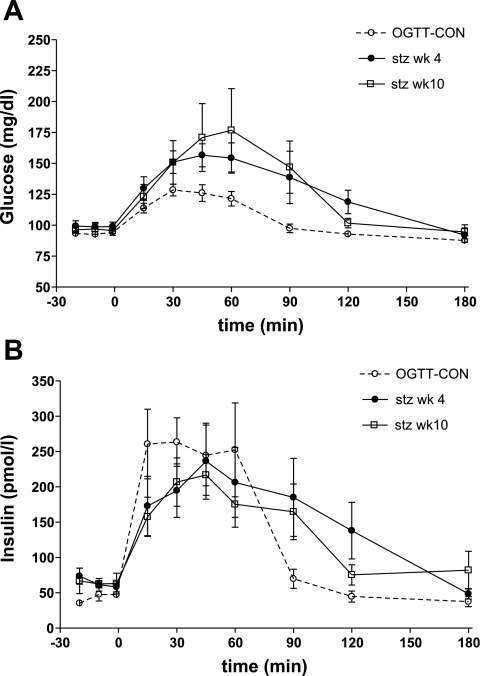
In all animals, oral glucose tolerance was measured at 4 and 10 wk after STZ. Although most animals had normal fasting plasma glucose (FPG) or slightly higher IFG, glucose and insulin patterns during an OGTT indicated that these animals could be classified as diabetic on the basis of their OGTT (Fig. 7A). Glucose AUC was significantly higher and insulin AUC significantly lower compared with a control group (OGTT-CON) at both 4 wk (glucose: 20,283 ± 1,944 mg·dl−1·min in STZ group vs. 2,029 ± 368 mg·dl−1·min in OGTT-CON, P < 0.01; insulin: 7,598 ± 2,267 pM·min in STZ group vs. 15,137 ± 2,271 pM·min in OGTT-CON, P < 0.05) and 10 wk (glucose: 19,277 ± 1,620 vs. 2,029 ± 368 mg·dl−1·min in OGTT-CON, P < 0.01; insulin: 4,934 ± 1,661 vs. 15,137 ± 2,271 pM·min in OGTT-CON, P < 0.01; Fig. 7B). Fasting glucagon levels tended to be higher after STZ, without reaching significance (53 ± 8 ng/l at 10 wk STZ vs. 43 ± 5 ng/l before STZ, P = 0.08). There were no significant changes in active GLP-1 levels during OGTT (data not shown).
Fig. 7.
Glucose (A) and insulin (B) during on OGTT at 4 and 10 wk after the STZ injection (dose 18.5 mg/kg) compared with a control group (OGTT-CON).
The animals that received the 18.5 mg/kg STZ dose did not have any signs of hepatic or renal damage, as assessed by measurements of AST, ALT, BUN, and creatinine; serum amylase and lipase values were also normal, indicating normal exocrine pancreas function (data not shown).
Thus, the animals that received the 18.5 mg/kg dose of STZ exhibited metabolic characteristics highly reminiscent of human obese insulin-resistant T2DM. At the 4-wk monitoring time point, these animals had 43% more body fat (with 108% increases in subcutaneous fat and 23% increases in visceral fat), their SI was 48% decreased compared with control, and they had on average 83% reduction in pancreatic β-cell function. Fasting plasma glucose varied between 102 and 114 mg/dl. During the OGTT, glycemia was significantly higher compared with a control group, and the 120-min glucose was >200 mg/dl. The model remained stable over the next 12 weeks, with the exception of one animal that became hyperglycemic 10 wk after STZ.
Characteristics of the “obese impaired glucose tolerance model” (15 mg/kg STZ dose).
In the lowest STZ dose group, BW did not decrease after STZ and continued to increase until the end of the study (Fig. 8A). We measured large increases in total body fat: 85% at 4 wk (135% increase in subcutaneous fat and 65% increase in visceral fat) and 144% at 10 wk (185% increase in subcutaneous fat and 130% increase in visceral fat) (Fig. 8B).
Fig. 8.
BW (A) and total, VAT, and SAT volume (B) during the CON period, after fat feeding, before STZ, and 4 and 10 wk after the STZ injection (dose 15 mg/kg). ***P < 0.01, ***P < 0.01, and *P < 0.05 vs. CON.
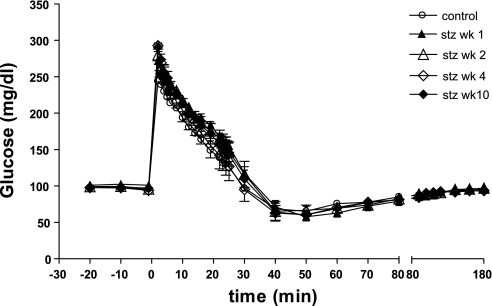
The 15 mg/kg dose of STZ produced a less dramatic reduction in intravenous glucose tolerance than all other STZ doses. Kg was reduced by 44% at week 1 after STZ (P < 0.05). Alhough it appeared to ameliorate over the following week (by week 4 it was similar to the control period), at 10 wk it was reduced again (Fig. 9 and Table 3).
Fig. 9.
Plasma glucose during IVGTT in the CON period and at 1, 2, 4, and 10 wk post-15 mg/kg STZ.
Table 3.
Parameters of glucose homeostasis for the 15 mg/kg STZ dose group
| STZ |
||||||
|---|---|---|---|---|---|---|
| Control | Fat | Week 1 | Week 2 | Week 4 | Week 10 | |
| IVGTT | ||||||
| Kg/min−1 (× 10−2) | 3.0±0.5 | 3.5±0.5 | 1.7±0.3* | 2.4±0.6 | 3.0±0.6 | 2.1±1.0 |
| DI | 2,619±1,055 | 2,493±591 | 1,504±255 | 1,597±297 | 1,517±208 | 1,928±474 |
| SI, μU·ml−1·min−1 | 4.1±1.2 | 3.2±0.4 | 5.2±1.1 | 5.7±1.6 | 5.9±1.8 | 5.6±2.0 |
| AIRg, μU·ml−1·min | 600±114 | 742±88 | 306±54* | 311±54* | 313±69* | 383±59 |
| C-peptide, pmol·l−1·min | 3,754±199 | 4,707±381 | NA | NA | 3,415±1,005 | 3,456±904 |
| Euglycemic hyperinsulinemic clamp | ||||||
| SI, dl·kg−1·min−1·pM−1 (× 10−4) | 6.5±1.8 | 6.0±0.5 | NA | NA | 5.5±1.4 | 4.3±1.1 |
| SI EGP, dl·kg−1·min−1·pM−1 (× 10−4) | 1.1±0.5 | 0.8±0.1 | NA | NA | 0.8±0.2 | 0.4±0.1 |
| SI Rd, dl·kg−1·min−1·pM−1 (× 10−4) | 5.6±1.6 | 5.1±0.4 | NA | NA | 4.7±1.4 | 3.9±1.1 |
| FFA suppression, Δmmol/l | 0.39±0.05 | 0.35±0.06 | NA | NA | 0.61±0.10 | 0.53±0.09 |
| Hyperglycemic clamp | ||||||
| β-Cell function, pM·mg−1·dl−1 | 4.0±0.9 | 5.1±1.0 | NA | NA | 2.9±1.0 | 3.1±0.9 |
Values are means ± SE.
AIRg was reduced on average by 50% at week 1 (range 24–75%) and remained remarkably stable over the followup period of 12 wk. Hyperglycemic clamp data also indicated a reduction in β-cell function, but of lower magnitude, of on average 25% (Table 3). Euglycemic clamp-measured SI was decreased by 15% at week 4 and 33% at week 10. In contrast, we measured a surprising, apparent increase in SI IVGTT (43 and 34% at 4 and 10 wk, respectively; Table 3).
Oral glucose tolerance was decreased compared with a control group at both 4 wk (glucose AUC: 5,245 ± 1,084 vs. 2,029 ± 368 mg·dl−1·min in OGTT-CON, P = 0.05) and 10 wk (glucose AUC: 5,873 ± 1,975 vs. 2,029 ± 368 mg·dl−1·min in OGTT-CON, P = 0.14). In contrast to the IVGTT results, during OGTT, plasma insulin concentration was not significantly lower compared with the control group (insulin AUC: 15,792 ± 5,318 pM·min at 4 wk and 12,420 ± 2,267 pM·min at 10 wk vs. 15,137 ± 2,271 pM·min in OGTT-CON; Fig. 10).
Fig. 10.
Glucose (A) and insulin (B) during an OGTT at 4 and 10 wk after the STZ injection (dose 15 mg/kg) compared with OGTT-CON.
All animals that received 15 mg/kg STZ had AST, ALT, BUN, creatinine, serum amylase, and lipase within the normal range (data not shown).
In brief, the animals that received our lowest STZ dose (15 mg/kg) showed increased body fat (by 85% at 4 wk and by 144% at 10 wk), were mildly insulin resistant (as indicated by the EGC clamp, but not by IVGTT), and had a stable reduction in β-cell function of variable range (between 24 and 75%). Oral glucose tolerance remained reduced compared with normal controls.
Pancreas histology.
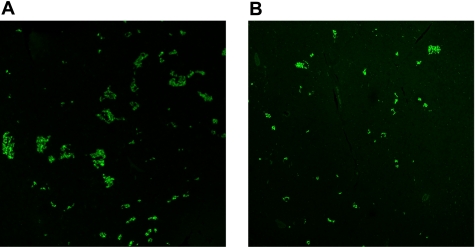
Immunohistochemical staining for insulin performed at euthanization (12 wk post-STZ) showed decreased insulin fluorescence compared with pancreatic tissue from lean, non-STZ-treated animals (n = 4) (Fig. 11); %FITC stain was 0.630 ± 0.174 for control, 0.115 ± 0.029 for 15 mg/kg STZ (P < 0.05 vs. control), and 0.144 ± 0.069 for 18.5 mg/kg STZ (P < 0.05 vs. control).
Fig. 11.
Immunohistochemical staining for pancreatic insulin (FITC) in CON dogs (A) and animals that received STZ (B). Magnification ×10.
DISCUSSION
A variety of animal models are used in the study of T2DM, ranging from rodents to feline, pig, dog, and primates and from genetic to chemically induced (26). However, few of these models mirror the pathophysiology and natural history of T2DM, especially obesity-related T2DM.
In our study, we report the development of a canine model that resembles the metabolic defects in human T2DM and a model similar to defects of impaired glucose tolerance associated with obesity and insulin resistance. Animals were first made obese by feeding them a highly palatable, elevated-fat/high-carbohydrate diet. After 6–8 wk, animals had gained a modest amount of weight (8%) that was due to dramatic increases in body fat (130% subcutaneous and 52% visceral) and was associated with reduction in SI (reduced 31%). With fat deposition alone, the insulin resistance was offset by a compensatory increase in insulin secretion such that glucose tolerance was in the normal range. This time course of hyperinsulinemic compensation in the face of insulin resistance in the dog model was described by Mittelman et al. (30) in a moderate fat-induced model of insulin resistance in dog. Insulin resistance appeared in the first week of fat feeding and remained present for the duration of the study (12 wk). Insulin resistance was compensated initially by increased insulin secretion and subsequently by decreased hepatic insulin clearance. The fat-fed dog model thus confirms the hyperbolic relationship between SI and insulin secretion observed in humans (4, 21) and elegantly exemplifies the coordinated intervention of several organs (pancreas, liver, adipose tissue) to maintain euglycemia.
The second step in the development of our diabetes-like model was administration of a single intravenous injection of STZ in low doses ranging from 15 to 30 mg/kg. STZ has been used to induce diabetes in various species, including mouse, rat, guinea pig, hamster, dog, pig, and nonhuman primates (32, 38). There is large variability in the diabetogenic dose among species. In large mammals, doses ranging from 20 (29) to 300 mg/kg (31) have been used. In the dog, the median lethal dose is 1,500 mg/m2 (50 mg/kg), very close to the diabetogenic dose (2, 32), such that repeated administration of low STZ doses (37), a combination of STZ and alloxan (8), or STZ and pancreatectomy (18) have been used to induce diabetes. In other species, nicotinamide has been administered to protect the pancreas, liver, and kidney from STZ-induced damage (25). Due to the marked destruction of pancreatic β-cells, most canine and pig models of diabetes using STZ resemble not T2DM but T1DM. For example, in pilot studies our highest STZ dose of 30 mg/kg left virtually no residual pancreatic function and was overtly diabetogenic. The animals' glucose homeostasis deteriorated rapidly, and even with insulin therapy glycemic control was difficult to obtain. Of the two animals in the second-highest group (22.5 mg/kg), one had frank diabetes immediately postinjection that required insulin therapy, whereas the other had normal fasting glycemia that was maintained until the end of the followup period (4 wk). None of the animals showed any signs of hepatic or renal damage. The insulin secretion was reduced 80–99%, and insulin sensitivity was reduced 53%. Thus, this high-intermediate dose of STZ (22.5 mg/kg) results in a model that has a dramatic reduction in insulin secretion and low insulin sensitivity, possibly overt diabetes, and is suitable for studying the long-term complications of T2DM. It has the advantage over established models of T2DM that the STZ dose used to produce a β-cell defect is low enough that it is very unlikely to have a negative effect on other organs. An interesting aspect of our study is that, with the relatively low doses of STZ of 22.5 or 30 mg/kg, we obtain a phenotype that has overt diabetes. It has been shown previously that higher doses are required to induce diabetes in the canine species (32). It is very possible that our result of a lower diabetogenic dose is due to the fact that, at the time of STZ administration, animals are obese and insulin resistant. In rats, an intraperitoneal dose of 35 mg/kg STZ resulted in hyperglycemia in obese fat-fed rats but not in their lean counterparts. Only a higher dose of 45 mg/kg STZ produced hyperglycemia in both groups (34).
In our obese, insulin-resistant canine model, a carefully selected dose of 18.5 mg/kg STZ produced a variable 76–93% decrease in insulin secretory function. By week 4 post-STZ, all animals had IFG and FPG ranging from 104 to 114 mg/dl. Additionally, the 2-h OGTT plasma glucose >200 mg/dl fulfills the human criteria for diagnosis of diabetes mellitus in humans (1). In fact, there are few guidelines for diagnosing diabetes in the dog. Canine diabetes diagnosis is usually made in the presence of any casual glucose >200 mg/dl and symptoms of diabetes (35), much in line with human criteria. The upper limit of the normal glucose interval is reported as 100 mg/dl, so we can infer that the range of FPG obtained in our study with the 18.5 mg/kg dose is in the IFG category (20). This IFG was a distinguishing feature of the 18.5 mg/kg STZ dose group; the animals receiving the lowest STZ dose (15 mg/kg) did not routinely show FPG >100 mg/dl, and 2-h OGTT glycemia was <200 mg/dl.
SI of the animals receiving 18.5 mg/kg STZ was decreased 30% after fat feeding pre-STZ and further to 50% at 4 wk after STZ, as indicated both by IVGTT and the euglycemic hyperinsulinemic clamp. The decremental reduction in insulin sensitivity after STZ could be due to the continuation of fat feeding per se or to the acute effect of STZ. It has been reported that administration of STZ alone induces insulin resistance (7, 23), although other studies have not confirmed this finding (37). In our study, due to temporarily decreased food intake, animals lost weight and body fat immediately post-STZ, which would favor the explanation of STZ-induced insulin resistance.
STZ-induced weight loss was only temporary. Animals recovered their preinjection food intake within 1 wk. At 4 wk post-STZ, they exhibited more body weight and body fat (both visceral and subcutaneous) than in the control period. For dogs, unlike for diabetes or IFG/IGT, there are well-defined obesity criteria. Widely used is the Body Condition Score (BCS) (either 5-point or 9-point) that classifies dogs as ideal, overweight, or obese (24). Although the ability of the score to predict body fat has been shown in one study (27), this BCS assessment is subjective and relies on the personal experience and training of the person making the assessment. Obesity in dogs has been defined as body weight 15 (12) or 20% (27) over the ideal, but in mixed-breed dogs, ideal body weight is hard to establish. No specific criteria for definition of obesity based on percent body fat or size of specific fat depots exist; however, in our sample of dogs, body fat increased from 21% during the control period to 28 and 33% at 4 and 10 wk after STZ, respectively, which would qualify the animals as overweight or obese.
The animals that received the lowest STZ dose (15 mg/kg) presented an interesting pattern of metabolic changes. STZ reduced β-cell function as assessed by both IVGTT (50%) and by hyperglycemic clamp (25%). Intravenous glucose tolerance decreased 50% in the first week after STZ, and it appeared to slowly recover, but by 10 wk it was reduced again by 40%. The increased glucose tolerance was not due to increased insulin secretion, since AIRg and C-peptide AUC remained remarkably stable. Spontaneous recovery of pancreatic function post-STZ has been described previously, but only in very young animals (36). SI IVGTT increased post-STZ, and the DI improved as well. In contrast, the euglycemic clamp data showed a decrease in SI clamp post-STZ. We believe that the apparent increase in SI IVGTT is an artifact due to the small group size. The increase in SI IVGTT is driven mostly by a large SI increase in one of the four animals. In contrast, the clamp SI decreased in all animals. Moreover, in the animal in which SI IVGTT shows an apparent increase, the finding is not supported by euglycemic clamp data, which shows a decrease in SI. Last, a decrease (but not increase) in SI would correlate with the continuation of fat feeding and with STZ administration, both of which are known to induce insulin resistance. Although phenotypying the 15 mg/kg dose would be of interest, the purpose of the current study was to choose the appropriate STZ dose for a mild type 2 diabetic animal model; the 15 mg/kg STZ dose was a stepping stone in this process, but we believe it is not necessary for our current goal to completely phenotype the animals (an additional 14 are animals needed based on conservative power calculation), since the change in β-cell function is the primary outcome of the STZ treatment.
In summary, we present in the current study the development of a new large animal model of obesity, insulin resistance, and β-cell deficiency. Although none of the animal models of T2DM can reproduce the human disease in its complexity, our model has many features resembling human T2DM: adult onset, association with obesity and insulin resistance, residual insulin secretion with disappearance of phase 1, and natural history in which insulin resistance and compensatory hyperinsulinemia occur first, followed by a decline in pancreatic function. Our canine model offers the advantage of an easy induction; a period of fat feeding is followed by one injection of STZ at a low dose that is well tolerated and has no effects on the exocrine pancreas, liver, or kidney. Animal welfare is a critical consideration in developing large animal models of diseases, and in our case, because of the mild form of diabetes, animals do not require insulin therapy, the recovery after injection is fast, and food intake and body weight are maintained and even increased. Our model is thus suitable for longitudinal studies with multiple assessments and testing for pharmacological intervention as well as mechanistic insights in the pathophysiology of T2DM.
GRANTS
This work was supported by a research grant from Amylin Pharmaceuticals. R. N. Bergman is supported by the National Institute of Diabetes and Digestive and Kidney Diseases (DK-27619 and DK-29867). The USC Multiphoton Imaging Core was supported by the shared instrument grant 1S10-RR-024754-01 from the National Center for Research Resources.
DISCLOSURES
No conflicts of interest are declared by the author(s).
ACKNOWLEDGMENTS
We are especially grateful to Dr. Joyce Richey and Dr. Marilyn Ader for insightful comments. We thank Rita Thomas for technical assistance, Edward Zuniga and Edgardo Paredes for animal care and experiment assistance, Dr. Clara Magyar and Dr. Janos Peti-Peterdi for assistance with pancreas imaging, and Dr. Vincent Poitout for the immunohistochemistry protocol.
REFERENCES
- 1.American Diabetes Association Diagnosis and classification of diabetes mellitus. Diabetes Care 32: S62–S67, 2009 [DOI] [PMC free article] [PubMed] [Google Scholar]
- 2.Bell TD, DiBona GF, Wang Y, Brands MW. Mechanisms for renal blood flow control early in diabetes as revealed by chronic flow measurement and transfer function analysis. J Am Soc Nephrol 17: 2184–2192, 2006 [DOI] [PubMed] [Google Scholar]
- 3.Bellinger DA, Merricks EP, Nichols TC. Swine models of type 2 diabetes mellitus: insulin resistance, glucose tolerance, and cardiovascular complications. ILAR J 47: 243–258, 2006 [DOI] [PubMed] [Google Scholar]
- 4.Bergman RN, Phillips LS, Cobelli C. Physiologic evaluation of factors controlling glucose tolerance in man: measurement of insulin sensitivity and beta-cell glucose sensitivity from the response to intravenous glucose. J Clin Invest 68: 1456–1467, 1981 [DOI] [PMC free article] [PubMed] [Google Scholar]
- 5.Bergman RN, Prager R, Volund A, Olefsky JM. Equivalence of the insulin sensitivity index in man derived by the minimal model method and the euglycemic glucose clamp. J Clin Invest 79: 790–800, 1987 [DOI] [PMC free article] [PubMed] [Google Scholar]
- 6.Bergman RN, Watanabe R, Rebrin K, Ader M, Steil G. Toward an integrated phenotype in pre-NIDDM. Diabet Med 13: S67–S77, 1996 [PubMed] [Google Scholar]
- 7.Bevilacqua S, Barrett EJ, Smith D, Simonson DC, Olsson M, Bratusch-Marrain P, Ferrannini E, DeFronzo RA. Hepatic and peripheral insulin resistance following streptozotocin-induced insulin deficiency in the dog. Metabolism 34: 817–825, 1985 [DOI] [PubMed] [Google Scholar]
- 8.Black HE, Rosenblum IY, Capen CC. Chemically induced (streptozotocin-alloxan) diabetes mellitus in the dog. Biochemical and ultrastructural studies. Am J Pathol 98: 295–310, 1980 [PMC free article] [PubMed] [Google Scholar]
- 9.Bradley DC, Steil GM, Bergman RN. OOPSEG: a data smoothing program for quantitation and isolation of random measurement error. Comput Methods Programs Biomed 46: 67–77, 1995 [DOI] [PubMed] [Google Scholar]
- 10.Centers for Disease Control and Prevention National Diabetes Fact Sheet: General Information and National Estimates on Diabetes in the United States, 2007 (Abstract) Atlanta, GA: US Department of Health and Human Services, Centers for Disease Control and Prevention, 2009 [Google Scholar]
- 11.Centers for Disease Control and Prevention 2009 National Diabetes Surveillance System (Online) http://www.cdc.gov/diabetes/statistics/prev/national/figpersons.htm [2009].
- 12.Colliard L, Ancel J, Benet JJ, Paragon BM, Blanchard G. Risk factors for obesity in dogs in France. J Nutr 136: 1951S–1954S, 2006 [DOI] [PubMed] [Google Scholar]
- 13.Davis SN, Piatti PM, Monti L, Möller N, Ng LL, Coppack S, Antsiferov M, Brown MD, Alberti KG. A comparison of four methods for assessing in vivo beta-cell function in normal, obese and non-insulin-dependent diabetic man. Diabetes Res 19: 107–117, 1992 [PubMed] [Google Scholar]
- 14.Despres JP, Lemieux I. Abdominal obesity and metabolic syndrome. Nature 444: 881–887, 2006 [DOI] [PubMed] [Google Scholar]
- 15.Expert Committee on the Diagnosis and Classification of Diabetes Mellitus Report of the expert committee on the diagnosis and classification of diabetes mellitus. Diabetes Care 26, Suppl 1: S5–S20, 2003 [DOI] [PubMed] [Google Scholar]
- 16.Finegood DT, Bergman RN, Vranic M. Estimation of endogenous glucose production during hyperinsulinemic-euglycemic glucose clamps. Comparison of unlabeled and labeled exogenous glucose infusates. Diabetes 36: 914–924, 1987 [DOI] [PubMed] [Google Scholar]
- 17.Finegood DT, Pacini G, Bergman RN. The insulin sensitivity index. Correlation in dogs between values determined from the intravenous glucose tolerance test and the euglycemic glucose clamp. Diabetes 33: 362–368, 1984 [DOI] [PubMed] [Google Scholar]
- 18.Freyse EJ, Hahn von Dorsche H, Fischer U. Low dose streptozotocin diabetes after partial pancreatectomy in dogs. Histological findings in a new type of experimental diabetes. Acta Biol Med Ger 41: 1203–1210, 1982 [PubMed] [Google Scholar]
- 19.Hagman DK, Latour MG, Chakrabarti SK, Fontes G, Amyot J, Tremblay C, Semache M, Lausier JA, Roskens V, Mirmira RG, Jetton TL, Poitout V. Cyclical and alternating infusions of glucose and intralipid in rats inhibit insulin gene expression and Pdx-1 binding in islets. Diabetes 57: 424–431, 2008 [DOI] [PMC free article] [PubMed] [Google Scholar]
- 20.Hoenig M. Comparative aspects of diabetes mellitus in dogs and cats. Mol Cell Endocrinol 197: 221–229, 2002 [DOI] [PubMed] [Google Scholar]
- 21.Kahn SE, Prigeon RL, McCulloch DK, Boyko EJ, Bergman RN, Schwartz MW, Neifing JL, Ward WK, Beard JC, Palmer JP. Quantification of the relationship between insulin sensitivity and beta-cell function in human subjects. Evidence for a hyperbolic function. Diabetes 42: 1663–1672, 1993 [DOI] [PubMed] [Google Scholar]
- 22.Kim SP, Catalano KJ, Hsu IR, Chiu JD, Richey JM, Bergman RN. Nocturnal free fatty acids are uniquely elevated in the longitudinal development of diet-induced insulin resistance and hyperinsulinemia. Am J Physiol Endocrinol Metab 292: E1590–E1598, 2007 [DOI] [PubMed] [Google Scholar]
- 23.Koopmans SJ, Mroz Z, Dekker R, Corbijn H, Ackermans M, Sauerwein H. Association of insulin resistance with hyperglycemia in streptozotocin-diabetic pigs: effects of metformin at isoenergetic feeding in a type 2-like diabetic pig model. Metabolism 55: 960–971, 2006 [DOI] [PubMed] [Google Scholar]
- 24.Laflamme DP, Kealy RD, Schmidt DA. Estimation of body fat by body condition score (Abstract). J Vet Intern Med 8: 154, 1994 [Google Scholar]
- 25.Larsen MO, Wilken M, Gotfredsen CF, Carr RD, Svendsen O, Rolin B. Mild streptozotocin diabetes in the Göttingen minipig. A novel model of moderate insulin deficiency and diabetes. Am J Physiol Endocrinol Metab 282: E1342–E1351, 2002 [DOI] [PubMed] [Google Scholar]
- 26.Masiello P. Animal models of type 2 diabetes with reduced pancreatic beta-cell mass. Int J Biochem Cell Biol 38: 873–893, 2006 [DOI] [PubMed] [Google Scholar]
- 27.Mawby DI, Bartges JW, d'Avignon A, Laflamme DP, Moyers TD, Cottrell T. Comparison of various methods for estimating body fat in dogs. J Am Anim Hosp Assoc 40: 109–114, 2004 [DOI] [PubMed] [Google Scholar]
- 28.McClain DA, Abraham D, Rogers J, Brady R, Gault P, Ajioka R, Kushner JP. High prevalence of abnormal glucose homeostasis secondary to decreased insulin secretion in individuals with hereditary haemochromatosis. Diabetologia 49: 1661–1669, 2006 [DOI] [PubMed] [Google Scholar]
- 29.Misawa K, Ichikawa K, Ojima K, Hamano S, Kitamura T, Komatsu H. Effect of KAD-1229, a nonsulfonylurea hypoglycemic agent, on plasma glucose and insulin in streptozotocin-induced diabetic dogs. Pharmacology 62: 65–72, 2001 [DOI] [PubMed] [Google Scholar]
- 30.Mittelman SD, van Citters GW, Kim SP, Davis DA, Dea MK, Hamilton-Wessler M, Bergman RN. Longitudinal compensation for fat-induced insulin resistance includes reduced insulin clearance and enhanced beta-cell response. Diabetes 49: 2116–2125, 2000 [DOI] [PubMed] [Google Scholar]
- 31.Ozaki K, Monnai M, Onoma M, Muramatsu H, Yogo K, Watanabe T, Oda Y, Katagiri K, Arakawa H, Itoh Z, Omura S, Takanashi H. Effects of mitemcinal (GM-611), an orally active erythromycin-derived prokinetic agent, on delayed gastric emptying and postprandial glucose in a new minipig model of diabetes. J Diabetes Complications 22: 339–347, 2008 [DOI] [PubMed] [Google Scholar]
- 32.Rerup CC. Drugs producing diabetes through damage of the insulin secreting cells. Pharmacol Rev 22: 485–518, 1970 [PubMed] [Google Scholar]
- 33.Srinivasan K, Ramarao P. Animal models in type 2 diabetes research: an overview. Indian J Med Res 125: 451–472, 2007 [PubMed] [Google Scholar]
- 34.Srinivasan K, Viswanad B, Asrat L, Kaul CL, Ramarao P. Combination of high-fat diet-fed and low-dose streptozotocin-treated rat: a model for type 2 diabetes and pharmacological screening. Pharmacol Res 52: 313–320, 2005 [DOI] [PubMed] [Google Scholar]
- 35.Stockham SL, Scott MA. Fundamentals of Veterinary Clinical Pathology Ames, IA: Iowa State Press, A Blackwell Publishing Company, 2002 [Google Scholar]
- 36.Thyssen S, Arany E, Hill DJ. Ontogeny of regeneration of beta-cells in the neonatal rat after treatment with streptozotocin. Endocrinology 147: 2346–2356, 2006 [DOI] [PubMed] [Google Scholar]
- 37.Tobin BL, Finegood DT. Reduced insulin secretion by repeated low doses of STZ impairs glucose effectiveness but does not induce insulin resistance in dogs. Diabetes 42: 474–483, 1993 [DOI] [PubMed] [Google Scholar]
- 38.Wagner JE, Kavanagh K, Ward GM, Auerbach BJ, Harwood HJ, Jr, Kaplan JR. Old world nonhuman primate models of type 2 diabetes mellitus. ILAR J 47: 259–271, 2006 [DOI] [PubMed] [Google Scholar]


