Abstract
Claudin-7, a member of the claudin family, is highly expressed in distal nephrons of kidneys and has been reported to be involved in the regulation of paracellular Cl− permeability in cell cultures. To investigate the role of claudin-7 in vivo, we generated claudin-7 knockout mice (Cln7−/−) by the gene-targeting deletion method. Here we report that Cln7−/− mice were born viable, but died within 12 days after birth. Cln7−/− mice showed severe salt wasting, chronic dehydration, and growth retardation. We found that urine Na+, Cl−, and K+ were significantly increased in Cln7−/− mice compared with that of Cln7+/+ mice. Blood urea nitrogen and hematocrit were also significantly higher in Cln7−/− mice. The wrinkled skin was evident when Cln7−/− mice were ∼1 wk old, indicating that they suffered from chronic fluid loss. Transepidermal water loss measurements showed no difference between Cln7+/+ and Cln7−/− skin, suggesting that there was no transepidermal water barrier defect in Cln7−/− mice. Claudin-7 deletion resulted in the dramatic increase of aldosterone synthase mRNA level as early as 2 days after birth. The significant increases of epithelial Na+ channel α, Na+-Cl− cotransporter, and aquaporin 2 mRNA levels revealed a compensatory response to the loss of electrolytes and fluid in Cln7−/− mice. Na+-K+-ATPase α1 expression level was also greatly increased in distal convoluted tubules and collecting ducts where claudin-7 is normally expressed. Our study demonstrates that claudin-7 is essential for NaCl homeostasis in distal nephrons, and the paracellular ion transport pathway plays indispensable roles in keeping ionic balance in kidneys.
Keywords: claudin-7, tight junction, kidney, knockout mice, salt wasting
claudins are a family of ∼24 proteins with molecular masses of 20–27 kDa and containing four transmembrane domains (28). They are the major structural and functional components of tight junctions (TJs) (4, 11, 32, 37, 39). Claudins are widely expressed in almost all epithelial cells and show tissue-specific distribution patterns (13). It has been reported that claudins can either form paracellular size- and charge-selective pores or paracellular ion barriers (1–3, 6, 14, 41).
Mutations in claudins have been linked to human diseases. The first direct evidence that claudins are responsible for paracellular ion transport comes from the genetic linkage study showing that mutations in claudin-16 (Paracellin-1) cause renal magnesium (Mg2+) wasting with hypomagnesemia and hypercalciuria in humans (34). Claudin-16 is localized at TJs of the thick ascending limb of Henle in kidneys and is essential for Mg2+ reabsorption through the paracellular pathway. More recently, mutations in claudin-19 were also found to be associated with hypomagnesemia, renal failure, as well as severe ocular abnormalities in humans (23). Studies from Hou et al. (15, 16) suggest that claudin-16 interacts with claudin-19 to form a cation-selective TJ complex. Other studies from Wilcox et al. (40) demonstrated that mutations in the gene encoding claudin-14 were linked to autosomal recessive deafness in humans. It was proposed that claudin-14 is essential for maintaining the electrochemical gradient between the endolymph and its surrounding tissues.
Studies from targeted deletion or disruption of claudin genes have also provided us with crucial information regarding the function of claudins in vivo. For example, claudin-11 null mice show the sterility of male mice and defect of nerve conduction velocity in the central nervous system (12). Disruption of the blood-testis barrier could interrupt the differentiation of early spermatocytes and lead to cell sloughing and death. Mice lacking claudin-1 had wrinkled skin and died within 1 day of birth (9). Dehydration assay and transepidermal water loss (TEWL) measurements revealed the severe defect of the epidermal barrier. Transgenic mice overexpressing claudin-6 also displayed the dysfunction of epidermal permeability barrier and died shortly after birth (38). Nitta et al. (29) reported that claudin-5-deficient mice showed the size-selective loosening of the blood-brain barrier (BBB). Their studies revealed that the BBB in these mice was severely affected against small molecules (<800 Da) but not larger molecules. Claudin-19-deficient mice exhibited behavioral abnormalities that could be attributed to the defects in the electrical sealing by TJs in Schwann cells (27). On the other hand, while claudin-11, -14, and -19 are all expressed in renal epithelial cells, no renal abnormalities have been observed in their respective claudin knockout mice, suggesting that either there is some compensation among claudins or their roles in kidneys are not essential.
There are at least 12 claudins that are expressed in kidneys (21). Among them, claudin-7 is highly expressed in the distal convoluted tubules (DCT) and collecting ducts (CD) (2, 24). Our recent studies showed that claudin-7 is a potential WNK4 substrate, and the serine residue at position 206 in the COOH-terminus of claudin-7 is a putative phosphorylation site for WNK4. Moreover, the mutations of WNK4, which cause hypertension and hyperkalemia in humans (pseudohypoaldosteronism type II) by altering renal NaCl and K+ handling (19), hyperphosphorylated claudin-7 and significantly increased paracellular permeability to Cl− (36). These observations indicate that an altered paracellular ion transport can potentially disrupt ionic homeostasis in vivo and contribute to the development of hypertension in humans.
To investigate the claudin-7 function in vivo, we generated a claudin-7 knockout mouse model by gene targeting through homologous recombination. In this study, we report that Cln7−/− pups show Na+, Cl−, and K+ wasting and chronic dehydration phenotypes. The dramatic increase of aldosterone synthase mRNA level suggests that these mice suffer from mishandling of NaCl and fluid in the distal nephrons. Deletion of claudin-7 invokes several compensatory changes, such as increased renin, serum-glucocorticoid-induced kinase 1 (SGK1), epithelial Na+ channel (ENaCα), Na+-Cl− cotransporter (NCC), as well as aquaporin (AQP) 2 mRNA levels, demonstrating the cross talks between paracellular and transcellular ion transport pathways.
MATERIALS AND METHODS
Generation of Cln7−/− mice by gene targeting.
Mouse claudin-7 gene is located on chromosome 11 and contains four exons. A pDTA targeting vector (kindly provided by David Paul from Harvard Medical School) containing a PGK-neo cassette was designed to delete exon 1, intron 1, and exon 2 of the claudin-7 gene. This replacement targeting vector contained a 5′ and 3′ homology region of 1.5 and 4.1 kb, respectively. The 1.5-kb 5′ sequence (upstream of claudin-7 exon 1) and 4.1-kb 3′ sequence (starting from the second intron of claudin-7 gene) were obtained by PCR using 129sv genomic DNA as a template. Both 5′ and 3′ sequences were verified by DNA sequencing. The 1.5- and 4.1-kb fragments were subcloned into Hind III and Sac II sites of PGK-neo cassette in pDTA targeting vector, respectively. After the targeting vector was constructed, it was electroporated into mouse ES cells by the Animal Models Core Facility at the University of North Carolina, Chapel Hill (UNC-AMC). ES cell clones that survived with both positive and negative selections were screened to identify the correct recombination by PCR. The selected clone was microinjected in the pronuclei of C57BL/6 mouse blastocysts (UNC-AMC). The resulting male chimeras were mated with C57BL/6 females to produce the F1 generation. The F1 male and female heterozygotes were bred to produce all three genotypes, Cln7+/+, Cln7+/−, and Cln7−/−. These studies were reviewed and approved by the Animal Care and Use Committee at East Carolina University.
Antibodies and reagents.
Rabbit anti-claudin-2, -3, and -4 antibodies were purchased from Zymed (Invitrogen, Carlsbad, CA). Rabbit anti-claudin-8 antibody was described previously (18). Rabbit anti-claudin-7 antibody was obtained from IBL (Immuno-Biological Laboratories). Mouse monoclonal and rabbit polyclonal antibodies against Na+-K+-ATPase α1 were from Santa Cruz. Anti-TSC (NCC) antibody was a generous gift from Mark Knepper (National Institutes of Health). AQP2 polyclonal antibody was purchased from Calbiochem. All other chemicals were from Sigma, unless indicated otherwise.
Genotyping.
To determine mouse genotypes, tail snips were obtained 1 day after birth while newborn pups were tattooed. Mouse tails were digested in a buffer containing 0.5% SDS and proteinase K and incubated at 55°C for at least 3 h before processing to purify the genomic DNA. The primer sets for PCR reactions were as follows: 5′ homologue region, 5′-CTGCAGAGTGAGATCCTGTCTCAAAAGTAC-3′ (forward primer), 5′-CGCATCGCCTTCTATCGCCTTCTTGACGAG-3′ (reverse primer) (primer set 1 and 2 in Fig. 1A) ; 3′ homologue region, 5′-TCCTGACTAGGGGAGGAGTAGAAGGTGGCG-3′ (forward primer), 5′-GCAAGCCATAGCACACGCACACCATGGGAC-3′ (reverse primer) (primer set 3 and 4 in Fig. 1A); claudin-7 gene, 5′-CAACTCGGGCCTGCAACTGCTG-3′ (forward primer, located before exon 1), 5′-GCAAGCCATAGCACACGCACACCATGGGAC-3′ (reverse primer, the same as primer 4).
Fig. 1.
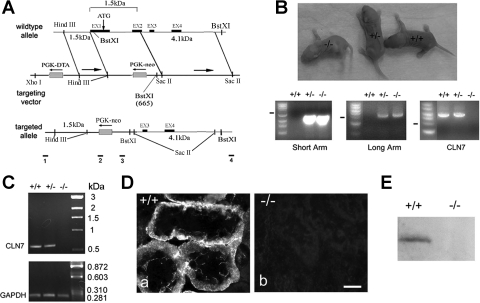
Generation of claudin-7 knockout mice. A: targeted-gene deletion strategy. Claudin-7 gene contains four exons as shown in wild-type allele. A replacement targeting vector containing a PGK-neo cassette was designed to delete exon 1, intron 1, and exon 2 of claudin-7 gene. Bars 1 and 2 underneath the targeted allele indicate the position of PCR primers for 5′ sequence (2.5 kb). Bars 3 and 4 indicate the position of PCR primers for the 3′ sequence (4.2 kb). B: production of claudin-7 knockout mice and their genotyping by PCR. Top: Cln7−/−, Cln7+/−, and Cln7+/+ mice at 3 days old. Bottom: genomic DNA was isolated from newborn mouse tail for genotyping analysis. The PCR products from both heterozygous (+/−) and homozygous (−/−) mice yielded a 2.5-kb band (short arm) and a 4.2-kb band (long arm) respectively, whereas the wild type (+/+) did not have these two bands. Wild-type and heterozygous mice produced a 5.7-kb band indicating the presence of claudin-7 gene (CLN7). This 5.7-kb band was absent in the homozygous mouse. C: verification of claudin-7 gene deletion in Cln7−/− mice by RT-PCR. The PCR products were expected as 634 bp for claudin-7 and 284 bp for glyceraldehyde-3-phosphate dehydrogenase (GAPDH) (serve as a PCR positive control). Claudin-7 mRNA was present in wild-type and heterozygous mice, but was absent in knockout mouse. D: loss of claudin-7 immunoreactivity in Cln7−/− mice. Kidneys from 1-wk-old Cln7+/+ (a) and Cln7−/− (b) mice were dissected and frozen in liquid nitrogen. Frozen sections (5 μm) of kidneys were immunostained with anti-claudin-7 antibody and detected by Cy3-conjugated anti-rabbit secondary antibody. The images were taken at the kidney cortex region. Scale bar: 15 μm. E: Western blot analysis showed the presence of claudin-7 protein expression in Cln7+/+ but not in Cln7−/− mice. The membrane was probed with anti-claudin-7 antibody.
RNA isolation and real-time RT-PCR.
Total RNA was isolated from Cln7+/+, Cln7+/−, and Cln7−/− mouse kidneys using Trizol reagent (Invitrogen) following the manufacturer's instructions. RT-PCR was performed using the ProtoScript kit (New England Biolabs). The specific PCR primers used for claudin-7 were as follows: forward primer, 5′-ATGGCCAACTCGGGCCTGCAACTG-3′; reverse primer, 5′-TCACACGTATTCCTTGGAGGAATT-3′, which generated an expected 634-bp PCR product. As a control, the glyceraldehyde 3-phosphate dehydrogenase (GAPDH) gene was also amplified to produce a 284-bp PCR fragment. The PCR primers used for GAPDH were: 5′-GTGGATATTGTTGCCATCAATGACC-3′ (forward) and 5′-GCCCCAGCCTTCATGGTGGT-3′ (reverse).
For real-time RT-PCR experiments, adrenal glands and kidneys from 2- to 8-day-old Cln7+/+ and Cln7−/− pups were stored in 5× (vol/wt) volumes of RNAlater solution. Total RNA isolation and real-time RT-PCR amplifications were performed by The Animal Clinical Laboratory Core Facility at UNC. The primers used for real-time RT-PCR are listed in Table 1. The fluorescent probe was f-CATGACCTGAGCCCTGGCAGCC-q and it had a reporter dye (FAM) covalently attached at its 5′ end and a quencher dye attached at its 3′ end (20). Amplification of the β-actin gene was used as an endogenous control.
Table 1.
Real-time RT-PCR primers and probes
| Gene | Type | Sequence (5′-3′) |
|---|---|---|
| Aldosterone synthase | Forward | AGA AGC CAG CAA CTT TGC TC |
| Reverse | GCA GGG CAT GGA TAA ACT TC | |
| Probe | f CAT GAC CTG AGC CCT GGC AGC C q | |
| SGK1 | Forward | GCT TAT GAA CGC TAA CCC CT |
| Reverse | GAA AGT CGG AGG GTT TGG C | |
| Probe | f TCA ACC TGG GTC CGT CCT CCA ACC q | |
| Renin | Forward | ACA GTA TCC CAA CAG GAG AGA CAA G |
| Reverse | GCA CCC AGG ACC CAG ACA | |
| Probe | f TGG CTC TCC ATG CCA TGG ACA TCC q | |
| ENaCα | Forward | AGC GCG TCT TCC AGT GTA C |
| Reverse | GAT TTG TTC TGG TTG CAC AGT | |
| Probe | f CAA CAA TCC CCA AGT GGA CAG GAA GG q | |
| ROMK | Forward | GCA CAG TAG AAT CCA CCA GT |
| Reverse | AAA GCA CCT CTT CTG GGA TG | |
| Probe | f CAA CCT GCC AAG TCC GCA CAT CA q | |
| NKCC2 | Forward | AGG CTC TGT CCT ATG TGA GT |
| Reverse | CAT GGG TCC GCC TGT TAA G | |
| Probe | f TAG ACA ACG CTC TGG AAT TAA CCA CAG q | |
| AQP2 | Forward | TAC GTG GCT GCC CAG CTG |
| Reverse | GGC TGT TGC ATT GTT GTG GA | |
| Probe | f CAT GAG ATT ACC CCT GTA GAA ATC CGC q | |
| β-Actin | Forward | CTG CCT GAC GGC CAG GTC |
| Reverse | CAA GAA GGA AGG CTG GAA AAG A | |
| Probe | t CAC TAT TGG CAA CGA GCG GTT CCG q |
SGK1, serum-glucocorticoid-induced kinase 1; ENaCα, epithelial Na+ channel; ROMK, renal outer medullary K+ channel; NKCC2, Na+-K+-2Cl− cotransporter; AQP2, aquaporin-2; f, reporter dye 1 (6-carboxyfluorescein); q, quencher dye (6-carboxytetramethyl1-rhodamine); t, reporter dye2 (tetrachloro-6-carboxyfluorescein).
Blood and urine analysis.
Whole blood was collected at the time of death using the Microvette 100/200 capillary tube containing lithium heparin. To separate the plasma from the blood cells, the whole blood was centrifuged at 2,600 g at 4°C for 10 min. Urine was collected at death by cystocentesis using a 23G3/4 needle and then transferred to a clean tube. All hematology and urinalysis testing were performed by the Department of Comparative Medicine Clinical Pathology Laboratory at East Carolina University or by The Animal Clinical Laboratory Core Facility at UNC. The fractional excretion (FE) of electrolytes was calculated by the standard equation: FE = (urine electrolyte × serum creatinine/serum electrolyte × urine creatinine) × 100 (5).
Immunofluorescence light microscopy.
Frozen kidney sections were either fixed in 100% acetone or in 95% ethanol, and they were then washed with PBS before blocking with 5% BSA. Antibodies against claudin-2, -3, -4, -7, and -8 were diluted at 1:100. The dilution was 1:50 for anti-Na+-K+ ATPase α1, anti-TSC, and anti-AQP2 antibodies. Sections were examined and photographed using a Zeiss Axiovert S100 inverted fluorescent light microscope equipped with MetaMorph imaging software.
Western blotting.
Kidney tissues from Cln7+/+ and Cln7−/− pups were minced on ice, homogenized in RIPA buffer (36), and centrifuged at 15,000 g to obtain tissue lysates. The total protein concentration of each sample was measured by the bicinchoninic acid protein assay kit and adjusted to equal concentration. Proteins were separated by SDS-PAGE and transferred to nitrocellulose membranes. Membranes were then blocked in 5% nonfat dry milk in PBS plus 0.1% Tween 20 and incubated with primary antibodies at 4°C overnight followed by incubation with appropriate secondary antibodies for 1 h at room temperature. After blotting, the signals were detected by enhanced chemiluminescence on blue autoradiography film.
TEWL measurements.
TEWL measurements were performed on the skin of 2- and 4-day-old Cln7+/+ and Cln7−/− pups using a VapoMeter device (Delfin Technologies, Stamford, CT) (9). During the measurement, the chamber containing a vapor sensor was sealed on the skin surface to be measured, and thus the reading was unaffected by ambient airflows.
Statistical analysis.
Statistical analysis was performed using either Origin50 or SigmaPlot software. All data was expressed as means ± SE. The differences between two groups were analyzed using the Student's t-test. The significance level was set at 0.05. The N indicates the number of mice.
RESULTS
Generation of Cln7−/− mice.
To generate a claudin-7 knockout mouse model, we used the gene-targeting method to replace exon 1, intron 1, and exon 2 of the claudin-7 gene with a PGK-neo cassette in the pDTA targeting vector (Fig. 1A). The F1 male and female heterozygotes derived from chimeras were mated to produce all three genotypes, Cln7+/+, Cln7+/−, and Cln7−/− at the ratios of 0.96:2.18:0.86 (Cln7+/+, N = 108; Cln7+/−: N = 245; Cln7−/−: N = 96). As shown in Fig. 1B, Cln7−/− contained both 2.5 kb (5′ homologous region or called short arm) and 4.2 kb (3′ homologous region or called long arm), but contained no 5.7 kb claudin-7 gene by PCR. For Cln7+/−, it contained all three PCR products. On the other hand, Cln7+/+ produced only a 5.7-kb band, but not 2.5- and 4.2-kb bands as indicated in Fig. 1B.
To confirm the absence of claudin-7 in Cln7−/− mice, RT-PCR, immunostaining, and Western blotting experiments were performed. Total RNA was isolated from the kidneys of Cln7+/+, Cln7+/−, and Cln7−/− mice. As shown in Fig. 1C, claudin-7 mRNA was clearly present in Cln7+/+ and Cln7+/− mice, but absent in Cln7−/− mice. Frozen sections of kidneys from 6-day-old Cln7+/+ and Cln7−/− mice were immunostained with anti-claudin-7 antibody (Fig. 1D). The results showed the presence of claudin-7 immunostaining in Cln7+/+ kidney sections (a), but an absence in kidney sections from Cln7−/− mice (b). The absence of claudin-7 protein was also confirmed by Western blot analysis (Fig. 1E).
Cln7−/− pups fail to thrive and display renal salt-wasting phenotype.
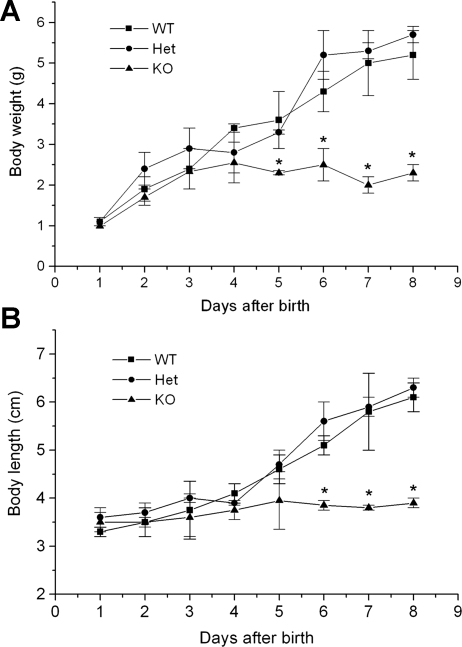
Cln7−/− mice showed no obvious difference in appearance at birth and were similar in body size when compared with their Cln7+/+ and Cln7+/− littermates (Fig. 1B, top). However, starting at 4–5 days after birth, the size difference became evident (Fig. 2). At 1 wk old, the weight of Cln7−/− mice was only ∼36% that of Cln7+/+ mice (P < 0.05; Fig. 2A), and the length of Cln7−/− mice was ∼65% that of Cln7+/+ mice (P < 0.05; Fig. 2B). Therefore, Cln7−/− mice displayed clear growth retardation and failure to thrive.
Fig. 2.
Cln7−/− mice failed to thrive. Cln7+/+ (WT), Cln7+/− (Het), and Cln7−/− (KO) mice were weighed on a daily basis from birth to 8 days (A). The length of the mice was measured at the same time (B). The length of mouse was determined by measuring the distance from the top of the head to its tail using a piece of thread. At least 6 mice for each group were included in the measurements. Cln7−/− mice showed similar weight and size at birth but were not able to grow beyond 5 days. Each data point is presented as means ± SE. *Value is significantly different from the controls (P < 0.05).
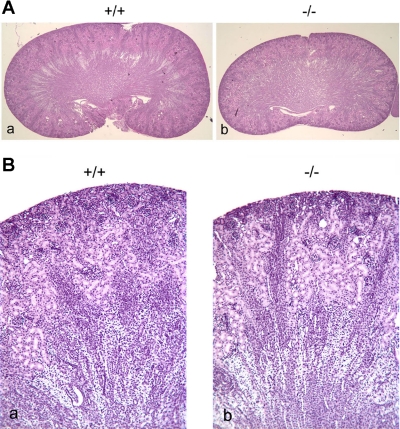
Because claudin-7 is highly expressed in the distal nephrons of the kidney, histological examinations were performed to reveal the internal structure of Cln7−/− kidneys. Figure 3 shows kidney sections from 6-day-old Cln7+/+ and Cln7−/− littermates. No structural defects were observed in Cln7−/− (Fig. 3, Ab and Bb) kidney sections compared with that of Cln7+/+ (Fig. 3, Aa and Ba). However, we have observed that some Cln7−/− kidneys showed hydropic change and detached tubular epithelial cells when the mice were at the late stage of their lives (data not shown).
Fig. 3.
Kidney histology in Cln7+/+ and Cln7−/− mice. Kidneys from 6-day-old Cln7+/+ (a in A and B) and Cln7−/− (b in A and B) mice were dissected, removed from the body, and immediately fixed in 10% buffered formalin. The paraffin sections were stained with hematoxylin and eosin (H & E). Magnification: ×20 (A) and ×100 (B).
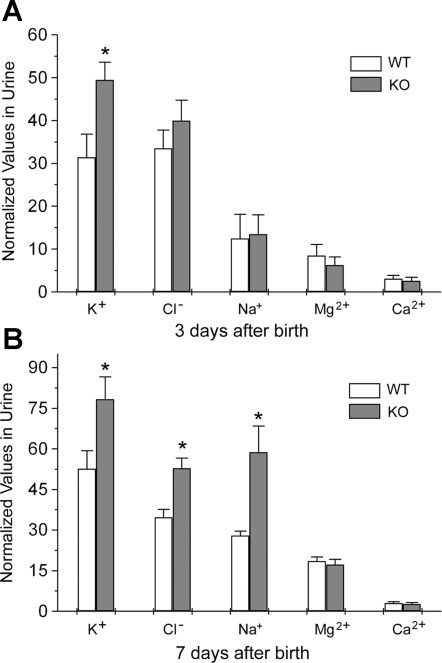
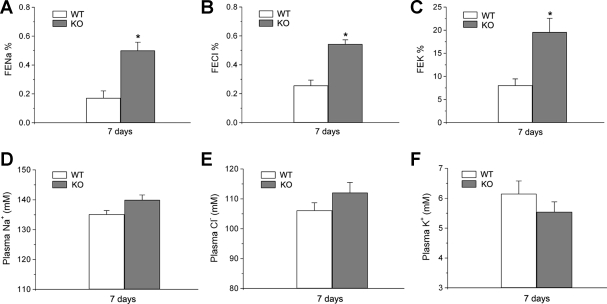
To determine Cln7−/− renal function, we examined blood and urine parameters of Cln7−/− mice and compared them with those of Cln7+/+ mice. We found that 3 days after birth, the K+ level in urine was greatly increased in Cln7−/− mice when compared with that of Cln7+/+ littermates (Fig. 4A). The urinary Cl− level in Cln7−/− mice at 3 days of age showed the tendency to increase, although it did not reach a statistically significant level. At the same age, the urinary Na+, Mg2+, and Ca2+ levels did not show significant differences between Cln7−/− and Cln7+/+ mice (Fig. 4A). However, at 7 days of age, urinary K+, Cl−, and Na+ levels in Cln7−/− mice were all considerably increased compared with those of Cln7+/+ mice, while urinary Mg2+ and Ca2+ levels were similar between Cln7−/− and Cln7+/+ mice (Fig. 4B). To confirm the salt-wasting phenotype, the fractional excretion (FE) of Na+, Cl− and K+ was measured in 7-day-old Cln7−/− and Cln7+/+ mice. As shown in Fig. 5, FE for Na+ (A), Cl− (B), and K+ (C) were all significantly increased in Cln7−/− mice compared with that of Cln7+/+ mice. Measurements of plasma Na+, Cl−, and K+ levels (Fig. 5, D, E, and F, respectively) revealed that, although they did not show significant difference statistically between Cln7−/− and Cln7+/+ mice, plasma K+ level was apparently lower in Cln7−/− mice compared with that of Cln7+/+ mice.
Fig. 4.
Salt wasting in Cln7−/− mice. A: urine was directly collected from the bladder of 3-day-old Cln7+/+ (WT) and Cln7−/− (KO) mice. Urine K+, Cl−, Na+, Mg2+, and Ca2+ were measured and normalized to the urine creatinine concentrations (mM ion/mg creatinine). B: the same measurements were conducted in 7-day-old Cln7+/+ and Cln7−/− mice. Each data point represents at least 6 samples and is presented as mean ± SE. *Significantly different from the control (P < 0.05).
Fig. 5.
Measurements of fractional excretion (FE) of electrolytes. FE of Na+ (A), Cl− (B), or K+ (C) was measured in 7-day-old Cln7+/+ (WT) and Cln7−/− (KO) mice. Each data point represents at least 7 samples and is presented as mean ± SE. Plasma Na+ (D), Cl− (E), or K+ (F) was measured in 7-day-old Cln7+/+ (WT) and Cln7−/− (KO) mice. Each data point represents at least 10 samples and is presented as mean ± SE. *Significantly different from the WT control (P < 0.05).
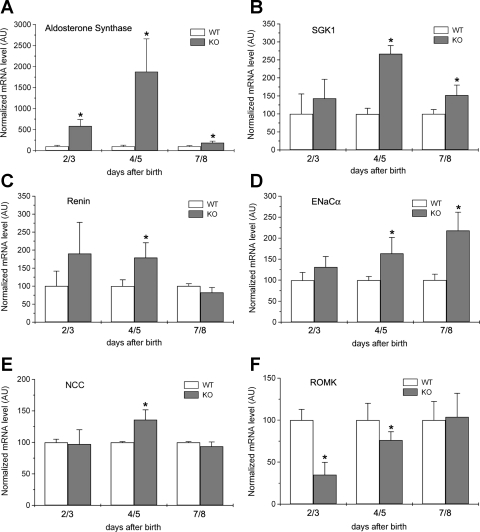
To understand the electrolyte wasting phenotypes, we examined the production of aldosterone and some of its downstream targets in Cln7−/− mice. Table 1 listed the real-time RT-PCR primer sequences for these genes. Because it is quite difficult to collect Cln7−/− blood within 1 wk without hemolysis (Cln7−/− mice show volume depletion and die at such young age), we chose to measure aldosterone synthase mRNA level in 2- to 8-day-old Cln7−/− and Cln7+/+ pups. We found that aldosterone synthase mRNA level was dramatically increased in 2/3-, 4/5-, and 7/8-day-old Cln7−/− pups compared with that of Cln7+/+ mice (Fig. 6A). It reached the highest level in 4/5-day-old Cln7−/− pups. Therefore, we hypothesize that the increased NaCl concentration in the tubular lumen of Cln7−/− distal nephrons results in water loss and reduces extracellular fluid volume, which stimulates the production of aldosterone in an attempt to increase the reabsorption of NaCl and water. At the same time, aldosterone increases the secretion of K+ in Cln7−/− mice. Indeed, the urine aldosterone level was much higher in both 4- and 7-day-old Cln7−/− mice compared with that of Cln7+/+ mice, suggesting that Cln7−/− mice attempted to compensate the loss of NaCl (data not shown). Consistent with the aldosterone synthase increase, SGK1 (serum-glucocorticoid-induced kinase 1) (Fig. 6B) and renin (Fig. 6C) mRNA levels were also significantly increased. SGK1 is one of the aldosterone downstream targets, whereas renin is the upstream signal for stimulating aldosterone synthesis (25). In addition, mRNA levels of other aldosterone downstream targets, ENaCα (Fig. 6D) and NCC (Fig. 6E), were significantly elevated as well in Cln7−/− mice. Interestingly, ROMK mRNA level was greatly reduced in Cln7−/− mice, suggesting that there was a compensatory effect inhibiting ROMK mRNA expression to prevent the loss of K+.
Fig. 6.
Measurements of transcript levels of aldosterone synthase and its related genes. Aldosterone synthase (A), serum-glucocorticoid-induced kinase 1 (SGK1; B), renin (C), epithelial Na+ channel (ENaCα; D), Na+-Cl− cotransporter (NCC; E), and ROMK (F) mRNA levels were measured in adrenal glands or kidneys removed from 2- to 8-day-old Cln7+/+ and Cln7−/− mice using real-time RT-PCR method. Each measurement was normalized to its β-actin level. Cln7+/+ mRNA level was arbitrarily assigned as 100, and Cln7−/− mRNA level was compared with this value. AU, arbitrary unit. Each data point represents at least 5 samples and is presented as mean ± SE. *Significantly different from the WT control (P < 0.05).
Cln7−/− pups show chronic dehydration and increased AQP2 expression.
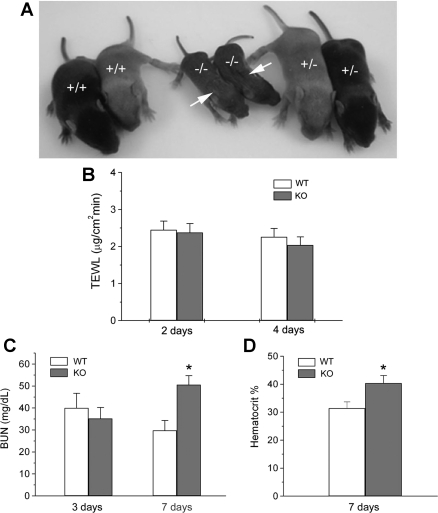
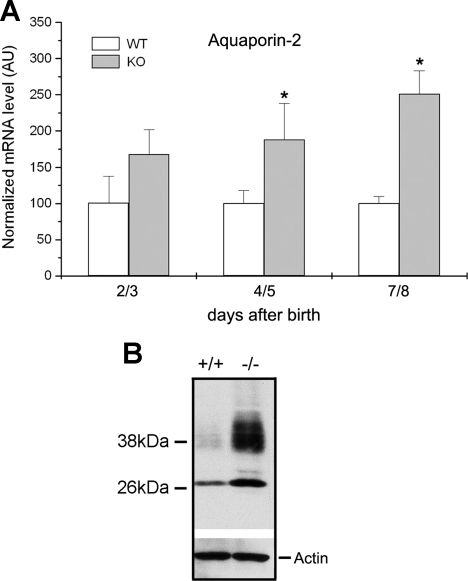
Cln7−/− mice also developed a chronic dehydration phenotype. As shown in Fig. 7A, wrinkled skin was evident in Cln7−/− mice at ∼1 wk of age. These six pups were from the same litter with two wild types (+/+), two knockouts (−/−), and four heterozygotes (+/−) (only two heterozygous mice were shown here). To determine whether dehydration is through skin or not, TEWL measurements were performed on the skin of 2- and 4-day-old Cln7+/+ and Cln7−/− mice. The results from Fig. 7B demonstrated that there was no difference in TEWL between Cln7+/+ and Cln7−/− skin at both 2 and 4 days. On the other hand, our data revealed that, although the blood urea nitrogen (BUN) level between Cln7−/− and Cln7+/+ mice was not significantly different at 3 days of age, it was greatly increased by 70% in Cln7−/− mice 7 days after birth (Fig. 7C). In addition, hematocrit level was also elevated in 7-day-old Cln7−/− mice compared with that of Cln7+/+ mice (Fig. 7D). Increased BUN and hematocrit levels are consistent with the observation that Cln7−/− mice displayed chronic dehydration with wrinkled skin ∼1 wk after birth. It is likely that the increased concentration of ions in tubular fluid caused water loss because of the osmotic effect. To compensate the loss of water, AQP2 expression level was greatly increased at both mRNA (Fig. 8A) and protein (Fig. 8B) levels in Cln7−/− mice. AQP2 shows a 29-kDa nonglycosylated and 35- to 45-kDa glycosylated bands on the Western blot membrane (17, 22). We also found that the serum creatinine level did not show a significant difference between 7-day-old Cln7+/+ and Cln7−/− mice, suggesting that the kidney filtration function of Cln7−/− mice was relatively normal (data not shown).
Fig. 7.
Cln7−/− mice display chronic dehydration. A: 1-wk-old Cln7+/+, Cln7−/−, and Cln7+/− pups from the same litter were shown here. There were a total of 8 mice in this litter with two Cln7+/+, four Cln7+/− (only 2 were shown), and two Cln7−/− mice. Arrows indicate the wrinkled skin on Cln7−/− mice. B: transepidermal water loss (TEWL) measurement. Epidermal water evaporation was measured on the skin of 2- and 4-day-old Cln7+/+ and Cln7−/− mice. At least 7 mice were used for each group with multiple measurements for each mouse. There is no statistical difference in TEWL between two groups (P > 0.05). C: increased blood urea nitrogen (BUN) level in 7-day-old Cln7−/− mice. Whole blood was collected from 3- and 7-day-old Cln7+/+ and Cln7−/− mice. Serum was obtained by centrifuging whole blood at 2,600 g for 10 min at 4°C. BUN was measured by a Clinical Chemistry Analyzer. D: increased hematocrit level in 7-day-old Cln7−/− mice. The hematocrit measurements for Cln7+/+ and Cln7−/− mice were performed using whole blood in the presence of EDTA to prevent blood clotting. Data are represented as means ± SE (N = 6 for each group). *Value is significantly different from the WT control (P < 0.05).
Fig. 8.
Cln7−/− mice show increased aquaporin-2 (AQP2) expression. A: AQP2 mRNA level was measured in kidneys from 2/3-, 4/5-, and 7/8-day-old Cln7+/+ and Cln7−/− mice using real-time RT-PCR method. Each measurement was normalized to its β-actin level. Cln7+/+ mRNA level was arbitrarily assigned as 100, and Cln7−/− mRNA level was compared with this value. Each data point represents at least 5 samples and is presented as mean ± SE. *Value is significantly different from the WT control (P < 0.05). B: kidney lysates from 6-day-old Cln7+/+ (+/+) and Cln7−/− (−/−) mice were homogenized and lysed in lysis buffer. A total of 40 μg protein for each sample was loaded on the SDS-polyacrylamide gel. Membranes were blotted against AQP2 antibody. The same membrane was stripped and blotted using anti-actin antibody to show the loading control.
Increased expression of Na+-K−-ATPase α1 in the distal nephrons of Cln7−/− pups.
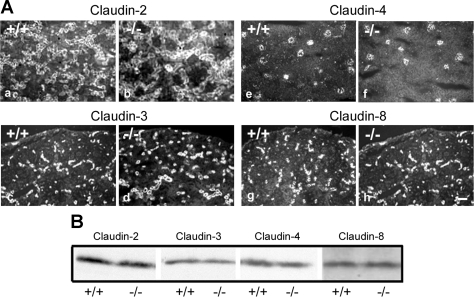
To determine whether the deletion of claudin-7 would affect the expression level of other claudins in kidneys, we examined the distribution and expression level of claudin-2, -3, -4, and -8 in kidneys from Cln7−/− and Cln7+/+ mice. It has been reported that claudin-2 is present in the proximal tubules of kidneys, and claudin-4 is mainly located at the CD (21). Claudin-3 and -8 are both distributed along the distal nephrons of kidneys. Nevertheless, we did not detect any significant changes in distribution pattern (Fig. 9A) or expression level (Fig. 9B) of these claudins. Therefore, the observed ionic reabsorption defects in Cln7−/− mice are most likely related to the absence of claudin-7 itself, and the functions of claudin-7 cannot be compensated by other claudins in the distal nephrons.
Fig. 9.
Expression of claudin proteins in Cln7+/+ and Cln7−/− kidneys. A: kidneys from 1-wk-old Cln7+/+ and Cln7−/− mice were removed from the body and frozen in liquid nitrogen. Frozen sections (5 μm) were immunostained with anti-claudin-2, -3, -4, and -8 antibodies and detected by Cy3-conjugated anti-rabbit secondary antibody. Scale bar: 60 μm. B: kidneys from 1-wk-old Cln7+/+ and Cln7−/− mice were homogenized and lysed in lysis buffer. A total of 40 μg protein for each sample were loaded on the SDS-polyacrylamide gel. Membranes were blotted against claudin-2, -3, -4, and -8 antibodies. Three independent experiments were repeated.
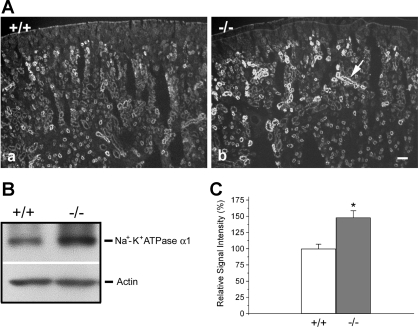
The cellular localization of claudin-7 is unique in that it is not only localized at the apical membrane, but it also has a strong immunostaining at the basal membrane as shown in Fig. 1Da. The basal signal is specific because the deletion of claudin-7 revealed no basal background staining (Fig. 1Db). Because of the basal distribution pattern of claudin-7 and the increased aldosterone synthase mRNA level, we examined the expression of Na+-K+-ATPase (a well-known basal marker) in Cln7−/− kidneys. We found that the expression level of Na+-K+-ATPase functional subunit, α1, was significantly increased in Cln7−/− kidneys compared with that of their wild-type littermates by the immunofluorescent light microscopic method (Fig. 10A). This result was also confirmed by the Western blot analysis (Fig. 10B). Figure 10C indicated that the signal intensity of Na+-K+-ATPase α1 was increased ∼50% for Cln7−/− kidneys.
Fig. 10.
Increased expression of Na+-K+-ATPase α1 in Cln7−/− kidneys. A: kidneys from 6-day-old Cln7+/+ (a) and Cln7−/− (b) mice were removed from the body and immediately frozen in liquid nitrogen. Frozen sections (5 μm) were immunostained with the primary antibody against Na+-K+-ATPase α1. The arrow in b pointed to a tubule with increased Na+-K+-ATPase α1 immunoreactivity. Scale bar: 50 μm. B: kidney lysates from 6-day-old Cln7+/+ and Cln7−/− mice were subjected to Western blot analysis. The membrane was blotted against Na+-K+-ATPase α1 antibody. The same membrane was stripped and blotted using anti-actin antibody to show the loading control. C: densitometry analysis of Na+-K+-ATPase α1 expression level. Following immunoblotting, X-ray films were scanned, and band images were analyzed. The relative signal intensity of each band was obtained after background subtraction. Data were collected from 5 independent experiments and represented as means ± SE. *Value is significantly different from the control (P < 0.05).
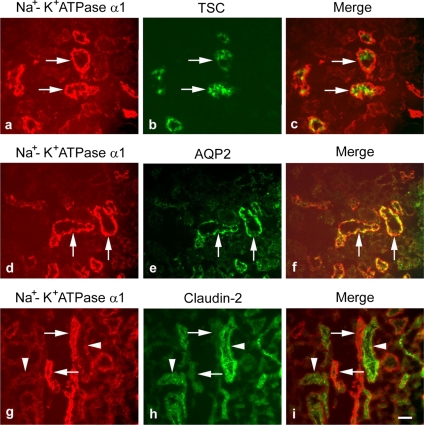
To answer the question as to which segments of renal tubules have the enhanced Na+-K+-ATPase α1 signal, we performed the double immunostaining experiments. Here we found that the enhanced Na+-K+-ATPase α1 signal was localized to the same tubules as that labeled by the TSC immunostaining, a marker for DCT (Fig. 11, a–c). In addition, this increased Na+-K+-ATPase α1 signal was also colocalized with the AQP2 immunostaining, a marker for CD (Fig. 11, d–f). However, it is clear that the tubules with strong Na+-K+-ATPase α1 staining (Fig. 11, g–i) were not the proximal tubules, as labeled by claudin-2 (Fig. 11h). These data indicated that the deletion of claudin-7 resulted in the enhanced Na+-K+-ATPase α1 expression in both DCT and CD where claudin-7 is normally expressed in wild-type kidneys, which can contribute to the significant K+ wasting in Cln7−/− urine.
Fig. 11.
Colocalization of TSC and AQP2 with the increased expression of Na+-K+-ATPase α1 in Cln7−/− kidneys. Kidney frozen sections from 6-day-old Cln7−/− mice were double immunostained by monoclonal anti-Na+-K+-ATPase α1 with polyclonal anti-TSC (distal convoluted tubule marker) (a and b), with anti-AQP2 (collecting duct marker) (d and e), or with anti-claudin-2 (proximal convoluted tubule marker) (g and h) antibodies. Images of c, f, and i were merged images of a and b, d and e, and g and h, respectively. Arrows in a–c, d–f, or g–i indicate the same tubules, respectively. Arrowheads in g–i pointed to the claudin-2 positive tubules that were not colocalized with the tubules with enhanced Na+-K+-ATPase α1 signal. Scale bar: 20 μm.
DISCUSSION
It has been reported that claudin-7 is involved in the regulation of paracellular Cl− permeability and is a substrate of WNK4 kinase (2, 14, 36). To investigate the claudin-7 function in vivo, we generated the first claudin-7 knockout mouse model by gene-targeted deletion strategy. In this study, we report that claudin-7-deficient mice displayed significant Na+, Cl−, and K+ wasting and chronic dehydration as evidenced by the wrinkled skin at ∼6–7 days and increased BUN and hematocrit levels. As a potential compensation for the loss of electrolytes and water, Cln7−/− pups have increased ENaCα, NCC, and AQP2 expression and decreased ROMK expression. These knockout mice failed to grow and died within 12 days after birth.
Based on the previous studies of claudin-7 involvement in paracellular Cl− transport and the salt-wasting phenotype of Cln7−/− mice presented in this study, we propose that mice lacking claudin-7 could have paracellular Cl− reabsorption impairment. The elevated amount of Cl− in the tubular fluid will increase lumen-negative transepithelial voltage in the distal nephrons, which decreases the Na+ reabsorption and leads to Na+ wasting. The increased NaCl concentration in the tubular lumen induces osmotic diuresis, which causes Cln7−/− mice to dehydrate. The decreased extracellular fluid volume stimulates the adrenal cortex to increase aldosterone synthase level as we observed (Fig. 6A) to produce more aldosterone to compensate the loss of NaCl (26). Aldosterone also increases K+ secretion, which could partially explain why we observed K+ wasting in Cln7−/− mice. The physiological evidence supporting the presence of a significant paracellular Cl− conductance in cortical collecting duct (CCD) has been reported previously (31). Using microelectrode techniques on the isolated rabbit CCD, Sansom et al. (31) demonstrated that the paracellular pathway (TJ) provided a major route for transepithelial Cl− transport, and the apical cell membrane in CCD did not have a significant Cl− conductance. Our current study is consistent with these early findings and supports the hypothesis that claudin-7 may serve as a paracellular Cl− channel.
Consistent with the increase in aldosterone expression, we found that renin and SGK1 mRNA levels were also greatly increased in Cln7−/− mice. To compensate the electrolytes and water loss, Cln7−/− mice activated the transcellular transport mechanism and increased ENaCα, NCC, and AQP2 expression. We also observed that K+ was the first ion to show the dramatically increased level in 3-day-old Cln7−/− urine (Fig. 4A). This could be caused by the increased expression of aldosterone in Cln7−/− mice. Indeed, our data showed that aldosterone synthase mRNA level was dramatically increased in Cln7−/− mice as early as 2 days after birth. An alternative hypothesis is that the impaired paracellular Cl− reabsorption could lead to the increased luminal electronegativity in CD, which would increase the driving force for K+ secretion. In addition, failure to reabsorb NaCl (and secondarily water) increases the luminal flow in distal nephrons, thus activating K+ secretion through flow-sensitive K+ channels.
Interestingly, we found that ROMK mRNA level was greatly reduced in Cln7−/− mice. This effect is most likely the result of a compensatory mechanism to prevent K+ loss since plasma K+ level was apparently low in Cln7−/− mice. Plasma Na+ and Cl− levels were slightly higher in Cln7−/− mice, which could be due to the compensatory effects of the transcellular transport system as well as hypovolemia. We also found that Na+-K+-ATPase α1 expression was significantly elevated in both DCT and CD of Cln7−/− mice. Aldosterone has been reported to increase Na+-K+-ATPase expression in the CD (35). However, it is also possible that the increase in Na+-K+-ATPase α1 expression could be partially due to claudin-7 deletion, since our double-immunostaining data revealed that the increase of Na+-K+-ATPase α1 expression occurred at both DCT and CD where claudin-7 is expressed in wild-type mice. In addition, Yu et al. (42) recently showed that claudin-7 and Na+-K+-ATPase α1 were colocalized in renal tubules. Shoshani et al. (33) reported the distribution of Na+-K+-ATPase at the lateral surface of polarized epithelial cells in culture. Further studies utilizing the cell culture system are needed to determine the relationship between claudin-7 and Na+-K+-ATPase.
It is common that multiple claudins are coexpressed in the same cells or in the same tissue. Claudin-claudin interactions have been studied in cell culture systems (7, 10, 30). Recently, Elkouby-Naor et al. (8) reported that double knockouts of claudin-11 and -14 did not produce additional phenotypes, suggesting that there was probably no functional cooperation between claudin-11 and -14 even though both claudins are expressed in kidneys. On the other hand, claudin-16 interacts with claudin-19, and their association has been shown to form a TJ with cation selectivity (16). In the present study, we did not detect any differences in the expression level of claudin-2, -3, -4, and -8 between Cln7−/− and Cln7+/+ kidneys despite the fact that claudin-7 has the overlapping distribution pattern with claudin-3, -4, and -8. This result suggests that the loss of claudin-7 function was unable to be compensated by claudin-3, -4, and -8 localized at the same tubules. However, we cannot rule out the possibility that the expression of other untested claudins may be modulated in the kidney of Cln7−/− mice, which may contribute to kidney function changes reported in this study. Nevertheless, we did observe an increased expression level of AQP2 in the CD of Cln7−/− kidneys. The most likely explanation for this is hypovolemia-induced vasopressin release, which causes AQP2 upregulation to compensate for the loss of water in the Cln7−/− urine. Although it is clear that deletion of claudin-7 causes the defect of kidney function, other tissues may be affected as well and are currently being investigated.
We conclude from this study that claudin-7 is essential for ionic homeostasis in renal tubular epithelial cells. Deletion of claudin-7 causes Na+, Cl−, and K+ wasting, leading to chronic dehydration of the mutant mice. Understanding the role of claudin-7 in renal physiology will help to develop new therapeutic interventions for blood pressure alterations and related kidney disorders.
GRANTS
This work was supported by the East Carolina University Research Development Award, North Carolina Biotechnology Center grant, and National Heart, Lung, and Blood Institute Grant HL-085752 to Y.-H. Chen.
ACKNOWLEDGMENTS
We thank Dr. David Paul of Harvard Medical School for providing us with the targeting vector and Dr. Alexander Simon of the University of Arizona for valuable advice. We are grateful for Dr. Oliver Smithies and Dr. Nobuyuki Takahashi from UNC Chapel Hill for helpful discussions of the project. We thank Dr. Mark Knepper (National Institutes of Health) for providing us with TSC antibody. We acknowledge Joani T. Zary for technical assistance.
REFERENCES
- 1.Alexandre MD, Jeansonne BG, Renegar RH, Tatum R, Chen YH. The first extracellular domain of claudin-7 affects paracellular Cl- permeability. Biochem Biophys Res Commun 357: 87–91, 2007 [DOI] [PubMed] [Google Scholar]
- 2.Alexandre MD, Lu Q, Chen YH. Overexpression of claudin-7 decreases the paracellular Cl- conductance and increases the paracellular Na+ conductance in LLC-PK1 cells. J Cell Sci 118: 2683–2693, 2005 [DOI] [PubMed] [Google Scholar]
- 3.Amasheh S, Meiri N, Gitter AH, Schoneberg T, Mankertz J, Schulzke JD, Fromm M. Claudin-2 expression induces cation-selective channels in tight junctions of epithelial cells. J Cell Sci 115: 4969–4976, 2002 [DOI] [PubMed] [Google Scholar]
- 4.Angelow S, Ahlstrom R, Yu AS. Biology of claudins. Am J Physiol Renal Physiol 295: F867–F876, 2008 [DOI] [PMC free article] [PubMed] [Google Scholar]
- 5.Cantone A, Yang X, Yan Q, Giebisch G, Hebert SC, Wang T. Mouse model of type II Bartter's syndrome. I. Upregulation of thiazide-sensitive Na-Cl cotransport activity. Am J Physiol Renal Physiol 294: F1366–F1372, 2008 [DOI] [PubMed] [Google Scholar]
- 6.Colegio OR, Van Itallie CM, McCrea HJ, Rahner C, Anderson JM. Claudins create charge-selective channels in the paracellular pathway between epithelial cells. Am J Physiol Cell Physiol 283: C142–C147, 2002 [DOI] [PubMed] [Google Scholar]
- 7.Daugherty BL, Ward C, Smith T, Ritzenthaler JD, Koval M. Regulation of heterotypic claudin compatibility. J Biol Chem 282: 30005–30013, 2007 [DOI] [PubMed] [Google Scholar]
- 8.Elkouby-Naor L, Abassi Z, Lagziel A, Gow A, Ben-Yosef T. Double gene deletion reveals lack of cooperation between claudin 11 and claudin 14 tight junction proteins. Cell Tissue Res 333: 427–438, 2008 [DOI] [PMC free article] [PubMed] [Google Scholar]
- 9.Furuse M, Hata M, Furuse K, Yoshida Y, Haratake A, Sugitani Y, Noda T, Kubo A, Tsukita S. Claudin-based tight junctions are crucial for the mammalian epidermal barrier: a lesson from claudin-1-deficient mice. J Cell Biol 156: 1099–1111, 2002 [DOI] [PMC free article] [PubMed] [Google Scholar]
- 10.Furuse M, Sasaki H, Tsukita S. Manner of interaction of heterogeneous claudin species within and between tight junction strands. J Cell Biol 147: 891–903, 1999 [DOI] [PMC free article] [PubMed] [Google Scholar]
- 11.Gonzalez-Mariscal L, Betanzos A, Nava P, Jaramillo BE. Tight junction proteins. Prog Biophys Mol Biol 81: 1–44, 2003 [DOI] [PubMed] [Google Scholar]
- 12.Gow A, Southwood CM, Li JS, Pariali M, Riordan GP, Brodie SE, Danias J, Bronstein JM, Kachar B, Lazzarini RA. CNS myelin and sertoli cell tight junction strands are absent in Osp/claudin-11 null mice. Cell 99: 649–659, 1999 [DOI] [PubMed] [Google Scholar]
- 13.Heiskala M, Peterson PA, Yang Y. The roles of claudin superfamily proteins in paracellular transport. Traffic 2: 93–98, 2001 [DOI] [PubMed] [Google Scholar]
- 14.Hou J, Gomes AS, Paul DL, Goodenough DA. Study of claudin function by RNA interference. J Biol Chem 281: 36117–36123, 2006 [DOI] [PubMed] [Google Scholar]
- 15.Hou J, Paul DL, Goodenough DA. Paracellin-1 and the modulation of ion selectivity of tight junctions. J Cell Sci 118: 5109–5118, 2005 [DOI] [PubMed] [Google Scholar]
- 16.Hou J, Renigunta A, Konrad M, Gomes AS, Schneeberger EE, Paul DL, Waldegger S, Goodenough DA. Claudin-16 and claudin-19 interact and form a cation-selective tight junction complex. J Clin Invest 118: 619–628, 2008 [DOI] [PMC free article] [PubMed] [Google Scholar]
- 17.Inoue T, Terris J, Ecelbarger CA, Chou CL, Nielsen S, Knepper MA. Vasopressin regulates apical targeting of aquaporin-2 but not of UT1 urea transporter in renal collecting duct. Am J Physiol Renal Physiol 276: F559–F566, 1999 [DOI] [PubMed] [Google Scholar]
- 18.Jeansonne B, Lu Q, Goodenough DA, Chen YH. Claudin-8 interacts with multi-PDZ domain protein 1 (MUPP1) and reduces paracellular conductance in epithelial cells. Cell Mol Biol (Noisy-le-grand) 49: 13–21, 2003 [PubMed] [Google Scholar]
- 19.Kahle KT, Wilson FH, Leng Q, Lalioti MD, O'Connell AD, Dong K, Rapson AK, MacGregor GG, Giebisch G, Hebert SC, Lifton RP. WNK4 regulates the balance between renal NaCl reabsorption and K+ secretion. Nat Genet 35: 372–376, 2003 [DOI] [PubMed] [Google Scholar]
- 20.Kim HS, Lee G, John SW, Maeda N, Smithies O. Molecular phenotyping for analyzing subtle genetic effects in mice: application to an angiotensinogen gene titration. Proc Natl Acad Sci USA 99: 4602–4607, 2002 [DOI] [PMC free article] [PubMed] [Google Scholar]
- 21.Kiuchi-Saishin Y, Gotoh S, Furuse M, Takasuga A, Tano Y, Tsukita S. Differential expression patterns of claudins, tight junction membrane proteins, in mouse nephron segments. J Am Soc Nephrol 13: 875–886, 2002 [DOI] [PubMed] [Google Scholar]
- 22.Klein JD, Gunn RB, Roberts BR, Sands JM. Down-regulation of urea transporters in the renal inner medulla of lithium-fed rats. Kidney Int 61: 995–1002, 2002 [DOI] [PubMed] [Google Scholar]
- 23.Konrad M, Schaller A, Seelow D, Pandey AV, Waldegger S, Lesslauer A, Vitzthum H, Suzuki Y, Luk JM, Becker C, Schlingmann KP, Schmid M, Rodriguez-Soriano J, Ariceta G, Cano F, Enriquez R, Juppner H, Bakkaloglu SA, Hediger MA, Gallati S, Neuhauss SC, Nurnberg P, Weber S. Mutations in the tight-junction gene claudin 19 (CLDN19) are associated with renal magnesium wasting, renal failure, and severe ocular involvement. Am J Hum Genet 79: 949–957, 2006 [DOI] [PMC free article] [PubMed] [Google Scholar]
- 24.Li WY, Huey CL, Yu AS. Expression of claudin-7 and -8 along the mouse nephron. Am J Physiol Renal Physiol 286: F1063–F1071, 2004 [DOI] [PubMed] [Google Scholar]
- 25.Makhanova N, Lee G, Takahashi N, Sequeira Lopez ML, Gomez RA, Kim HS, Smithies O. Kidney function in mice lacking aldosterone. Am J Physiol Renal Physiol 290: F61–F69, 2006 [DOI] [PubMed] [Google Scholar]
- 26.Makhanova N, Sequeira-Lopez ML, Gomez RA, Kim HS, Smithies O. Disturbed homeostasis in sodium-restricted mice heterozygous and homozygous for aldosterone synthase gene disruption. Hypertension 48: 1151–1159, 2006 [DOI] [PubMed] [Google Scholar]
- 27.Miyamoto T, Morita K, Takemoto D, Takeuchi K, Kitano Y, Miyakawa T, Nakayama K, Okamura Y, Sasaki H, Miyachi Y, Furuse M, Tsukita S. Tight junctions in Schwann cells of peripheral myelinated axons: a lesson from claudin-19-deficient mice. J Cell Biol 169: 527–538, 2005 [DOI] [PMC free article] [PubMed] [Google Scholar]
- 28.Morita K, Furuse M, Fujimoto K, Tsukita S. Claudin multigene family encoding four-transmembrane domain protein components of tight junction strands. Proc Natl Acad Sci USA 96: 511–516, 1999 [DOI] [PMC free article] [PubMed] [Google Scholar]
- 29.Nitta T, Hata M, Gotoh S, Seo Y, Sasaki H, Hashimoto N, Furuse M, Tsukita S. Size-selective loosening of the blood-brain barrier in claudin-5-deficient mice. J Cell Biol 161: 653–660, 2003 [DOI] [PMC free article] [PubMed] [Google Scholar]
- 30.Piontek J, Winkler L, Wolburg H, Muller SL, Zuleger N, Piehl C, Wiesner B, Krause G, Blasig IE. Formation of tight junction: determinants of homophilic interaction between classic claudins. Faseb J 22: 146–158, 2008 [DOI] [PubMed] [Google Scholar]
- 31.Sansom SC, Weinman EJ, O'Neil RG. Microelectrode assessment of chloride-conductive properties of cortical collecting duct. Am J Physiol Renal Fluid Electrolyte Physiol 247: F291–F302, 1984 [DOI] [PubMed] [Google Scholar]
- 32.Schneeberger EE, Lynch RD. The tight junction: a multifunctional complex. Am J Physiol Cell Physiol 286: C1213–C1228, 2004 [DOI] [PubMed] [Google Scholar]
- 33.Shoshani L, Contreras RG, Roldan ML, Moreno J, Lazaro A, Balda MS, Matter K, Cereijido M. The polarized expression of Na+,K+-ATPase in epithelia depends on the association between beta-subunits located in neighboring cells. Mol Biol Cell 16: 1071–1081, 2005 [DOI] [PMC free article] [PubMed] [Google Scholar]
- 34.Simon DB, Lu Y, Choate KA, Velazquez H, Al-Sabban E, Praga M, Casari G, Bettinelli A, Colussi G, Rodriguez-Soriano J, McCredie D, Milford D, Sanjad S, Lifton RP. Paracellin-1, a renal tight junction protein required for paracellular Mg2+ resorption. Science 285: 103–106, 1999 [DOI] [PubMed] [Google Scholar]
- 35.Summa V, Mordasini D, Roger F, Bens M, Martin PY, Vandewalle A, Verrey F, Feraille E. Short term effect of aldosterone on Na,K-ATPase cell surface expression in kidney collecting duct cells. J Biol Chem 276: 47087–47093, 2001 [DOI] [PubMed] [Google Scholar]
- 36.Tatum R, Zhang Y, Lu Q, Kim K, Jeansonne BG, Chen YH. WNK4 phosphorylates ser(206) of claudin-7 and promotes paracellular Cl(−) permeability. FEBS Lett 581: 3887–3891, 2007 [DOI] [PubMed] [Google Scholar]
- 37.Tsukita S, Furuse M. Claudin-based barrier in simple and stratified cellular sheets. Curr Opin Cell Biol 14: 531–536, 2002 [DOI] [PubMed] [Google Scholar]
- 38.Turksen K, Troy TC. Permeability barrier dysfunction in transgenic mice overexpressing claudin 6. Development 129: 1775–1784, 2002 [DOI] [PubMed] [Google Scholar]
- 39.Van Itallie CM, Anderson JM. Claudins and epithelial paracellular transport. Annu Rev Physiol 68: 403–429, 2006 [DOI] [PubMed] [Google Scholar]
- 40.Wilcox ER, Burton QL, Naz S, Riazuddin S, Smith TN, Ploplis B, Belyantseva I, Ben-Yosef T, Liburd NA, Morell RJ, Kachar B, Wu DK, Griffith AJ, Friedman TB. Mutations in the gene encoding tight junction claudin-14 cause autosomal recessive deafness DFNB29. Cell 104: 165–172, 2001 [DOI] [PubMed] [Google Scholar]
- 41.Yu AS, Enck AH, Lencer WI, Schneeberger EE. Claudin-8 expression in Madin-Darby canine kidney cells augments the paracellular barrier to cation permeation. J Biol Chem 278: 17350–17359, 2003 [DOI] [PubMed] [Google Scholar]
- 42.Yu AS, Kanzawa SA, Usorov A, Lantinga-van Leeuwen IS, Peters DJ. Tight junction composition is altered in the epithelium of polycystic kidneys. J Pathol 216: 120–128, 2008 [DOI] [PMC free article] [PubMed] [Google Scholar]


