Abstract
One goal of systems biology is to understand how genome-encoded parts interact to produce quantitative phenotypes. The Alpha Project is a medium-scale, interdisciplinary systems biology effort that aims to achieve this goal by understanding fundamental quantitative behaviors of a prototypic signal transduction pathway, the yeast pheromone response system from Saccharomyces cerevisiae. The Alpha Project distinguishes itself from many other systems biology projects by studying a tightly-bounded and well-characterized system that is easily modified by genetic means, and by focusing on deep understanding of a discrete number of important and accessible quantitative behaviors. During the project, we have developed tools to measure the appropriate data and develop models at appropriate levels of detail for studying a number of these quantitative behaviors. We also have developed transportable experimental tools and conceptual frameworks for understanding other signaling systems. In particular, we have begun to interpret system behaviors and their underlying molecular mechanisms through the lens of information transmission, a principal function of signaling systems. The Alpha Project demonstrates that interdisciplinary studies that identify key quantitative behaviors and measure important quantities, in the context of well-articulated abstractions of system function and appropriate analytical frameworks, can lead to deeper biological understanding. Our experience may provide a productive template for system biology investigations of other cellular systems.
1. Introduction: The function problem
During the 1930s, prescient thinkers such as Warren Weaver asserted that understanding of biology would require knowledge of the molecules that make up living things [1]. By the middle 1990s, the imminent success of genome sequencing projects and the rapid development of high throughput approaches suggested that scientists would soon achieve a critical element of the molecular biology agenda: the identification and characterization of all genetically encoded molecules. However, by that time it was already clear that generating a complete inventory of parts, be they gene sequences, regulatory protein binding sites, mRNAs, or proteins, would only be one step toward a comprehensive understanding of biology. The next challenge would require understanding how individual parts work together to bring about biological outcomes [2]. Here, we term this challenge the “function problem.”
Biological understanding spans many levels of detail and complexity. Cartoon diagrams and natural language narratives sufficiently describe the qualitative or semi-quantitative level of understanding of molecular and cell biology achieved by traditional low-throughput approaches. At this level, researchers combine skill and personal insight with experimental techniques (often well-established) in an ad hoc manner to one problem (often elucidation of a molecular mechanism) at a time. A deeper level of understanding would support the prediction of quantitative behaviors of biological systems given knowledge of their present state [3]. To achieve this goal of prediction, we formed the Center for Quantitative Genome Function (CQGF), a NIH/NHGRI-funded Center of Excellence in Genomic Sciences. The Molecular Sciences Institute leads the Center, which comprises groups at MIT, Pacific Northwest National Laboratory, and Caltech. Initially, we operationally defined a satisfactory solution to the function problem as achieving the understanding and capabilities needed, given knowledge of the native biological system, to predict the quantitative behavior of the system in response to defined perturbations. Here, we discuss outcomes and lessons learned from this first period of the Alpha Project and how they helped frame current research.
In other well-established disciplines, such as mechanics, predictive ability rests on two foundations: (1) the ability to measure relevant quantities and (2) the possession of an analytical framework that defines the important quantities and operations on these quantities to make predictions. For example, in order to predict the future position of a satellite in orbit, the relevant quantities to determine are the satellite’s present position and velocity vector, not its mass, nor the rate of rotation of the earth; the analytical framework is classical physics (e.g., gravitational force and the inverse-square relationship to distance) and calculus. This analogy suggested a similar foundation for predictive biological understanding: biologists would need to determine the salient quantities, learn how to measure them, and most importantly, generate the analytical frameworks that defined operations on those measurements to produce predictions.
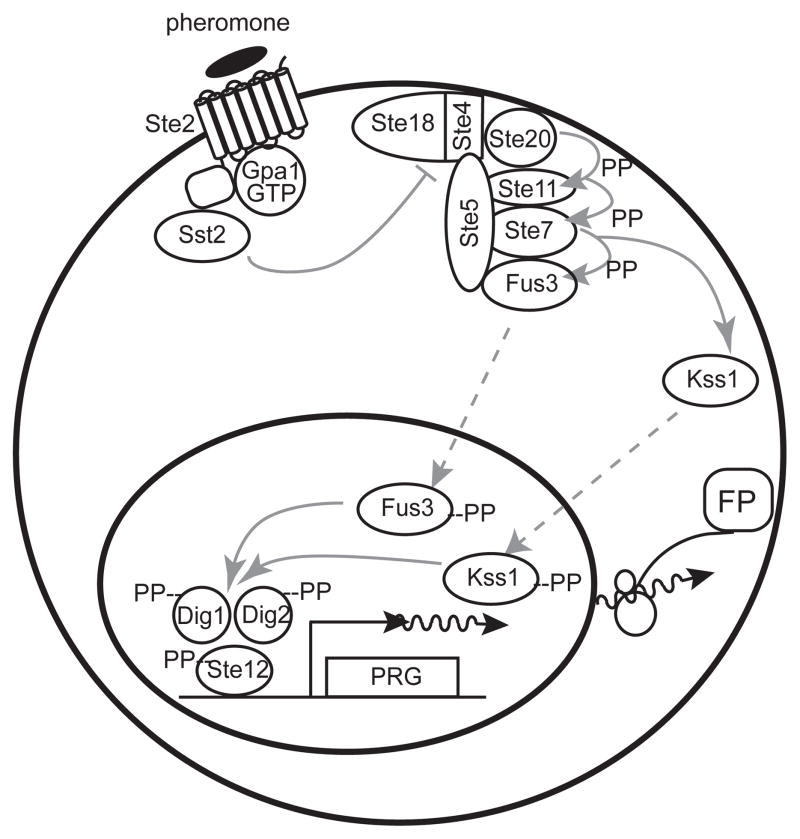
When we formally started the project in 2002, we set out to establish that biology, methodologically and conceptually, had advanced to the point where we could achieve this level of predictive biological understanding, at least for a well-defined prototypic cell signaling system. We assembled an interdisciplinary team and initially set out to develop predictive models of a cell signaling pathway, the yeast pheromone response system (Figure 1). The project initially aimed to understand system function at the level of molecules and known molecular reactions. This approach which required developing technologies to measure concentrations of molecules and rates of reactions, measuring intermediate and terminal outputs of the system, and developing methods to simulate chemical reaction network (CRN)-based models. After building these project foundations, we could test how well we could predict the future quantitative behavior of the pathway in response to specific perturbations, and improve the results after further cycles of experimentation and model refinement
Figure 1.
The yeast pheromone response system. Figure shows major protein components and molecular events after pheromone stimulation [5]. In cells of mating type a (MATa), the pheromone α factor binds to and activates the GPCR Ste2, which then catalyzes the dissociation or rearrangement of the Gαβγ Gpa1/Ste4/Ste18 complex. Sst2 negatively regulates this dissociation by activating the GTPase activity of Gpa1. The Ste4/Ste18 complex then bridges an interaction between the PAK kinase Ste20 and Ste5. Ste5, the scaffold protein, binds the three kinases of the MAPK cascade: the MAPKKK Ste11, the MAPKK Ste7, and the MAPKs Fus3 and Kss1. When Ste20 is in close proximity to Ste5-bound Ste11, it initiates the MAPK cascade by phosphorylating Ste11. Phosphorylated Ste11 phosphorylates and activates Ste7, and phosphorylated Ste7 phosphorylates and activates Fus3 and Kss1. Activated Fus3 and Kss1 phosphorylate several effectors in the cytoplasm and the nucleus, including the transcription factor Ste12 and its suppressors, Dig1 and Dig2. Phosphorylation of these three nuclear proteins causes them to dissociate and/or change conformation. Ste12 then activates transcription of pheromone responsive genes (PRGs). This results in expression of gene products; illustrated here, a fluorescent protein from a reporter gene (FP).
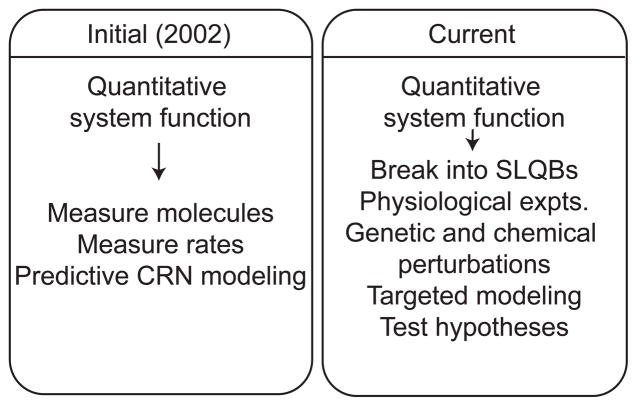
In 2005, we redefined the Center’s aims to reduce the scope of the approach (Figure 2). Rather than continuing to build a complete model of the pheromone pathway that captured all of the measured, time-dependent data, we reconfigured the project to focus on well-defined “system-level” quantitative behaviors (SLQBs) (Figure 3). We defined this term to mean conceptually coherent and measurable quantitative aspects of the system response, over time, to pheromone stimulation (time-dependent dose-responses). In the yeast system, SLQBs are experimentally tractable, and, importantly, are amenable to chemical and genetic manipulation. We concentrated on those SLQBs we believed quantify behaviors fundamental to the function of many signaling systems, for example, dose response alignment (see below).
Figure 2.
Evolution of strategy to understand quantitative system function. Initially, we set out to build a large, complete chemical reaction network (CRN) model of the pheromone response system. We have since broken up the system behavior into tractable, discrete and intuitive subsets or aspects of behavior called systems-level quantitative behaviors (SLQBs). Our strategy is to address SLQBs individually with appropriate models, including detailed chemical reaction network models and coarse-grained “phenomenological” models, as well as apparatus models to understand and account for experimental errors in the data.
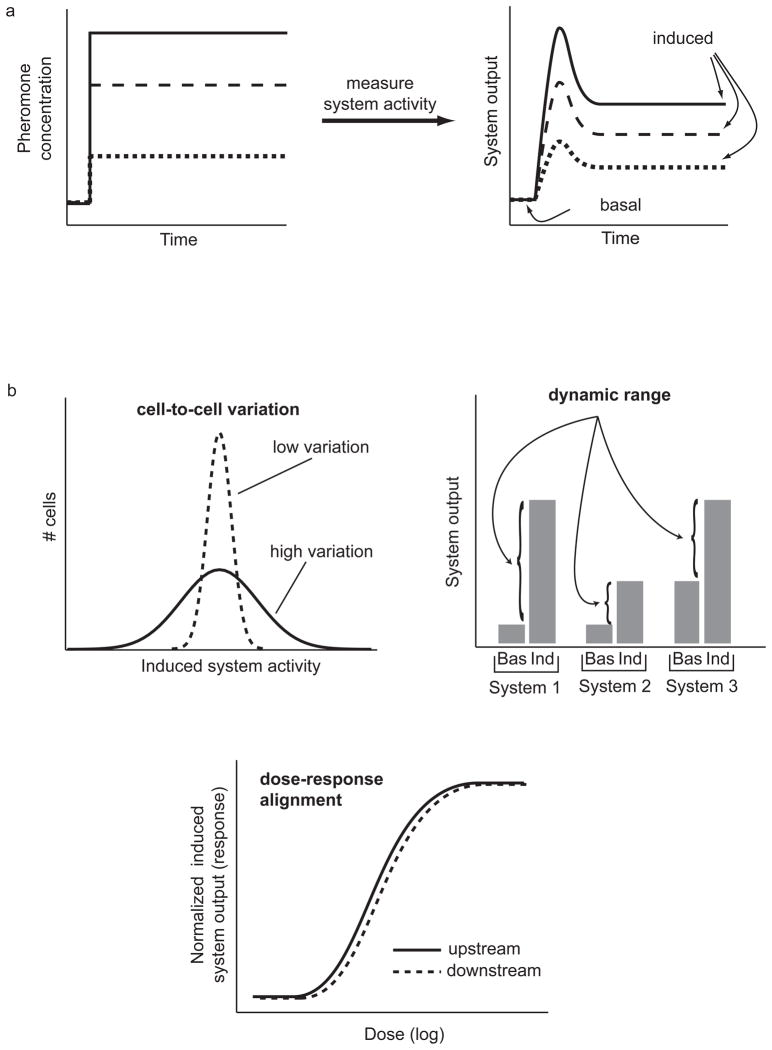
Figure 3.
Breaking up time-dependent dose-responses into systems-level quantitative behaviors (SLQBs). a) Measurements of time-dependent dose-responses. Measurements of system response over time after stimulation with different levels of pheromone revealed that system activity at many measurement points reached a plateau level after a few minutes [11]. b) Three examples of SLQBs we are currently studying, shown in forward genetic studies to be under independent genetic regulation. (Top left) Cell-to-cell variation in system activity (both the variation in the signal reaching the nucleus, and the net variation of this signal combined with variation in gene expression). (Top right) Dynamic range also affects the amount of information the system can transmit. It is determined by both the basal (“Bas”) and induced (“Ind”) levels of system activity. (Bottom) Dose-response alignment. All three SLQBs impact how the system transmits information about external pheromone concentration by affecting the distinguishability of responses to different doses of pheromone [11].
This shift in focus enabled us to explore how specific molecular mechanisms and abstract “architectural” mechanisms, like feedback loops and interactions between pathway subsystems, relate to systems-level quantitative behaviors. As we generated specific hypotheses about the SLQBs, we tested them experimentally. For example, we assessed the consequences of chemical and genetic perturbations on system output, measured in single cells, to test (and eventually validate) the hypothesis that cells regulate cell-to-cell variation in pheromone response [4]. The deeper analysis of these systems-level quantitative behaviors, direct toward the goal of finding overarching concepts and mechanisms that account for them, is the foundation of the Center’s future research.
2. Initial project goals and key outcomes
The proteins and reactions among them that constitute the S. cerevisiae pheromone response system (Figure 1) govern the response of haploid yeast cells to mating pheromone secreted by haploid cells of the opposite mating type. We focused on this system for a number of reasons. Its components- G-protein-coupled receptors, heterotrimeric G-proteins, MAP kinase cascades, and transcriptional machinery)- and key molecular events have been extensively characterized and are echoed throughout all eukaryotes. In addition, we believed that the yeast pheromone response system is at an appropriate level of complexity for an initial systems biology study of this type; it is not a simple, linear pathway, but one that contains numerous feedbacks and parallel feedforward branches [5], and it exhibits complex quantitative behaviors. The organism in which the system operates is quite tractable to genetic manipulation. Moreover, there is a wealth of genetic and biochemical information regarding numerous aspects of system function, complemented by superb bioinformatic resources such as the Saccharomyces Genome Database (SGD), http://www.yeastgenome.org/). S. cerevisiae has arguably the most extensive collection of “whole genome” or “genomic” resources available for any organism, including collections of gene knockouts [6, 7], promoters fused to GFP [8], and proteins fused to affinity-purification tags [9]. These attributes of the organism and the yeast pheromone response system greatly facilitated development of new physiological methods, such as the single cell image cytometric methods [10] (described below). The ability to easily perturb and measure the system remains critical to the ongoing effort.
One of our first decisions was to define boundaries to delimit the scope of the pheromone response system under study. Initially, we defined system boundaries to encompass the set of molecules and processes between sensing of pheromone by the receptor and transcriptional induction of pheromone responsive genes. We then set out to 1) develop technologies to measure concentrations of molecules, rates of reactions, and intermediate and terminal outputs of the system, and 2) develop models and simulation capabilities to test whether we could predict the future quantitative behavior of the pathway in response to specific perturbations.
2.1. Developing measurement technologies and measuring system parameters
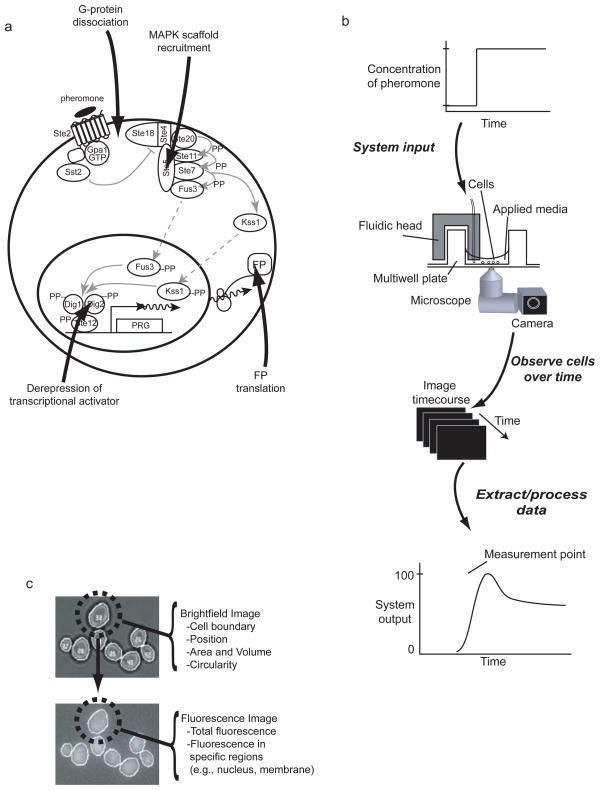
A key outcome of the work has been the development of a powerful suite of open-source image cytometric methods and image and data analysis methods [4, 10, 11] (Figure 4).
Figure 4.
a) Different system measurement points at which we quantify system activity in single cells. b) General experimental design. Cells, affixed on bottom of wells in a multiwell plate, are stimulated with time-variant concentrations of pheromone using custom fluidic devices. We collect images using a microscope and CCD camera over time, extract and process data to determine system outputs at various measurement points. c). Cell-ID cell identification and feature extraction. (Top) Cell-ID identifies cells and their boundaries in defocused brightfield images. (Bottom) Boundaries are transferred to one or more corresponding fluorescence image(s). Dotted circles indicate cell number 32 identified in top panel. Features for each cell are extracted from brightfield and fluorescence images. Existing and newly born cells can be tracked through sequential images to see how features change through time.
The image cytometric methods rely on epifluorescence microscopy. These methods rely on fluorescent-protein (FP) based reporters to probe the system at different points (Figure 4a). An example of a particularly simple and fruitful reporter is a fluorescent protein gene expression reporter used to measure total system output at the “end” of the bounded system. Typically, we use strains expressing CFP, GFP, YFP or RFP/mCherry expressed from a pheromone-responsive promoter [4, 11, 12], such as PRM1 [13]). Such reporters of system output are sensitive, precise, and accurate; we have used them to quantify output in single cells stimulated over six orders of magnitude of pheromone concentration, and have developed an analytical and conceptual framework to use fluorescent protein gene expression reporter outputs to determine the sources of cell-to-cell variation in system response (see [4], discussed further below). We have also made extensive use of translocation reporters and fluorescent resonance-energy transfer (or FRET) reporters (also discussed further below) to quantify system activity at different measurement points and at earlier timescales. Each reporter operates in an otherwise-isogenic yeast strain derived from the reference “wild-type” strain that differs by a small number of defined genetic manipulations.
In our basic image cytometry method, we use open-source software that we wrote (Cell-ID [10] and below) and commercial microscope-controlling software to automatically move among different fields-of-view, focus, and acquire conventional brightfield and epifluorescence images using an ultra-sensitive, cooled CCD camera. With this method, we measure one or more fluorescent reporter outputs from cells from different wells of a multi-well glass bottom plate over time periods ranging from seconds to hours. In this way, we monitor system response at multiple measurement points to various time-variant extracellular conditions (e.g., steps or pulses of different concentrations of pheromone and/or chemical inhibitors of system proteins) (Figure 4b).
We next extract quantitative data about individual cells using Cell-ID, an open-source image analysis program [10]. Cell-ID performs a number of key functions, including finding and enumerating all of the cells in microscope images, handling small changes in cell position, and tracking the same cell and/or its progeny over time. For each cell, the program calculates many different features or statistics, such as different metrics of fluorescence intensity (e.g., total fluorescence or summed fluoresence in subcellular regions such as the membrane or nucleus) or size (Figure 4c). Importantly, Cell-ID can be easily extended to calculate new cellular variables as needed by the researcher (Figure 4c).
To analyze the data, we first mark and remove data corresponding to incorrectly identified cells. We then calculate quantities and their statistics relevant to a particular SLQB being studied. To analyze extracted data, we also developed a suite of data analysis scripts and procedures in Physics Analysis Workstation (PAW), a freely available, command-line data processing and plotting package developed by CERN and commonly used to analyze large datasets linked to single particle events in high energy physics experiments [14] (http://paw.web.cern.ch/paw/). At the Center, we used PAW to analyze analogous data linked to single cells from image and flow cytometry. PAW contains powerful analysis routines and a general scripting language that facilitates development of customized, automated analysis routines. In combination with the image acquisition pipeline we developed, we have successfully applied this general image cytometric method to gather data for studies on cell-to-cell variation in pheromone response [4] and mechanisms affecting dose-response alignment and transmission of information by the system [11] (both described below). Very recently, we extended these capabilities by developing a second set of analysis routines based on another open source statistical package, R [15].
We also measured protein numbers in individual cells by quantifying protein “abundances” (i.e., number of molecules of a specific protein per cell) using translational fusions coupled to fluorescent reporters. These measurements naturally developed from the Center’s core set of image cytometric methods. We improved a method to measure abundance of genetically-encoded fluorescent protein (FP) fusions by calibrating fluorescence signal with purified FP and implementing a phenomenological model to correct for the proportion of FP-fusion protein that is not yet fluorescent due to relatively slow fluorophore maturation rates using measured values of fluorophore maturation rate, growth rate, and protein degradation rate [10]. In parallel, we developed careful quantitative immunoblotting protocols to measure average protein abundances in cell populations to complement the single cell measurements (data not shown). By following these quantities through time, we provided information about both the production and degradation of system components in response to pheromone.
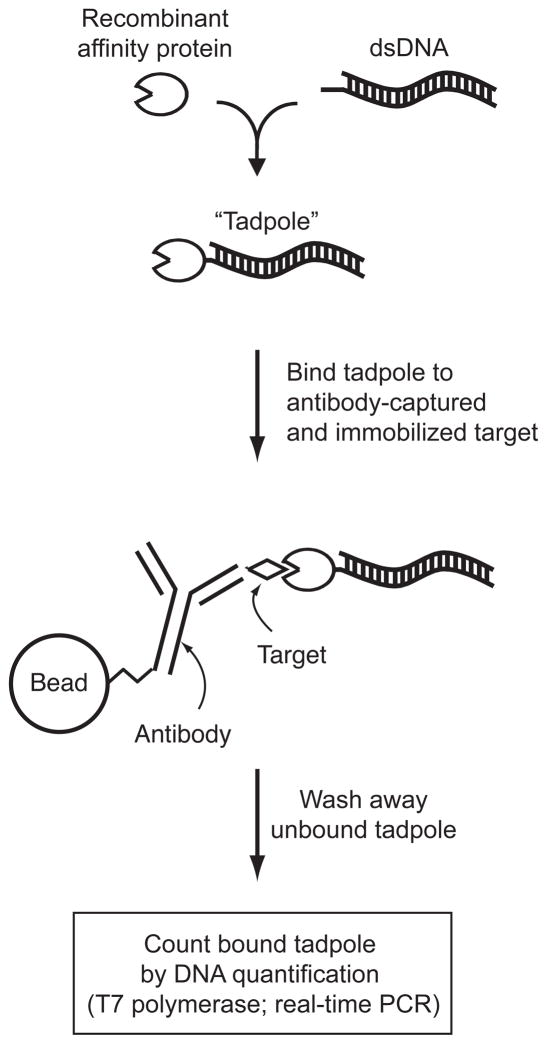
One additional powerful technology that complements these methods to quantify protein abundances is based on protein-DNA chimeras called “tadpoles” [16, 17]. Tadpoles bring the sensitivity of PCR to the detection of arbitrary molecules [16, 17] (Figure 5). Recently, we developed, in addition to tadpoles that recognize specific molecules, a “near-universal” tadpole (“LG-tadpole”) that recognizes all major classes of immunoglobulins, except IgY [17]. The LG tadpole enables quantification of any molecular target for which non-IgY antibodies exist if one can capture the target, by IgY or other means.
Figure 5.
Overview of quantification of molecules using “tadpoles” [16, 17]. Tadpole molecule consists of a specific dsDNA oligonucleotide conjugated to a recombinant protein head with a defined 1:1 stoichiometry. The protein head is any protein that specifically and tightly binds to the defined target. To count target molecules, we capture a target, usually by a bead-immobilized antibody that does not interfere with tadpole binding. We then bind tadpole to antibody-captured and immobilized target molecules, and wash away unbound tadpoles. We then quantify dsDNA tails in bound tadpoles by T7 polymerase or by real-time PCR.
2.2. Developing means to model system behavior and test predictive abilities
During the work, we have made extensive use of three types of mathematical models: 1) apparatus models, 2) chemical reaction network (CRN) models, and 3) phenomenological or coarse-grained models [4, 10]. Here we discuss some lessons learned from working with these models.
2.2.1 Apparatus models
Apparatus models were crucial for accurate quantification by image cytometry. Experimental procedures often introduce errors into data that are difficult to experimentally eliminate but easy to numerically correct. One source of error in image cytometry is light spread from of out-of-focus regions of the cell. Another is the effect of molecular diffusion during the imaging of small numbers of molecules. To account and correct for these effects, we created apparatus models and simulations of the microscope setup [10], and calibrated the simulations by measurements from the apparatus itself. Such apparatus simulations are widely used in experimental physics. These apparatus models enabled measurements that would otherwise have been impossible, such as accurate quantification of total system output from differently sized cells in images during study of cell-to-cell variation [4]. At the moment, use of these models allows us to obtain accurate quantification of reporters for which there are only around 400 FP molecules per cell, a number is limited only by the background autofluorescence of the yeast cells [10].
2.2.2. Chemical reaction network (CRN) models
Any effort to represent a complex and dynamic eukaryotic signaling network as a CRN model faces the same significant problems: (1) the incomplete and sometimes conflicting knowledge about interactions among components and parameter values and (2) the “combinatorial explosion” of all possible protein complexes as the number of components and their possible interactions increase to even modest numbers [18, 19].
To address the need for a well-documented database of component interactions and parameter values describing these interactions, we created the Yeast Pheromone Model “wiki”, an open access information repository for the pheromone response system accessible at http://www.YeastPheromoneModel.org. In the wiki, we organized and summarized knowledge and inferences from the scientific literature, inserted links to supporting papers, stated assumptions, listed chosen model elements (species, reactions, and parameter values), described reasoning behind these choices, and documented the steps of building the computable models. We built software tools that enabled automated model building from tags, capturing reaction rules, written into the wiki pages. These capabilities allowed us to rapidly construct and simulate many well-documented CRN models of the pheromone response system. This “principled” modeling approach has facilitated evaluation, reuse, and revision of models.
To address the “combinatorial explosion” of potential protein complexes, we developed “rule-based” model generation capabilities in a stochastic simulation package, Moleculizer [19]. Moleculizer, like other rule-based simulators for CRN models [20, 21], operates on definitions of individual components and pairwise interactions between them, rather than a comprehensive enumeration of all possible species and reactions, which can be very large. Moleculizer steps around the need to specify and keep track of all possible species (proteins and protein complexes), and instead generates them “on-the-fly” during a simulation. Users have the ability to explicitly define “special reactions” of particular importance that can be more complicated than typical pairwise reactions. Moleculizer enabled the generation and simulation of much smaller reaction networks, increasing the simulation speed and allowing us to test more hypotheses by simulation. Development of Moleculizer also influenced the development of further rule-based simulators, particularly BioNetGen [20], which we currently use to generate models from the wiki.
To ensure that models could be translated for use in other simulation packages, we wrote Moleculizer so that users could run a stochastic simulation for a period of time, and then output the reduced, automatically-generated network at the end of the simulation period in Systems Biology Markup Language (SBML) [22, 23]. We have consistently supported the SBML project. SBML is a markup language made for transportable definitions of biochemical reaction networks. Models in SBML can then be imported into and simulated using other SBML-compliant simulation software packages, typical for ODE-based deterministic simulation.
Perhaps the biggest lesson we learned from using CRN models was the need to reduce the scope of the models to reduce the number of free parameters and make analysis and further hypothesis generation more intuitive. To reduce model scope, we defined subsystems whose inputs were under experimental control and whose outputs were experimentally accessible. For example, we defined a subsystem consisting of the components between the receptor and activated MAPK Fus3. Simulations of this subsystem suggested a tradeoff between absolute magnitude of output (i.e., active Fus3) and dynamic range of output (the ratio of induced levels of active Fus3 to basal levels), and that the balance between the magnitude and dynamic range critically depends on number per cell of the scaffold molecule Ste5 (data not shown). Defining this subsystem and the ability to run many simulations thus enabled us to generate a simple hypothesis easily testable by simple experimental perturbations, such as by changing the per-cell abundance of Ste5.
2.2.3 Coarse-grained phenomenological models
In addition to detailed, chemical reaction network models, we also developed ad hoc, phenomenological models to understand specific aspects of the system that did not require keeping track of individual molecular species and the reactions between them. One of the most fruitful examples of this type of model was a study of a particular systems-level quantitative behavior, cell-to-cell variation in system output [4]. We sought, initially, to understand the sources of cell-to-cell variation in system output in order to properly adapt and use our single-cell data in simulations of CRN models; after deeper analysis, we uncovered important and new biological understanding about regulated sources of cell-to-cell variation in signaling.
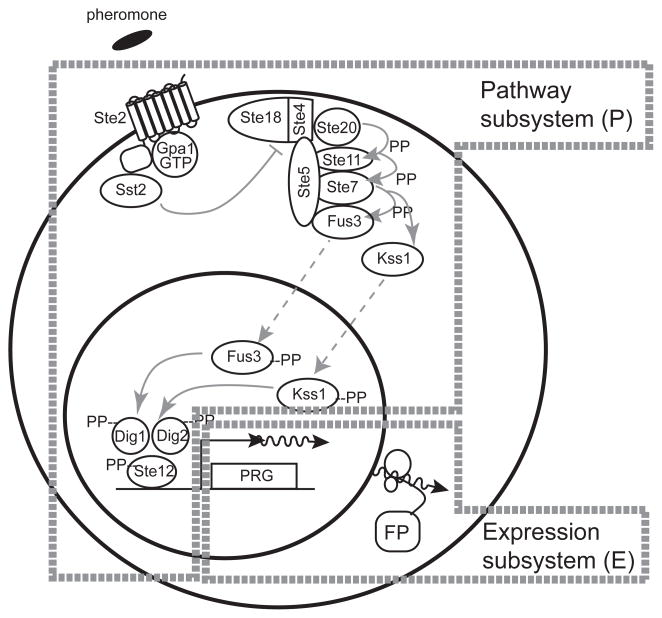
In the model, we split system output into two subsystems. We defined total system output, Yi, measured by amount of expression of a pheromone-inducible fluorescent reporter, as the product, P × E, of their outputs (Figure 6). The output of the first subsystem, P (for Pathway), captured the strength of the signal transmitted through the pheromone response system to the promoter. The second, E (for Expression), reflected the general ability of the cell to turn pathway output into expressed genes (i.e., transcribe mRNA and translate mRNA into protein). The model expressed the cell-to-cell variation in output as the sum of three contributions: variation in pathway, variation in expression, and a third term that allowed a correlation between the two subsystems.
Figure 6.
Analysis of one aspect of system response, the SLQB of cell-to-cell variation in system output. Shown is how we dissected cell-to-cell variation in reporter gene expression. Division of system into a pathway subsystem, P, that goes from receptor binding to transcription factor activation, and an expression subsystem, E, that goes from transcription factor activation to accumulation of reporter protein. By analyzing system output in combination with fluorescent reporter gene expression from constitutive promoters, we were able to find that the majority of cell-to-cell variation in total system output was due to cell-to-cell variation in a component of the expression subsystem, not in gene expression noise or in signal transmission variation [4].
The findings were unexpected [4]. Stochastic fluctuations in the workings of the expression subsystem were small compared to variation caused by initial differences between cells in general ability to express genes into proteins. Variation in signal strength transmitted through the pathway to the promoter was large at low pheromone doses and small at high doses. Importantly, the system’s two different MAP kinases differently modulated signal transmission variation, indicating that the system regulated its variation. There was a strong negative correlation between the expression and the pathway subsystem outputs. Among other consequences, this anti-correlation causes cells to respond more uniformly than they might otherwise. Consistent with this idea, these results suggested that cells have reduced ability to transmit signal when they have high expression capacity, and vice versa. This suggested to us that the amount of variation resulted from genetic selection for efficient coupling between sensitivity to pheromone and cellular states, which is consistent with the genetic results discussed below.
3. Transition to current project goals
This early work illustrated how important precise quantitative measurements from single cells are for revealing, and then for gaining experimental understanding, of important aspects of system behavior. It also suggested that we might be able to gain useful understanding more rapidly by organizing the Center’s work around smaller projects focused on quantitative behaviors we thought might be fundamental. As the work progressed, we came to refer to these as Systems Level Quantitative Behaviors (SLQBs). In addition to cell-to-cell variation in system output, we defined other SLQBs, such as dynamic range of system activity and dose-response alignment (Figure 3).
Implicit in the idea of breaking up system behavior into SLQBs is the idea that, when an investigator finds an appropriate abstraction within the “right” conceptual framework, he or she has often more clearly defined the “function” of a biological system. We have found that information transmission [24] is an appropriate conceptual framework for understanding a fundamental function of the pheromone response system - and that some of the abstractions used to describe information shed light on how cells measure, transmit, and respond to differences in extracellular conditions.
Consider a cell signaling system that transforms input (e.g., the concentration of an extracellular ligand) into output (e.g., measurable responses). If the system transmits a large amount of information about external stimulus levels, then it can transform distinct stimuli into distinguishable responses over a large range of inputs. Molecular mechanisms that increase the noise of signal transmission or reduce the dynamic range of output should decrease the amount of information about stimuli that the system can transmit. One important consequence of reduced information transmission is increased variation in responses from a given cell to the same stimuli multiple times. Variation in system response could have real world consequences for signaling systems that impinge on disease states; for example, if the response of actively-dividing epithelial tissue cells to a signal to “stop proliferation” is more variable after drug therapy, more cells at the “tail end” of the response distribution will undergo unwanted cell division. This increased number of non-responders might result in more cells progressing to cancer. Such situations suggest that the amount of information about external conditions the system can transmit is an important quantitative aspect of a system, making identification and study of SLQBs that affect information transmission, and the mechanisms that regulate them, important.
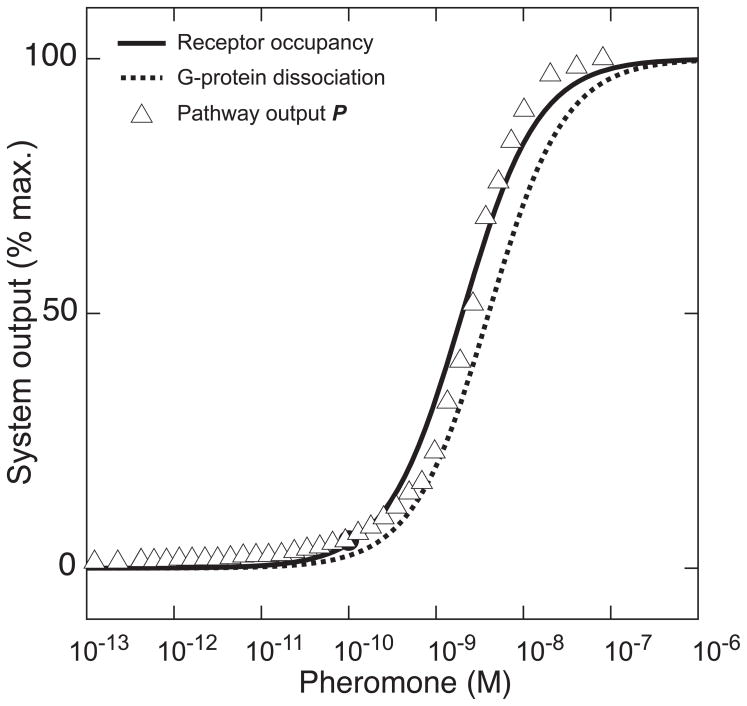
We hypothesized that one SLQB, active alignment of the dose response curves at different stages of signal transmission (Figure 7), increases the amount of information that a system transmits. We [4] and others [25] had observed that the dose-response is the same at the beginning of the system (receptor-ligand binding dose-response) and at the end (the reporter gene expression dose-response). Given the complex structure of the pathway, with multiple positive and negative feedbacks acting at different time scales, multi-protein complexes, and sequential activation of kinases by multi-site phosphorylation, the preservation of the dose-response relationship was unexpected. Moreover, this alignment persists for many hours [4], which was surprising given that numerous system protein abundances are altered by pathway activity at this timescale [5],
Figure 7.
The SLQB of dose-response alignment (DoRA) in the PR system occurs for many levels- receptor occupancy (black line), G-protein dissociation (dashed black line) (calculated from published Hill function parameters fit to experimental data [25]), and pathway output (triangles). One of the consequences of dose-response alignment is increasing the amount of information the system can transmit, by increasing the distinguishability of responses to different doses [11].
We considered the consequences of this seemingly “complex” SLQB, and hypothesized that dose-response alignment (DoRA) should result in an increased amount of transmitted information. Simple thought-experiments suggested that dose-response misalignment should increase transmission noise and make responses to different stimuli less distinguishable. We investigated possible molecular mechanisms that brought about DoRA, and found that MAPK-dependent negative feedback increased the EC50 of the dose response curve at the MAPK activation level, thereby reducing the sensitivity of downstream response such that DoRA occurred. We devised means to use image cytometric methods to measure signal at multiple steps in the pathway and quantitative biochemical measurements, both in combination with genetic and chemical perturbations, we further determined that this feedback depends on a new signal-promoting function of the canonically signal-dampening GTPase-activating protein, Sst2 [11]. Because DoRA is also found in many medically relevant cell signaling systems, such as insulin [26] and EGF [27, 28] response systems, the finding that negative feedbacks help bring it about may represent a general regulatory mechanism by which signaling systems optimize information transmission. This work exemplified a maturing conception of how to combine experimentation, quantification, theory, biological intuition, and modeling, in this case to deepen understanding of system information transmission, and also to identify hitherto-undiscovered “classical” molecular mechanisms that bring about the higher-order functions.
4. Conclusions
At the CQGF, we are continuing to elucidate the molecular mechanisms that regulate key SLQBs in the yeast pheromone system, particularly in the context of information transmission, through a combination of physiological experimentation and mathematical modeling. We are currently using tadpoles in population-based assays (in combination with Center-generated antibodies to pathway protein components; Table 2) to follow protein complexes and protein modifications over time in response to pheromone. We have recently examined how protein modifications, such as phosphorylation, regulate system behaviors, and we have initiated forward genetic studies to identify “extrasystemic” genes (i.e., genes not essential for pheromone response) but involved in cell cycle, translation, and other fundamental cellular processes with specific effects on pheromone response SLQBs. We have also developed means, based on information theory [24], to operationally quantify the amount of information about pheromone doses cells could transmit to the nucleus with measurements of total system output, using fluorescent protein transcriptional reporters, in response to defined concentrations of pheromone [11]. Our experience indicates that the overall behavior of signaling systems can be broken down into tractable quantitative behaviors and understood (both in terms of molecular mechanisms and the functions the system performs) in the context of information transmission.
Table 2.
Project-generated resources available
| Resource | Location |
|---|---|
| Yeast pheromone model Wiki * | http://www.yeastpheromonemodel.org/ |
| Cell-ID; PAW scripts and procedures for image cytometry and flow cytometry processing [4, 10] | http://www.molsci.org/protocols/software.html |
| Moleculizer [19] | http://www.molsci.org/protocols/software.html |
| High affinity polyclonal antibodies against pathway components ** | email corresponding author; see http://www.molsci.org/about/people.html |
| Tadpoles [16, 17] | |
| Thousands of strains (with fluorescent protein fusions to pathway proteins, including translocation and FRET reporter strains; inhibitor-sensitive alleles of pathway kinases; mutated sites of phosphorylation; reporter strain single-gene knockout library) and plasmids ([4, 11] and others ***) |
Thomson et al., personal communication
Pincus et al., personal communication
Pesce et al., personal communication
Importantly, the strong relation between particular SLQBs and individual genes suggests that SLQBs might be subject to natural selection. Additionally, a number of extrasystemic modifiers of yeast pheromone system SLQBs have orthologs in multicellular organisms that might be involved in disease. For example, ribosomal proteins identified in our genetic analyses that affect particular axes of system output, such as expression capacity E (described in 2.2.3) have orthologs that are tumor suppressor genes in zebrafish [29], suggesting that genes that control SLQBs may be relevant to understanding progression to cancer.
We have also initiated comparative genomic analyses to help understand how sequence variations might be responsible for differences in system phenotypes and behaviors within the clade of species related to Saccharomyces cerevisiae. For example, in preliminary investigations, we have observed that S. bayanus has a reduced dynamic range of system output relative to S. cerevisiae, and we are exploring the sequence variations contributing to this difference in quantitative behavior, and the consequences this reduced dynamic range has on the information transmission properties of the system.
We anticipate that a large number of disease risk polymorphisms identified from genome-wide association studies (reviewed in [30, 31]) will involve components of signaling systems, and that changes in these components will result in quantitative phenotypes related to disease states. A better understanding of genotype/phenotype relationships in model systems such as the yeast pheromone system may improve understanding of how sequence polymorphisms relate to diseases, and perhaps how to best design therapeutic interventions for these diseases.
Finally, in some recent studies we are expanding the downstream boundaries of the system to understand how different pheromone system SLQBs regulate cell orientation and partner choice during mating. This will help us understand how downstream systems use and transform information about extracellular pheromone concentration transmitted by the system.
Up to this point, the pheromone response system has proved a fruitful test-bed for quantitative studies of cellular behaviors. In particular, studies whose object has been to understand the particular quantitative behaviors of portions of this signaling system, rather than to identify and study specific molecular details [32], have been successful. Deeper understanding of fundamental signaling SLQBs should be useful for a better understanding of cell signaling systems. It should also contribute ideas and approaches to understanding diseases that arise from changes in the function of cell signaling systems, and so contribute to development of therapeutic interventions.
Table 1.
Technology development and accomplishments
Microscopy methods
|
Single cell measurements
|
Population measurements
|
Acknowledgments
Acknowledgements and author contributions
The work was made possible by grants P50 HG002370 from NHGRI (PI, R. Brent), and R33 CA114306 from NCI (PI, R. Brent), and we are grateful for this support. The assertions in this article are solely the responsibility of the authors. We thank three anonymous reviewers for helpful comments on the manuscript.
The paper presents findings from 6 years of team-based work on this signaling system. The title page names authors in alphabetical order, except R. Yu, O. Resnekov and R. Brent, who wrote the paper and guarantee the integrity of its assertions.
References
- 1.Kay LE. The molecular vision of life: Caltech, the Rockefeller Foundation, and the rise of the new biology. New York: Oxford Univeristy Press; 1993. [Google Scholar]
- 2.Brent R. Genomic biology. Cell. 2000;100(1):169–83. doi: 10.1016/s0092-8674(00)81693-1. [DOI] [PubMed] [Google Scholar]
- 3.Endy D, Brent R. Modelling cellular behaviour. Nature. 2001;409(6818):391–5. doi: 10.1038/35053181. [DOI] [PubMed] [Google Scholar]
- 4.Colman-Lerner A, et al. Regulated cell-to-cell variation in a cell-fate decision system. Nature. 2005;437(7059):699–706. doi: 10.1038/nature03998. [DOI] [PubMed] [Google Scholar]
- 5.Dohlman HG, Thorner JW. Regulation of G protein-initiated signal transduction in yeast: Paradigms and Principles. Annu Rev Biochem. 2001;70:703–754. doi: 10.1146/annurev.biochem.70.1.703. [DOI] [PubMed] [Google Scholar]
- 6.Giaever G, et al. Functional profiling of the Saccharomyces cerevisiae genome. Nature. 2002;418(6896):387–91. doi: 10.1038/nature00935. [DOI] [PubMed] [Google Scholar]
- 7.Winzeler EA, et al. Functional characterization of the S. cerevisiae genome by gene deletion and parallel analysis. Science. 1999;285(5429):901–906. doi: 10.1126/science.285.5429.901. [DOI] [PubMed] [Google Scholar]
- 8.Huh WK, et al. Global analysis of protein localization in budding yeast. Nature. 2003;425(6959):686–91. doi: 10.1038/nature02026. [DOI] [PubMed] [Google Scholar]
- 9.Ghaemmaghami S, et al. Global analysis of protein expression in yeast. Nature. 2003;425(6959):737–41. doi: 10.1038/nature02046. [DOI] [PubMed] [Google Scholar]
- 10.Gordon A, et al. Single-cell quantification of molecules and rates using open-source microscope-based cytometry. Nat Methods. 2007;4(2):175–81. doi: 10.1038/nmeth1008. [DOI] [PubMed] [Google Scholar]
- 11.Yu RC, et al. Feedback regulates information transmission in yeast pheromone response. Nature. 2008 (in press) [Google Scholar]
- 12.Colman-Lerner A, Chin TE, Brent R. Yeast Cbk1 and Mob2 activate daughter-specific genetic programs to induce asymmetric cell fates. Cell. 2001;107(6):739–750. doi: 10.1016/s0092-8674(01)00596-7. [DOI] [PubMed] [Google Scholar]
- 13.Heiman MG, Walter P. Prm1p, a pheromone-regulated multispanning membrane protein, facilitates plasma membrane fusion during yeast mating. J Cell Biol. 2000;151(3):719–30. doi: 10.1083/jcb.151.3.719. [DOI] [PMC free article] [PubMed] [Google Scholar]
- 14.Brun R, et al. PAW Physics Analysis Workstation CERN Program Library entry Q121. CERN; Geneva: 1989. [Google Scholar]
- 15.Chernomoretz A, et al. Cell-ID, a software for microscope-based cytometry. Current Protocols in Molecular Biology. 2008 doi: 10.1002/0471142727.mb1418s84. In press. [DOI] [PMC free article] [PubMed] [Google Scholar]
- 16.Burbulis I, et al. Using protein-DNA chimeras to detect and count small numbers of molecules. Nat Methods. 2005;2(1):31–37. doi: 10.1038/nmeth729. [DOI] [PubMed] [Google Scholar]
- 17.Burbulis I, et al. Quantifying small numbers of antibodies with a ‘near-universal’ protein-DNA chimera. Nat Methods. 2007;4(12):1011–3. doi: 10.1038/nmeth1127. [DOI] [PubMed] [Google Scholar]
- 18.Morton-Firth C. Department of Physiology, Development and Neuroscience. University of Cambridge; Cambridge, UK: 1998. Stochastic simulation of cell signalling pathways; pp. 1–197. [Google Scholar]
- 19.Lok L, Brent R. Automatic generation of cellular reaction networks with Moleculizer 1.0. Nat Biotechnol. 2005;23(1):131–6. doi: 10.1038/nbt1054. [DOI] [PubMed] [Google Scholar]
- 20.Blinov ML, et al. BioNetGen: software for rule-based modeling of signal transduction based on the interactions of molecular domains. Bioinformatics. 2004;20(17):3289–91. doi: 10.1093/bioinformatics/bth378. [DOI] [PubMed] [Google Scholar]
- 21.Meier-Schellersheim M, et al. Key role of local regulation in chemosensing revealed by a new molecular interaction-based modeling method. PLoS Comput Biol. 2006;2(7):e82. doi: 10.1371/journal.pcbi.0020082. [DOI] [PMC free article] [PubMed] [Google Scholar]
- 22.Hucka M, et al. Evolving a lingua franca and associated software infrastructure for computational systems biology: the Systems Biology Markup Language (SBML) project. Syst Biol (Stevenage) 2004;1(1):41–53. doi: 10.1049/sb:20045008. [DOI] [PubMed] [Google Scholar]
- 23.Hucka M, et al. The systems biology markup language (SBML): a medium for representation and exchange of biochemical network models. Bioinformatics. 2003;19(4):524–31. doi: 10.1093/bioinformatics/btg015. [DOI] [PubMed] [Google Scholar]
- 24.Shannon CE. A mathematical theory of communication. The Bell System Technical Journal. 1948;27:379–423. [Google Scholar]
- 25.Yi TM, Kitano H, Simon MI. A quantitative characterization of the yeast heterotrimeric G protein cycle. Proc Natl Acad Sci U S A. 2003;100(19):10764–9. doi: 10.1073/pnas.1834247100. [DOI] [PMC free article] [PubMed] [Google Scholar]
- 26.Cuatrecasas P. Insulin--receptor interactions in adipose tissue cells: direct measurement and properties. Proc Natl Acad Sci U S A. 1971;68(6):1264–8. doi: 10.1073/pnas.68.6.1264. [DOI] [PMC free article] [PubMed] [Google Scholar]
- 27.Knauer DJ, Wiley HS, Cunningham DD. Relationship between epidermal growth factor receptor occupancy and mitogenic response. Quantitative analysis using a steady state model system. J Biol Chem. 1984;259(9):5623–31. [PubMed] [Google Scholar]
- 28.Nagashima T, et al. Quantitative transcriptional control of ErbB receptor signaling undergoes graded to biphasic response for cell differentiation. J Biol Chem. 2007;282(6):4045–56. doi: 10.1074/jbc.M608653200. [DOI] [PubMed] [Google Scholar]
- 29.Amsterdam A, et al. Many ribosomal protein genes are cancer genes in zebrafish. PLoS Biol. 2004;2(5):E139. doi: 10.1371/journal.pbio.0020139. [DOI] [PMC free article] [PubMed] [Google Scholar]
- 30.McCarthy MI, et al. Genome-wide association studies for complex traits: consensus, uncertainty and challenges. Nat Rev Genet. 2008;9(5):356–69. doi: 10.1038/nrg2344. [DOI] [PubMed] [Google Scholar]
- 31.Langefeld CD, Fingerlin TE. Association methods in human genetics. Methods Mol Biol. 2007;404:431–60. doi: 10.1007/978-1-59745-530-5_21. [DOI] [PubMed] [Google Scholar]
- 32.Bornholdt S. Systems biology. Less is more in modeling large genetic networks. Science. 2005;310(5747):449–51. doi: 10.1126/science.1119959. [DOI] [PubMed] [Google Scholar]


