

Abstract
• Background and Aims Hypericum perforatum is a perennial herbaceous plant and an extract from this plant has a significant antidepressant effect when administered to humans. The plant is characterized by its secretory glands, also known as dark glands, which are mainly visible on leaves and flowers. The current study evaluates the influence of several environmental factors and developmental stages of the plant on the accumulation and synthesis of hypericin and pseudohypericin (Hy-G), the major bioactive constituents, in H. perforatum plants.
• Methods The appearance of dark glands on different parts of the plant, under several environmental conditions, was monitored by microscopy. Hy-G concentrations were quantified by high-performance liquid chromatography.
• Key Results A significant presence of dark glands accompanying the highest concentrations of Hy-G was observed in the stamen tissues more than in any other organ of H. perforatum. A linear relationship between the number of dark glands and net photosynthetic rate of the leaf and Hy-G concentration in the leaf tissue was also established. A very high concentration of Hy-G was measured in the dark-gland tissues, but in the tissues without any dark glands it was almost absent. The presence of emodin, a precursor of Hy-G, at a high concentration in the dark-gland tissues, and its absence in the surrounding tissues was also observed, suggesting that the site of biosynthesis of Hy-G is in the dark-gland cells. A significantly low concentration of Hy-G (occasionally non-detectable) was measured in the xylem sap of the stem tissues. The dark-gland tissues collected from leaves, stems or flowers contained similar concentrations of Hy-G.
• Conclusions The concentration of Hy-G in various organs of H. perforatum plants is dependent on the number of dark glands, their size or area, not on the location of the dark glands on the plant. The study provides the first experimental evidence that Hy-G is synthesized and accumulates in dark glands.
Keywords: Emodin, dark gland, net photosynthesis, hypericin accumulation, hypericin synthesis
INTRODUCTION
Many plants synthesize a broad repertoire of complex organic molecules and are an important source of fine chemicals that have found extensive use in the pharmaceutical industry (Brodelius and Pedersen, 1993). Hypericum perforatum, commonly known as St John's-wort, produces one of the best-selling plant-based medicines, which is used mainly as an antidepressant. The major bioactive compound of this plant is the hypericin group (hypericin and pseudohypericin; called Hy-G hereafter), a red naphthodianthrone. Morphologically, H. perforatum plants are characterized by the presence of several types of secretory structures, including translucent glands, dark glands and secretory canals (Curtis and Lersten, 1990; Fornasiero et al., 1998; Bottega et al., 1999). Dark glands, probably first named by Green (1884), are also known as ‘nodules’ (Curtis and Lersten, 1990) or ‘black nodules’ (Onelli et al., 2002; Maggi et al., 2004). This gland is the most important secretory structure in H. perforatum plants. However, there is no experimental evidence that Hy-G or their precursors are synthesized or accumulated in dark glands, or that they are transported from dark glands to different organs or vice versa, nor is there any information on the mechanisms of transport. In contrast, extensive research has been conducted on the anatomical and histological characterization of the dark glands on leaves and petals, starting in the 19th Century (Green, 1884, and references therein; Onelli et al., 2002, Maggi et al., 2004). In several studies, dark glands are proposed as the site where biologically active substances accumulate (McKey, 1979; Curtis and Lersten, 1990; Fornasiero et al., 1998), although no direct evidence of chemical analysis has been presented.
The current study was designed to evaluate the interaction of some major aerial environmental factors (CO2 and irradiance) and plant development stages in relation to Hy-G accumulation and synthesis in the dark glands located in different organs. The numbers of dark glands and Hy-G concentration were quantified in different parts of the plant under several environmental conditions. The aim was to establish whether there is a correlation between the number of dark glands developed on the leaf surface and net leaf photosynthetic rates and Hy-G concentrations. The xylem sap of the entire xylem pathway of the main stem was also measured to evaluate the possible transportation of Hy-G through the xylem network of H. perforatum plants. Accumulation of emodin, a precursor of hypericin, was also quantified in the dark glands of H. perforatum plants, and a hypothetical pathway is presented for the synthesis of Hy-G in the dark glands.
MATERIALS AND METHODS
Germination and plant establishment
Hypericum perforatum ‘Topas’ (St John's-wort) seeds were obtained from Richters The Herb Specialists, Canada. The seeds were washed and placed on top of moist potting soil in a multicell tray covered with plastic wrap. Germination was conducted over a 10-d period at 27 °C with a 16-h photoperiod, a light intensity (photosynthetic photon flux density; PPFD) of about 100 μmol m−2 s−1 and periodic watering with tap water. Following germination, plants (about 1·0 cm high) were transferred to pots (9 cm diameter, one plant per pot) containing 200 g of soil mixture (Yanmar Agricultural Equipment Co., Ltd, Japan). The plants were grown under controlled-environment conditions and watered with a nutrient solution (Hyponex, N : P : K; 6 : 6 : 5; Hyponex Corp. Ltd, Osaka, Japan) every other day and with distilled water in between.
For the first experiment, plants were grown under artificial light (PPFD of 300 μmol m−2 s−1) with a 16-h photoperiod and 60 % relative humidity, 1200 μmol mol−1 CO2 concentration and 25/23 °C air temperature during the photo-/dark period. In the first set of plants, the number of dark glands, area and size (diameter) and Hy-G concentration were studied on selected leaves in relation to leaf development and expansion, i.e. at different leaf ages as well as at similar leaf ages (2 weeks old) but at different stages of plant development. In the second set of plants, the number of leaf dark glands and Hy-G concentrations in the stem tissues in different nodal zones (9- to 12-mm stem sections) during the vegetative (weeks 3–6) and reproductive stages of plant development (weeks 8–11) were evaluated. In the third set of plants, the leaves with various numbers of dark glands were selected, the dark glands were counted and the net photosynthetic rates were measured. Finally, in the fourth set of plants, xylem sap of the stem was isolated and analysed to quantify the hypericin and pseudohypericin concentrations.
In the second experiment, plants were grown under the following environmental conditions: (a) a range of light intensities (PPFDs of 100, 200, 300, 400 and 500 μmol m−2 s−1) each with a CO2 concentration of 1200 μmol mol−1; and (b) a range of CO2 concentrations (400, 800, 1200, 1600 and 2000 μmol mol−1) under a PPFD of 300 μmol m−2 s−1. The plants were tested in terms of number of dark glands per unit leaf area during the vegetative (weeks 3–6) and reproductive (weeks 8–11) stages of plant development.
In the third experiment, plants were grown under the same environmental conditions as for the first experiment, and the dark gland size, number and area, hypericin and pseudohypericin concentrations, dark canals, etc. were studied in the leaf, stem and different organs of flowers, and with different stages of flower development. For measuring the surface area of the stamen, anthers were considered as spherical.
In a separate set of plants, Hy-G and emodin concentrations in the dark-gland tissues and tissues without dark glands of leaf blades, petals and stems during the vegetative (weeks 3–6) and reproductive (weeks 8–11) stages were analysed. Dark glands were carefully separated under a dissecting microscope (each gland with about 10–20 % green leaf or yellow petal tissue).
Morphological study and measurement of net photosynthetic rate
The morphological study was performed on fresh material observed under a precalibrated digital microscope (Keyence Corp., Tokyo, Japan). The net photosynthetic rate (Pn) per leaf area of the fourth to seventh uppermost, fully expanded leaves was measured using a portable photosynthesis system (LICOR-6400®, LI-COR Inc., USA) with a 6400-15 arabidopsis chamber.
Xylem sap collection
Xylem sap collection was carried out immediately after harvesting the plants. In a stem portion (2 cm), a few millimetres of bark was removed from the higher cut end of the stem to avoid phloem contamination. The stem portion was immediately placed in a pressure chamber so that the section of stem with bark removed protruded. The pressure in the chamber was slowly increased to a maximum of 0·15 MPa, and the xylem sap which exuded was collected and separated with micro-capillary tubes for biochemical analysis. Initial tests indicated that pressures up to 0·15 MPa did not cause any contamination by cellular components.
Determination of hypericin, pseudohypericin and emodin concentrations
For the chemical analysis of hypericin, pseudohypericin and emodin concentrations, leaf or flower tissues were collected and flash frozen in liquid nitrogen and stored at −80 °C until the analysis was conducted. The extraction, isolation and chemical analysis methods for hypericin and pseudohypericin were as described by Zobayed et al. (2005). Hy-G concentration was calculated by summing the hypericin and pseudohypericin concentrations.
For extraction of emodin, 1·0 mL of 2 % (v/v) dimethyl sulfoxide in methanol was added to each sample, pulverized at 30 Hz for 6 min (MM 200; Retsch GmbH and Co., Haan, Germany) and centrifuged at 4000 rpm (300 g) at 4 °C for 15 min (Kubota®; Kubota Co., Ltd, Tokyo, Japan). Extracts were filtered through a 0·2-μm syringe filter (Dismic-13HP, Advantec; Toyo Roshi Kaisha Ltd, Tokyo, Japan) and a 20-μL sample of the filtrate was injected into a Phenomenex Hypersil C18 column (3·0 μm, 4·6 mm × 100 mm) in a high-performance liquid chromatography (HPLC) system consisting of an SCL-10A system controller, SIL-10A auto-injector and an CTO-10A column oven (Shimadzu Corp., Kyoto, Japan). The analytes were separated isocratically using the mobile phase of 0·1 mol L−1 triethyl ammonium acetate and acetonitrile (25 : 75, v/v) at a flow rate of 0·5 ml min−1, and emodin was quantified at 252 nm in the SPD-M10AV photodiode array detector. The standard curves were obtained by plotting the standard concentration (0·5, 2·5, 5, 10 and 50 μg mL−1) as a function of peak area in HPLC chromatograms. High linearity (r2 = 0·99) was obtained for each calibration curve.
All the concentrations of hypericin, pseudohypericin, Hy-G and emodin were expressed as milligrams per gram dry mass (DM) or fresh mass (FM) of the tissues.
Statistical analysis
The experiments were conducted twice. When necessary, statistical significance was determined by one-way analysis of variance (ANOVA) using the Sigma Stat program (SigmaStat™ for Windows® V2.03, SPSS Inc.). Differences between means were assessed with the Student–Newman–Keuls test.
RESULTS
The number of dark glands on leaf tissues was studied in relation to leaf development and expansion (Fig. 1). The dark glands were visible in few-day-old first leaves (Fig. 1A, E) but were absent in cotyledons (Fig. 1E). Generally a dark gland gained its full size only within 7–10 d of leaf development (Fig. 1D, F). In a young leaf (5–7 d old), the dark glands were smaller in size and slightly dome-shaped (Fig. 1A, B). Microscopy also revealed that during the vegetative stage of plant development, the cells in the dark glands in young leaves mostly enlarged by expansion rather than through cell division. At the end of the reproductive stage, especially in the old leaves, most of the dark glands appeared to be shrinking and their dome-shape was no longer visible (Fig. 1C). Hy-G concentration also increased with plant development and the maximum concentration was measured only after 3 weeks of leaf development (Fig. 1D); the concentration of Hy-G was slightly lower in the older leaves (Fig. 1D).
Fig. 1.

(A–C) Dark glands of (A) 3-d, (B) 4-week and (C) 9-week-old leaves. Scale bar = 150 μm. (D) Dark gland size, percentage area of dark glands (cm−2) and Hy-G concentration in the leaf tissues during different stages of leaf development of Hypericum perforatum plants. Each symbol represents the mean ± s.e. of ten replicates. (E–G) The development of dark glands on seedlings (E, 2 d old, F, 1 week old; G, 2 weeks old). Scale bar = 6 mm.
The number of dark glands and Hy-G concentration in 2-week-old fully expanded leaves were studied throughout the vegetative and reproductive stages. The average number of dark glands studied on the second or third fully expanded leaves from the top generally increased with plant development and reached a maximum number of 8·2 cm−2 at the sixth week of plant development (Fig. 2). The Hy-G concentration in the second or third leaf tissue also increased with time and reached the maximum concentration only after 4 weeks of plant development (Fig. 2). The average concentration of Hy-G declined during the reproductive stage of plant development (especially in weeks 8–11; Fig. 2).
Fig. 2.

Hy-G concentration and number of dark glands during the different stages of plant development of Hypericum perforatum plants. Each symbol represents the mean ± s.e. of ten replicates.
When leaves from different locations of a plant were studied, the number of dark glands was higher in the leaves of the upper part than the lower parts (Fig. 3A). In a 3- to 6-week-old plant, the number of dark glands was highest on the leaves of the third node from the shoot tip (Fig. 3A). In contrast, on an 8- to 11-week-old plant (after flower development), the highest number of dark glands was observed on the leaves of the first or second node from the top. Interestingly, the leaves on the upper part (nodes 1–3) have more glands in the 8- to 11-week-old plants than in the 3- to 6-week-old plants (Fig. 3A).
Fig. 3.

(A) Number of dark glands on the leaves and (B) Hy-G concentration in the stem tissues of different nodes of Hypericum perforatum plants. Each bar represents the mean ± s.e. of 20 replicates.
The Hy-G concentration was highest in the upper part of the stem and dramatically reduced in the lower parts, especially below the fourth node from the top (Fig. 3B). When the xylem sap was extracted and analysed, the concentration of Hy-G was similar in all parts of the stem but was very low compared with that of any other tissue (Table 1). The value was about 5–16 μg mL−1 in the xylem sap (Table 1), 60 μg mL−1 in the leaf tissues (3 mg g−1 DM; Fig. 1D) and 6000 μg mL−1 in the stamen tissues (120 mg g−1 DM; Fig. 12).
Table 1.
Hy-G concentrations in the xylem sap of the stem of Hypericum perforatum plants
| Concentration (μg mL−1) |
||
|---|---|---|
| Stem position (distance from the shoot tip) | Vegetative stage | Reproductive stage |
| 2nd–4th node | 5·1 ± 0·3 | ND* |
| 5th–7th node | 12·3 ± 1·1 | 16·7 ± 1·8 |
| 8th–10th node | ND | ND |
Each value represents the mean ± s.e. of seven replicates.
Non-detectable.
An attempt was also made to see if there is a relationship between the number of dark glands and Hy-G concentration, as well as net photosynthetic rates during the vegetative (plants 3–6 weeks old) and reproductive (plants 8–11 weeks old) stages of plant development. Results revealed that in a 3- to 6-week-old plant, Hy-G concentration was linearly related to the leaf net photosynthetic rate (Fig. 4A, R2 = 0·82). Also, the number of dark glands was linearly related to Hy-G concentration (R2 = 0·75). When the net photosynthetic rates and Hy-G concentration were measured on an 8- to 11-week-old plant, the relationship with the number of dark glands in the leaves was not strong (Fig. 4B).
Fig. 4.
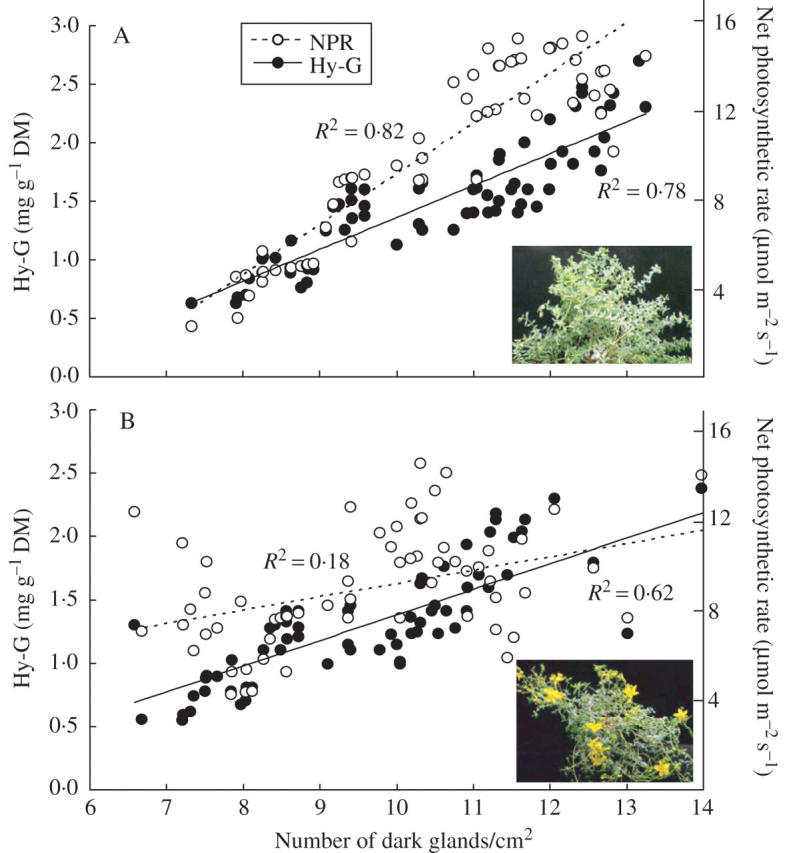
Relationship between number of dark glands and Hy-G concentration and leaf net photosynthetic rates of Hypericum perforatum plants during (A) vegetative (3–6 weeks) and (B) reproductive stage (8–11 weeks); plants were grown with a PPFD of 300 μmol m−2 s−1, a CO2 concentration of 1200 μmol mol−1 and an air temperature of 25/23 °C (photo- and dark period). Each symbol represents the mean of three samples from the same leaf tissue.
The number of dark glands on the leaves was also recorded under different light intensities (PPFD) and generally an increase in PPFD increased the number of dark glands, especially during the vegetative stage (Fig. 5A). The number was strongly related to PPFD and could be expressed as second-order functions of the number of dark glands with an R2 value of 0·90. The number of dark glands was lower during the reproductive stage (R2 = 0·79) than the vegetative stage, especially under higher PPFD (Fig. 5B). When number of dark glands was counted on the leaves of plants grown under different concentrations of CO2, increase in CO2 concentration slightly increased the number of dark glands during the vegetative stage (R2 = 0·37) as well as the reproductive stage (R2 = 0·31) (Fig. 6).
Fig. 5.
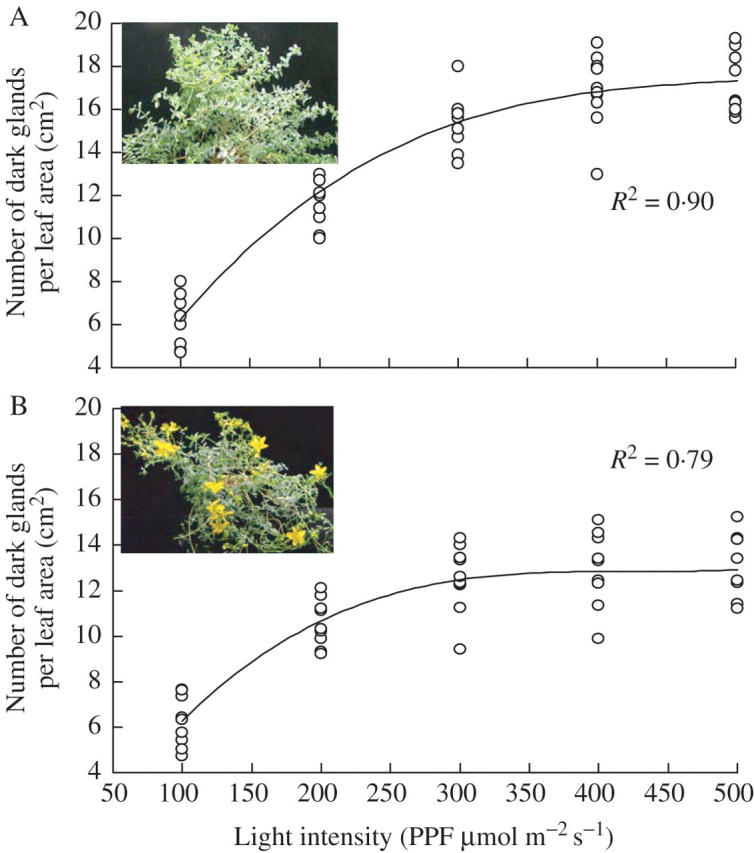
Effect of different photosynthetic photon flux (PPFD) on the number of dark glands of Hypericum perforatum plants during (A) vegetative (3–6 weeks) and (B) reproductive stages (8–11 weeks) of plant development. Each symbol represents the mean of three samples from the same leaf tissue. CO2 concentration = 1200 μmol mol−1.
Fig. 6.
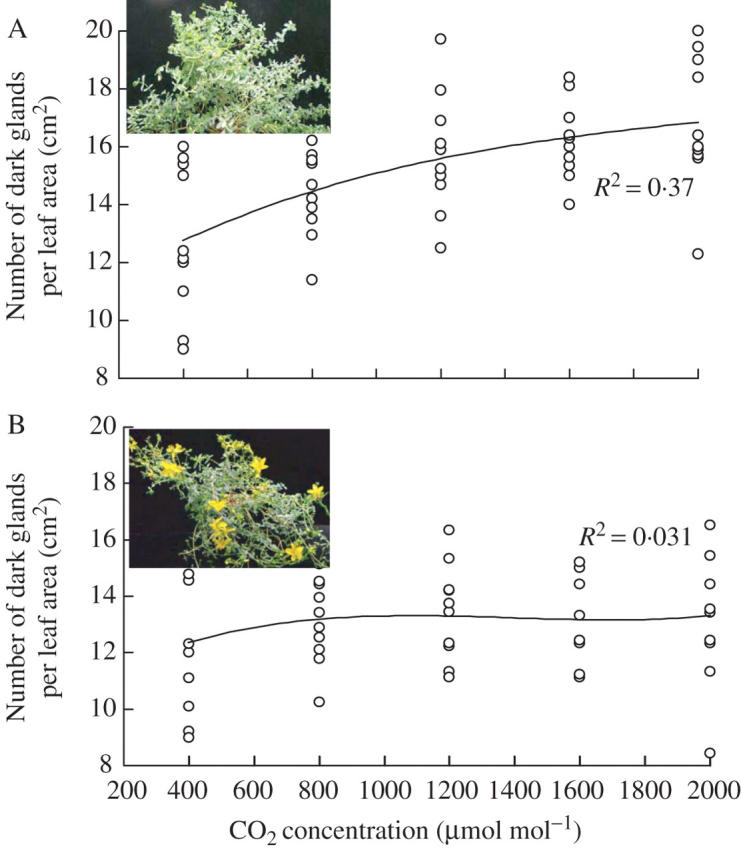
Effect of different CO2 concentration on the number of dark glands of Hypericum perforatum plants during (A) vegetative (3–6 weeks) and (B) reproductive stages (8–11 weeks) of plant development. Each symbol represents the mean of three samples from the same leaf tissue. Light intensity (PPF) = 300 μmol mol m−2 s−1.
Dark glands were also studied in different parts of flower tissues and in different stages of flower development. Dark glands in the stamen were generally largest in size and about twice the size of dark glands in the petal or leaf (Fig. 7A). The smallest size of dark glands was noticed in the carpel and sepal (Fig. 7A). The percentage of the dark-gland area over leaf area was also studied. The dark glands in the stamen occupied about 10 % of the leaf area (Fig. 7B); in contrast, in the leaf and flower petal, the dark glands occupied only 0·7 % and 1·6 % of the leaf area (Fig. 7B). The dark glands in the stamens and petals were also studied at the different stages of flower development (Figs 8 and 9): stage 1, the premature flower bud, green in colour; stage 2, fully developed flower bud, greenish yellow; stage 3, flower buds just before they opened; stage 4, fully opened flower; stage 5, dried flower. The dark-gland area was largest in the stamen tissues at stage 3 (Figs 8 and 9), followed by the flower buds just before unfolding, while the lowest area of dark glands was observed in a premature flower bud, i.e. stage 1, and also in the dried flower, i.e. stage 5 (Fig. 9). In the petals, the dark-gland area reached the highest concentration during stage 3 (Fig. 9).
Fig. 7.

(A) Size and (B) percentage area of dark glands developed in leaves, stems, flower petals, stamens, carpels and sepals tissues of Hypericum perforatum. Each bar represents the mean ± s.e. of 30 replicates.
Fig. 8.
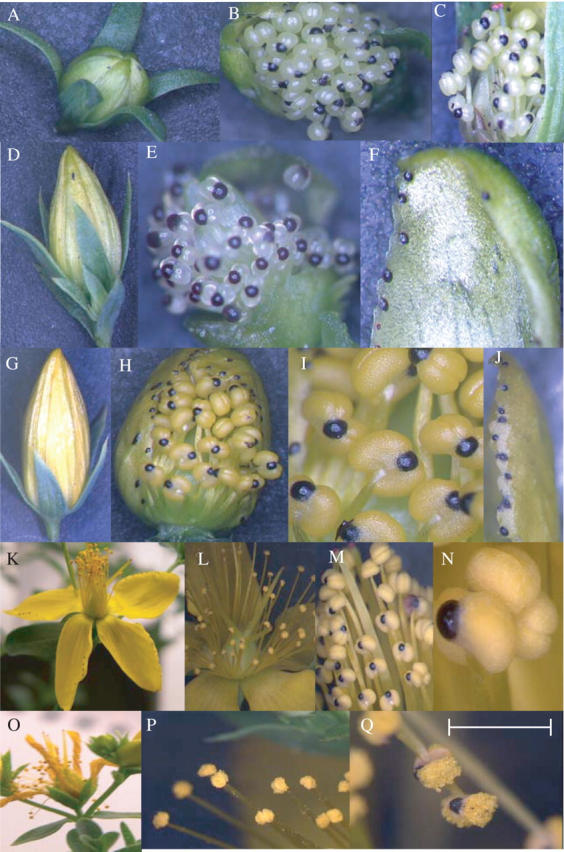
Dark glands located in different types of flower tissues of Hypericum perforatum. (A–C) stage 1 of flower development: (A) an intact flower bud; (B and C) forcedly opened flower bud to show the dark glands located on the stamens. (D–F) Stage 2 of flower development: (D) an intact flower bud; (E) a forcedly opened flower bud to show the dark glands located on the stamens; and (F) on a petal. (G–J) Stage 3 of flower development: (G) an intact flower bud; (H) a forcedly opened flower bud to show the dark glands located on the stamens; (I) a close-up view of the stamens with dark glands; (J) dark glands located on a petal. (K–N) Stage 4 of flower development: (K) a fully opened flower; (L) a close-up view of flower; (M) stamens with dark glands; (N) a close-up view of an anther with dark gland. (O–Q) Stage 5 of flower development: (O) a mature flower; (P) stamens with dark glands; (Q) a close-up view of an anther with dark gland. Scale bar = 7 mm for K and O; 5 mm for A, D, G and L; 3 mm for P; 2·5 mm for C–E, H, J and M; 2 mm for Q; 1·5 mm for F; 1·0 mm for N).
Fig. 9.

Percentage of the area of dark glands on the stamen and petal tissues at different stages of flower development of Hypericum perforatum. Each symbol represents the mean ± s.e. of 30 replicates.
The secretory canals or the dark canals were also studied in different organs in the flower and the elongated canals were mainly observed in the petals (Figs 10A, B and 11), sepals (Figs 10C and 11) and filaments of stamens (Figs 10D and 11). Small, narrow canals were also occasionally located in the carpel. The Hy-G concentration was about three to six times higher in the stamen tissues than in the petal tissues and was 15–20 times that in the carpel or sepal tissues at any stage of flower development (Fig. 12). Among the different developmental stages, the tissues of stages 2 and 3 (flower bud) contained the highest concentration of Hy-G (Fig. 12). When hypericin and pseudohypericin concentrations of the whole flower bud (or flower) tissue were measured, the concentrations again were highest in stages 2 and 3 of flower development (Fig. 13). The pseudohypericin concentration was highest in the tissues of stage 2 followed by stage 3, whereas the hypericin concentrations were similar in the flower tissues of stages 2 and 3 (Fig. 13).
Fig. 10.

Dark canals in (A) petal of a fully opened flower; (B) petal of a young flower bud; (C) sepal, (D) filaments of a stamen and (E) carpel of Hypericum perforatum. Scale bar = 4 mm for A–C; 0·5 mm for D; 2 mm for E.
Fig. 11.

Total length of dark canal on petal, stamen (filaments), carpel and sepal of a fully opened flower of Hypericum perforatum. Each bar represents the mean ± s.e. of ten replicates.
Fig. 12.
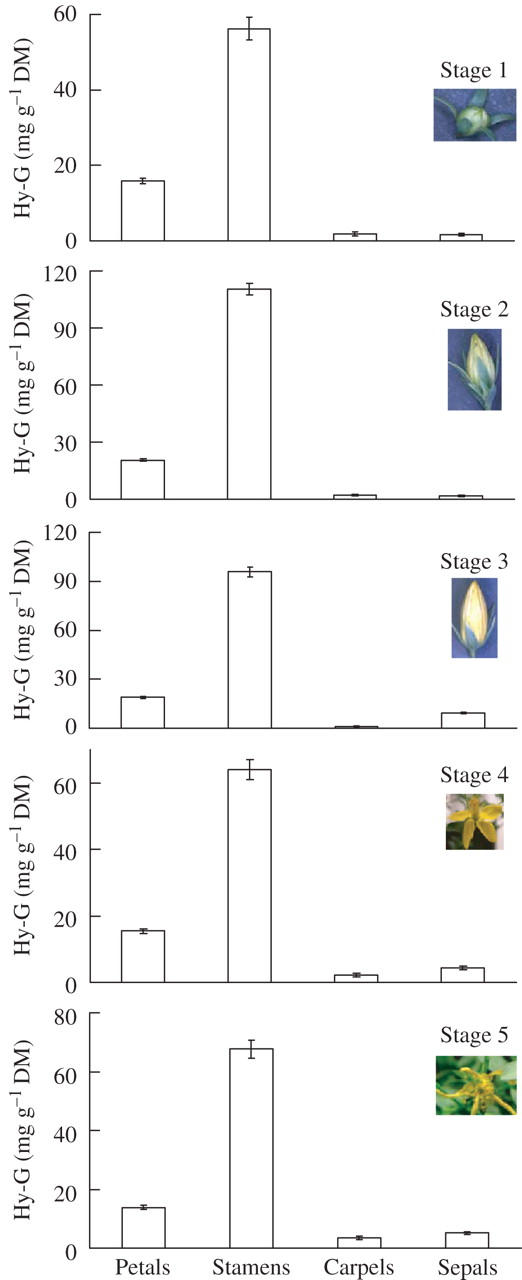
Hy-G concentration in petal, stamen, carpel, and sepal tissues at different stages of flower development Hypericum perforatum. Each bar represents the mean ± s.e. of ten replicates.
Fig. 13.

Average concentrations of hypericin and pseudohypericin in flower tissues (whole flower) at different stages of flower development. Each symbol represents the mean ± s.e. of ten replicates.
When Hy-G concentration was measured in the isolated dark glands, no significant difference was observed in the leaf, stem or flower tissues (Fig. 14A). Even the dark glands isolated from the leaves of 3-week-old (vegetative stage with fully expanded leaves) or 8-week-old plants (reproductive stage with visible flower buds and fully expanded leaves) had a Hy-G concentration which was not significantly different (Fig. 14A). When the dark glands were removed from the leaf, stem or flower tissues no significant difference in Hy-G concentration was noticed among the different parts of the tissues, except the petals (Fig. 14A). Generally, the concentration of Hy-G in tissues without dark glands was very low (Fig. 14A).
Fig. 14.

Hy-G (A) and emodin (B) concentrations in the isolated dark glands (DG) and dark gland-free tissues from leaf, flower and stem tissues; each bar represents the mean ± s.e. of ten replicates. Inset: HPLC peaks of emodin (standard; RT = 2·91 min) detected at a wavelength of 252 nm.
When the dark glands isolated from leaves and flower petals of 3- and 8-week-old plants were analysed for emodin, no significant difference was noted among the different types of tissues (Fig. 14B). The dark gland-free tissues of leaves, stems or petals generally showed a low concentration of emodin (Fig. 14B).
DISCUSSION
Among the numerous bioactive compounds synthesized in H. perforatum tissues, hypericin and pseudohypericin are the two major ones (Miller, 1998). Their synthesis is strictly regulated by the plant and its environment (Zobayed et al., 2003, 2005; Zobayed and Saxena, 2004; Mosaleeyanon et al., 2005). Major aspects of this regulation may involve transport, including intracellular shuffling of intermediates and final products, as well as accumulation in the dark glands located in different organs of the plant, including leaf, stem and flower tissues. Flower tissues are already known to have the highest concentration of Hy-G which is five to eight times higher than the leaf tissues (Zobayed et al., 2005). As far as is known, no report is available on the quantification of hypericin or pseudohypericin in the dark glands, although it has been speculated that the dark glands may be the site of accumulation of hypericin or pseudohypericin in H. perforatum plants (McKey, 1979; Curtis and Lersten, 1990; Fornasiero et al., 1998). Moreover, until now, the presence of large numbers of dark glands has been reported only in the petals and leaves (Curtis and Lersten 1990; Fornasiero et al., 1998). In the current study, a significant presence of dark glands (Figs 7 and 8), accompanied by the highest concentrations of Hy-G, has been shown (Fig. 12) in the stamen tissues more than in any other organs of H. perforatum plants. This explains clearly why high concentrations of hypericin and pseudohypericin are generally reported in the flower tissues.
An attempt was also made to establish a relationship between the number of dark glands and Hy-G concentration in the leaf tissue, as well as net photosynthetic rates during the vegetative (weeks 3–6) and reproductive (weeks 8–11) stages. During the vegetative stage, linear relationships between the number of dark glands and net photosynthetic rates of the leaf and with Hy-G concentration in the leaf tissue were established (Fig. 4A). This relationship indicates that the leaves, capable of assimilating high levels of CO2, can have a high number of dark glands, resulting in high Hy-G concentrations during vegetative growth (Fig. 4A). During the reproductive stage, these correlations were limited (Fig. 4B; R2 = 0·17 and 0·62 for the net photosynthetic rates and Hy-G concentration, respectively). In particular, the leaves in the upper parts of shoots (newly developed) have comparatively high net photosynthetic rates but still have a low number of dark glands (Fig. 4B). The study also illustrated that during the vegetative stage, the location of accumulated Hy-G could be in the dark glands in leaf tissues only; however, during the reproductive stage, the dark glands located in the flower tissues, especially in the stamen, act as the major site for Hy-G accumulation. During this period of development, the leaf Hy-G concentration remained high (Figs 1 and 2) and the plant had already produced substantial leaf area for photosynthesis and vegetative growth was minimal.
Hy-G biosynthesis may lie on the polyketide pathway, presumably through emodin (Mazur et al., 1992), an anthraquinone, and with proto-hypericin as the penultimate precursor (Zobayed et al., 2006), and through the successive condensation of small carboxylic acids (Katz and Donadio, 1993) such as acetate and malonate. Acetate is generated as a product of glycolysis, as the result of fatty acid metabolism by β-oxidation, or by other pathways, and malonyl CoA can be derived from acetyl CoA by the addition of CO2 as catalysed by acetyl CoA carboxylase (Fig. 15). Additionally, malonate is derived from oxaloacetate from the tricarboxylic acid cycle. A pool of acetyl CoA is generally present in the plastids (Ohlrogge and Browse, 1995), and plastidal pyruvate dehydrogenase may act on pyruvate derived from glycolysis or from a side reaction of ribulose bisphosphate carboxylase to form acetyl CoA. Chloroplasts are known to contain an extremely active acetyl CoA synthetase, and Ohlrogge and Browse (1995) proposed that the synthesis of acetyl CoA in the mitochondria was followed by transport into the chloroplast. However, the absence of chloroplasts and the presence of only a few mitochondria in the dark gland cells (Onelli et al., 2002) make it unlikely that these steps can take place in the dark glands.
Fig. 15.
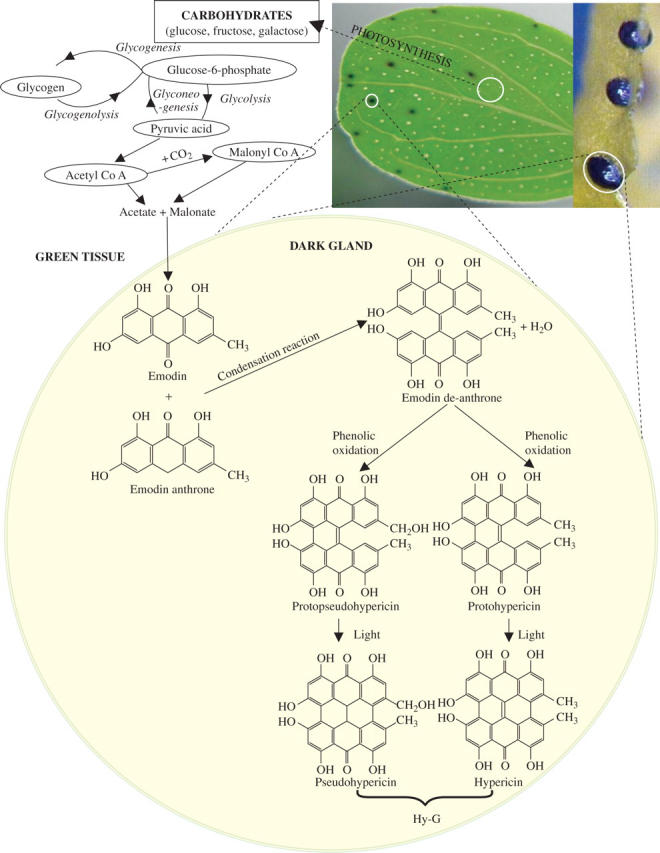
Pathway for the synthesis of Hy-G from emodin in the cells of dark glands. Drawn from the data presented by Katz and Donadio (1993), Birch (1967), Zobayed et al. (2006) and the current study.
As the site of the production of photosynthates (green leaf) differs from the site of Hy-G accumulation in dark glands in flower and leaf tissues (Fig. 14A), it is concluded that long-distance transport of photosynthates via the phloem, xylem or apoplastic space occurs. Dark glands are already known to be connected to the minor veins and vein endings, and are surrounded by an irregular vascular reticulum, which typically includes contact with one or more vein endings (Curtis and Lersten, 1990). Moreover, the dark canals located in different organs (Figs 10 and 11), also known to be associated with veins (Curtis and Lersten, 1990), could be a route of transport as proposed by Williams (1954). Multi-vesicular structures in outer flat cells of developed dark glands were investigated by Onelli et al. (2002), who showed that the content is similar to the cytoplasm, with ribosome-like structures. The presence of ribosomes may indicate the production of cytoplasmic proteins such as enzymes for active transport of metabolites. Onelli et al. (2002) also showed the presence of numerous plasmodesmata in the outer flat cells of dark glands, suggesting an intense symplastic transport of photosynthates into the glandular cells.
For the conversion of emodin to Hy-G (Fig. 15), an initial condensation reaction between emodin and emodin anthrone, followed by dehydration to form emodin dianthrone takes place, which may undergo phenolic oxidation to form protohypericin and finally hypericin (Fig. 15). Conversion of protohypericin to hypericin generally takes place in the presence of light through a simple biochemical process. The presence of emodin at a high concentration in the dark glands and its absence in other tissues (Fig. 14B) suggests that all of the above-mentioned biochemical pathways for the synthesis of hypericins may take place in the dark-gland cells. The data presented in Table 1, showing the presence of a very low concentration of Hy-G (occasionally non-detectable) in the xylem sap, indicates the limited possibility of the transportation of Hy-G through the xylem network.
Hy-G is thought to function as defensive allelochemicals in H. perforatum and it has been proposed that these chemicals are localized in dark glands present primarily on the margins of leaves and petals (Curtis and Lersten, 1990; Fornasiero et al., 1998). The data presented in Fig. 14A established that Hy-G is indeed mainly located in the dark glands. If the dark glands are removed, the Hy-G concentration remains similar in the leaf, flower or stem tissues (Fig. 14A). Moreover, the dark gland itself contained similar concentrations of Hy-G, irrespective of its location in the plants. Hence, the concentration of Hy-G in various organs depends on the number of dark glands, their size or area, not on the location of the dark glands in the plant. Transport of photosynthates from the green leafy cells into the dark gland cells of leaf or flower could be in the form of malonate and/or acetate (precursors of emodin) in the polyketide pathway. Further investigations are in progress to establish the location of the metabolite and the correlation with the differences between dark-gland cells and the green cells of leaves.
LITERATURE CITED
- Birch AJ. 1967. Biosynthesis of polyketides and related compounds. Science 156: 202–206. [DOI] [PubMed] [Google Scholar]
- Bottega S, Garbari F, Pagni AM. 1999. Secretory structures in Hypericum elodes L. (Hyperaceae). I. Preliminary observations. Atti della Scieta Toscana di Scienze Naturali Memorie Serie B 106: 93–98. [Google Scholar]
- Brodelius AP, Pedersen BH. 1993. Increasing secondary metabolite production in plant-cell culture by redirecting transport. Trends in Biotechnology 11: 30–36. [DOI] [PubMed] [Google Scholar]
- Curtis JD, Lersten NR. 1990. Internal secretory structures in Hypericum (Clusiaceae): H. perforatum L. and H. Balearicum L. New Phytologist 114: 571–580. [Google Scholar]
- Fornasiero RB, Bianchi A, Pinetti A. 1998. Anatomical and ultrastructural observations in Hypericum perforatum L. leaves. Journal of Herbs, Spices and Medicinal Plants 5: 21–23. [Google Scholar]
- Green JR. 1884. On the organs of secretions in the Hypericaceae. Journal of the Linnean Society (Botany) 20: 451–464. [Google Scholar]
- Katz L, Donadio S. 1993. Polyketide synthesis: prospects for hybrid antibiotics. Annual Review of Microbiology 47: 875–912. [DOI] [PubMed] [Google Scholar]
- Mckey D. 1979. The distribution of secondary compounds within plants. In: Rosethal GA, Janzen DH, eds. Herbivors: their interaction with secondary plant metabolites. New York, NY: Academic Press, 55–133.
- Maggi F, Ferretti G, Pocceschi N, Menghini L, Ricciutelli M. 2004. Morphological, histological and phytochemical investigation of the genus Hypericum of central Italy. Fitoterapia 75: 702–711. [DOI] [PubMed] [Google Scholar]
- Mazur Y, Bock H, Lavie D. 1992. Preparation of hypericin, United States Patent 0432496.
- Miller AL. 1998. St. John's wort (Hypericum perforatum): clinical effects on depression and other conditions. Alternative Medicine Review 3: 18–26. [PubMed] [Google Scholar]
- Mosaleeyanon K, Zobayed SMA, Afreen F, Kozai T. 2005. Relationships between net photosynthetic rate and secondary metabolite contents in St. John's wort. Plant Science 169: 523–531. [Google Scholar]
- Ohlrogge J, Browse J. 1995. Lipid biosynthesis. The Plant Cell 7: 957–970. [DOI] [PMC free article] [PubMed] [Google Scholar]
- Onelli E, Rivetta A, Giorgi A, Bignami M, Cocucci M, Patrignani G. 2002. Ultrastructural studies on the developing secretory nodules of Hypericum perforatum. New Phytologist 197: 92–102. [Google Scholar]
- Williams BC. 1954. Observations on intercellular canals in root tips with special reference to the Compositae. American Journal of Botany 41: 104–106. [Google Scholar]
- Zobayed SMA, Saxena PK. 2004. Production of St. John's wort plants under controlled environment for maximizing biomass and secondary metabolites. In vitro Cellular and Developmental Biology–Plant 40: 108–114. [Google Scholar]
- Zobayed SMA, Murch SJ, Rupasinghe HPV, Saxena PK. 2003. Elevated carbon supply altered hypericin and hyperforin contents of St. John's wort (Hypericum perforatum) grown in bioreactors. Plant Cell Tissue Organ Culture 75: 143–149. [Google Scholar]
- Zobayed SMA, Afreen F, Kozai T. 2005. Temperature stress can alter the photosynthetic efficiency and secondary metabolite concentrations in St. John's wort. Plant Physiology and Biochemistry 43: 977–984. [DOI] [PubMed] [Google Scholar]
- Zobayed SMA, Afreen F, Kozai T. 2006. Phytochemical and physiological changes in the leaves of St. John's wort plants under a water stress condition. Environmental Experimental Botany 55 (in press).