Abstract
The angular spectrum approach is evaluated for the simulation of focused ultrasound fields produced by large thermal therapy arrays. For an input pressure or normal particle velocity distribution in a plane, the angular spectrum approach rapidly computes the output pressure field in a three dimensional volume. To determine the optimal combination of simulation parameters for angular spectrum calculations, the effect of the size, location, and the numerical accuracy of the input plane on the computed output pressure is evaluated. Simulation results demonstrate that angular spectrum calculations performed with an input pressure plane are more accurate than calculations with an input velocity plane. Results also indicate that when the input pressure plane is slightly larger than the array aperture and is located approximately one wavelength from the array, angular spectrum simulations have very small numerical errors for two dimensional planar arrays. Furthermore, the root mean squared error from angular spectrum simulations asymptotically approaches a nonzero lower limit as the error in the input plane decreases. Overall, the angular spectrum approach is an accurate and robust method for thermal therapy simulations of large ultrasound phased arrays when the input pressure plane is computed with the fast nearfield method and an optimal combination of input parameters.
INTRODUCTION
Pressure fields generated by ultrasound therapy arrays are typically calculated by superposing the fields produced by individual transducer sources. Traditionally, these sources are modeled with point source superposition applied to the Rayleigh–Sommerfeld integral,1, 2, 3 the rectangular radiator method,4, 5, 6 the spatial impulse response method,7, 8, 9 and other analytically equivalent integral approaches. All of these methods calculate the pressure at each grid point; therefore, the simulation time is proportional to the number of array elements multiplied by the size of the computational grid. These simulations are relatively slow due to the large number of calculations involved. In contrast, the angular spectrum approach10 rapidly computes pressures in parallel planes. This approach decomposes the diffracted wave into plane waves via the two dimensional (2D) Fourier transform, propagates these components in the spatial frequency domain, and recovers the pressure field in planes parallel to the input plane through the 2D inverse Fourier transform.
The numerical accuracy of the angular spectrum approach has been extensively discussed for single planar radiators. For example, Williams and Maynard11 analyzed the difference between the analytical Fourier transform and the discrete Fourier transform (DFT) in angular spectrum simulations. Williams and Maynard proposed an averaging approach to reduce the aliasing error and the error induced by certain singularities in the spectral propagator. Orofino and Pedersen12, 13 derived a relationship between the angular range for the decomposed plane wave components and the sampling rate of the spectra in the spatial frequency domain. These parameters are correlated to the spatial sampling rate, which in part determines the accuracy of the angular spectrum simulation. Wu et al.14, 15, 16 derived the maximum angular range that satisfies the Nyquist sampling criteria for the spectral propagator. Wu et al. also used the analytical Fourier transform of a rectangular radiator to eliminate the numerical errors introduced by the DFT of the input normal particle velocity distribution. Zeng and McGough17 compared the performance of the spatial propagator and the spectral propagator in terms of numerical accuracy and time. After identifying an artifact caused by the truncation of the spatial propagator, Zeng and McGough showed that the spatial propagator yields more accurate simulation results once the region containing the artifact is removed, especially for simulations in non-attenuating media. In attenuating media, the spectral propagator achieves similar accuracy in less time. Zeng and McGough also showed that including attenuation in angular spectrum simulations effectively reduces aliasing errors through a spatial frequency filtering effect and that apodizing the input particle velocity distribution achieves the same result. Overall, the spectral propagator is preferred over the spatial propagator for calculations in attenuating media or with an apodized particle velocity source, whereas simulations in non-attenuating media favor the spatial propagator.17
The angular spectrum approach is also widely used for phased array simulations. For example, the pressure fields generated by concentric ring arrays and sector vortex arrays have been compared with experimental results,18 and the angular spectrum approach has also been applied to high intensity focused ultrasound simulations.19 Zemp and Tavakkoli20 compared the sampling of the spatial and spectral propagators for phased array simulations and then derived the maximum unaliased spectral sampling rate for the spectral propagator. Other important issues that impact the accuracy of thermal therapy simulations remain unsolved; therefore, more thorough evaluations of the angular spectrum approach are needed.
This paper evaluates the angular spectrum approach for calculations of time-harmonic pressure fields generated by large ultrasound phased arrays in an attenuating medium. First, the performance of the angular spectrum approach is compared for input planes that consist of particle velocity distributions and pressure distributions. Second, the effect of the location of the input pressure plane and the size of the window that truncates the input pressure plane are determined. Third, the impact of the numerical accuracy of the 2D input pressure on the three dimensional (3D) output pressure field computed with the angular spectrum approach is evaluated. Finally, temperature fields are computed from the 3D pressure fields obtained with the angular spectrum approach, and the errors are compared. The results show that when the input pressure planes are computed with optimal parameters applied to the fast nearfield method, the angular spectrum approach rapidly and accurately calculates pressures for thermal therapy simulations with large ultrasound phased arrays.
THEORY
Integral approaches
In simulations of individual transducers and large ultrasound phased arrays, the pressure is often calculated with the Rayleigh–Sommerfeld integral.10, 21 This 2D integral is ordinarily evaluated with the midpoint rule,22 which is equivalent to subdividing the transducer surface into point sources and superposing all of the contributions.23 The Rayleigh–Sommerfeld diffraction integral10 is
| (1) |
where ρ and c represent the density and the speed of sound, respectively, ω is the driving frequency, k=ω∕c=2π∕λ is the acoustic wavenumber, u is the distribution of the normal velocity on the radiator with surface area S′, j is , and ∣r−r′∣ is the distance between the source coordinates r′=(x′,y′,z′) and the observation coordinates r=(x,y,z).
The spatial impulse response approach is an analytically equivalent method that computes the pressure field with a one dimensional (1D) integral. This integral evaluates the convolution of the impulse response function of a transducer with the time derivative of the excitation function.7 For a rectangular piston excited with a continuous wave input, the pressure is proportional to the Fourier transform of the spatial impulse response, which is described by24, 25
| (2) |
and
| (3) |
where σ is a distance variable, s1=∣x−a∣, s2=∣x+a∣, l1=∣y−b∣, and l2=∣y+b∣, and the + or − sign in Eq. 2 is determined by the spatial location of the observation point with respect to the transducer aperture.
The fast nearfield method24, 25 is a 1D integral approach for nearfield pressure calculations that converges much more rapidly than the spatial impulse response.7 The fast nearfield method for a rectangular piston that is uniformly excited is derived in Ref. 24, and the fast nearfield method for a rectangular piston with an apodized surface velocity distribution is derived in Ref. 25. This method achieves rapid convergence by subtracting singularities, and the computation time is reduced by exploiting repeated calculations. The fast nearfield expression for a uniformly excited rectangular piston24 is
| (4) |
where the limits of integration are s1=a−x, l1=b−y, s2=a+x, and l2=b+y, and a and b represent the half width and the half height of the rectangular source, respectively. The fast nearfield method achieves high numerical accuracy in a very short time.24, 25
Phased array beamforming
For linear simulations of therapeutic ultrasound, the pressure field generated by a phased array is computed via the superposition of complex pressures produced by the array transducers according to
| (5) |
In Eq. 5, N is the number of transducers in the array, and pn is the pressure generated by each transducer. An represents the apodization weight, and Φn is the phase shift applied to each transducer element. An ultrasound beam with a single focus is obtained with the phase conjugation method.26 To focus the array, a complex exponential term that equals the conjugate of the pressure produced by each array element at the focus is applied to that element. Therefore, the pressure waves generated by all of the array elements achieve constructive interference at the focal spot. Through beamforming, the pressure fields generated by ultrasound phased arrays are maximized at selected locations.
Angular spectrum approach
The angular spectrum approach calculates the pressure in a sequence of parallel planes by propagating each spatial frequency component of the diffracted wave in the spatial frequency domain.10 The pressure or normal particle velocity field in an initial plane is defined as the input, and the output from angular spectrum calculations is the pressure evaluated in a series of parallel planes. The pressure field and the angular spectrum in each plane are related through the 2D Fourier transform. In a linear homogeneous medium, the propagation of acoustic waves in the spatial frequency domain is described by27
| (6) |
or
| (7) |
where Δz=z−z0, kx and ky are the transverse wavenumbers, and . P0(kx,ky,z0) is the angular spectrum of the input pressure field p0(x,y,z0); i.e., P0(kx,ky,z0) is the 2D Fourier transform of p0(x,y,z0) with respect to x and y, and U0(kx,ky,z0) is the 2D Fourier transform of the normal particle velocity on the radiator surface. P(kx,ky,z) is the angular spectrum of the pressure in a plane parallel to the source plane. The pressure field in each subsequent plane is then obtained by applying a 2D inverse Fourier transform to P(kx,ky,z) with respect to kx and ky. The spectral propagator Hp(kx,ky,Δz) for an input pressure plane is described by28
| (8) |
and the spectral propagator Hu(kx,ky,Δz) for an input particle velocity distribution is represented by
| (9) |
Both Hp(kx,ky,Δz) and Hu(kx,ky,Δz) describe propagating waves in the region where and evanescent waves that decay exponentially where . The propagator functions in Eqs. 8, 9 are multiplied by an exponential term17 for angular spectrum calculations in attenuating media,
| (10) |
where α is the attenuation coefficient for a given ultrasound frequency. Multiplying the spatial frequency components by S(kx,ky,Δz) achieves equivalent attenuation of pressure waveforms in the spatial domain.
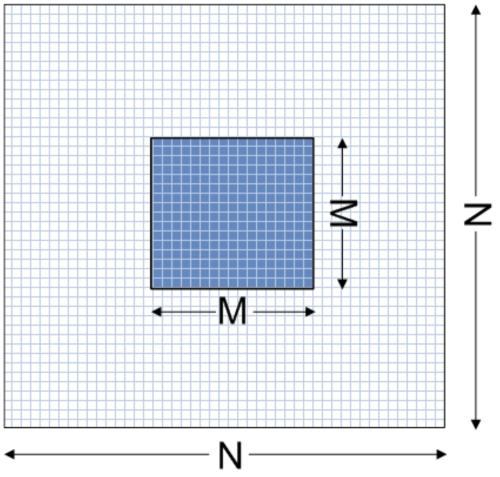
To implement the angular spectrum approach, the input pressure or normal particle velocity field is first discretized, where the geometry of the input plane is illustrated in Fig. 1. An L×L square plane is discretized into a grid containing M×M points with a spatial sampling interval of δ. This grid is zero-padded to a larger N×N grid, and the angular spectrum of the input plane is computed with a 2D fast Fourier transform (FFT). The spectral propagator is then evaluated on the larger N×N grid in the spatial frequency domain. By extending the size of the grid to N×N (N>M), the resolution in the spatial frequency domain is increased and spectral aliasing errors are diminished. The spectral sampling rate is inversely proportional to N via Δk=2π∕(Nδ), and the discretized transverse wavenumbers are
| (11) |
where ϕ is defined by
| (12) |
The parameter ϕ compensates for the offset induced by the odd number of grid points so that m and n are integers.
Figure 1.
The discretized input plane, where the input pressure or normal particle velocity plane is initially computed in an M×M grid and then zero-padded to an N×N grid for angular spectrum calculations. The spectral propagator, which is not zero-padded, is then evaluated in an N×N grid for angular spectrum calculations.
Error evaluations
The numerical error in the simulated pressure field is evaluated with a root mean squared error (RMSE) defined by
| (13) |
where the superscripts (i,j,k) represent discrete field points in the computational grid, nx, ny, and nz describe the number of points in the x, y, and z directions, respectively, pref is the complex reference pressure field computed with the spatial impulse response method, and p is the complex pressure field computed with the angular spectrum approach, the Rayleigh–Sommerfeld integral, or the fast nearfield method. The RMSE is evaluated either in a 3D volume or in a single transverse plane perpendicular to the array normal.
Temperature simulations
As acoustic waves propagate through a lossy medium, mechanical energy dissipates and is converted into heat. The power deposition is approximated by
| (14) |
and the localized heat transfer in biological media is modeled by the bio-heat transfer equation (BHTE),29
| (15) |
where T=T(x,y,z,t) is the tissue temperature, Ta is temperature of the arterial blood, K is the thermal conductivity of tissue, and Wb and Cb are the perfusion rate and the specific heat of blood, respectively. Equation 15 is the steady state BHTE, which models the temperature distribution under equilibrium conditions. For numerical calculations, Eq. 15 is evaluated with an iterative finite difference routine.30
SIMULATION RESULTS
Reference pressure field generated by a 32×32 element phased array
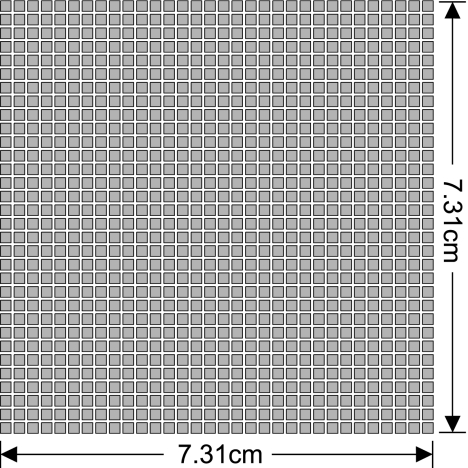
To evaluate the numerical performance of the angular spectrum approach, a 32×32 element 2D planar array is simulated and compared to a reference field. The array is comprised of 1.8 mm×1.8 mm square transducers with a 0.5 mm kerf between adjacent elements. The structure of this array is illustrated in Fig. 2. The array is located in the xy plane at z=0 cm and centered at the origin of the coordinate system. The z axis is coincident with the normal evaluated at the center of the array aperture. The excitation frequency is 1 MHz, the speed of sound is 1500 m∕s, and the attenuation coefficient is α=1 dB∕cm∕MHz. The total extent of the array aperture is 7.31 cm×7.31 cm, which is equal to 48.7λ×48.7λ for a 1 MHz excitation. The reference field is calculated with the spatial impulse response method.7 Using 1000 Gauss abscissas to compute the pressure generated by each square element, the spatial impulse response method calculates the total field generated by this array to an accuracy of 11 digits, as determined by a comparison with the fast nearfield method evaluated with the same number of abscissas. All simulations are performed on a 2.4 GHz Pentium 4 PC (1 Gbyte random access memory) running the Windows XP operating system. All routines are written in the C language, compiled by Microsoft VISUAL C∕C++ Version 7.0, and called by MATLAB 7.1 as MEX files.
Figure 2.
A planar ultrasound phased array comprised of 32×32 square elements. The size of the array is 7.31 cm×7.31 cm (48.7λ×48.7λ for a 1 MHz driving frequency). The array consists of 1.8 mm×1.8 mm (1.2λ×1.2λ) square transducers with a 0.5 mm kerf between adjacent elements.
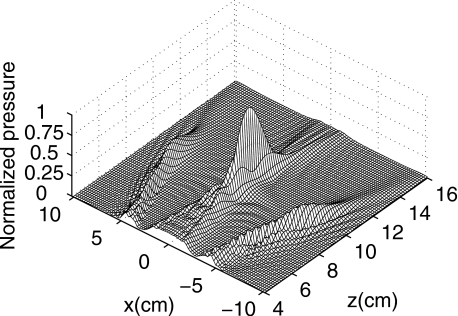
The initial evaluations of the pressure field generated by this 32×32 element phased array are performed in a 20.4 cm×20.4 cm×12 cm (136λ×136λ×80λ) volume with an equal transverse extent in both the x and the y directions. With a sampling interval of δ=0.075 cm (δ=λ∕2), the computational volume is discretized to a 273×273×161 point grid. Figure 3 shows the reference pressure field generated by this 32×32 element phased array in the y=0 plane. The array elements are phased such that a single focus is produced at (0,0,10) cm. The pressure distribution depicted in Fig. 3 is normalized by the overall maximum pressure amplitude in the 3D volume.
Figure 3.
Reference pressure field generated by the 32×32 element planar array in Fig. 2, where the array is focused at (0,0,10) cm. The pressure, which is normalized by the maximum amplitude, is shown in the xz plane at y=0. The excitation frequency for the array is 1 MHz, and the attenuation coefficient is α=1 dB∕cm∕MHz.
Evaluation of pressure and normal particle velocity inputs
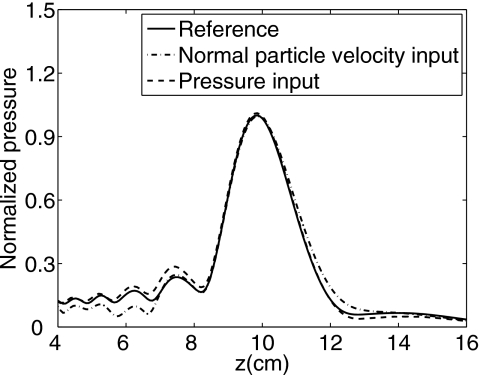
Although angular spectrum calculations with input pressure planes [Eq. 6] and input normal particle velocity planes [Eq. 7] are analytically equivalent, the numerical errors differ. To demonstrate the difference between these two approaches, the reference pressure field generated by the 32×32 element phased array in Fig. 2 is simulated with the spatial impulse response method and then compared to the results obtained with the angular spectrum approach using input pressure and normal particle velocity planes. In each simulation, the normal particle velocity is uniform across each element on the array aperture. The input pressure plane ideally extends to infinity in both lateral directions; however, for computer simulations, the pressure field is truncated by a 20.4 cm×20.4 cm (136λ×136λ) square window. In these calculations, the input pressure is calculated with the fast nearfield method using 20 abscissas for each integral. The spatial sampling interval is δ=0.075 cm (δ=λ∕2), and the value N=512 specifies the number of grid points in the x and y directions. Figure 4 shows the reference axial pressure (solid line) and the axial pressures computed with the angular spectrum approach using an input normal particle velocity plane (dash-dot line) and an input pressure plane (dashed line). For these angular spectrum simulations, the input normal particle velocity and the input pressure are both calculated in the plane at z=0. The resulting 3D fields are normalized by the maximum amplitude of the reference pressure.
Figure 4.
Simulated axial pressures generated by the 32×32 element planar array in Fig. 2. The array is located at z=0 cm and electronically focused at (0,0,10) cm. The reference pressure calculated by the spatial impulse response method is indicated by the solid line, the pressure computed with the angular spectrum approach using an input normal particle velocity plane is represented by the dash-dot line, and the pressure computed with the angular spectrum approach using an input pressure plane is represented by the dashed line.
Figure 4 shows that the output pressure fields obtained from the input pressure and the input normal particle velocity match the reference closely near the focus. The amplitude of the output pressure field computed with the input pressure is slightly larger than the reference field before the focus and slightly smaller than the reference field in the region beyond the focus. The amplitude of the output pressure field computed with the input normal particle velocity plane is smaller than the reference before the focus and slightly larger than the reference beyond the focus. Overall, the output axial pressure computed with the input normal particle velocity plane has a much larger error than that obtained with the input pressure plane.
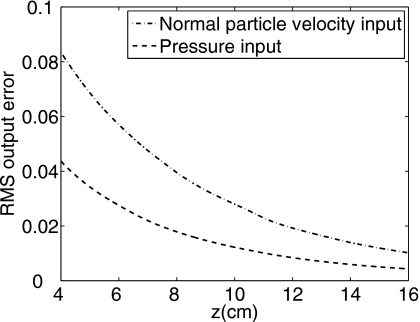
The output RMSE values obtained from angular spectrum calculations are evaluated and plotted in 2D transverse planes along the z direction in Fig. 5. The RMS output errors computed with the input pressure and the input normal particle velocity both decrease monotonically as z increases. Figure 5 also shows that, for the combination of parameters evaluated here, the RMS output error obtained from the input normal particle velocity plane is about twice as large as that obtained with the input pressure plane.
Figure 5.
RMS output errors for the 32×32 element array focused at (0,0,10) cm evaluated in transverse planes for z ranging from 4 cm (26.67λ) to 16 cm (106.67λ). The pressure is calculated with the angular spectrum approach using an input normal particle velocity plane (dash-dot line) and an input pressure plane (dashed line). For this result, the input particle velocity and pressure planes are both located at z0=0 cm and truncated with a 20.4 cm×20.4 cm (136λ×136λ) square window.
Optimal parameters for the input plane
When the spectral propagator Hp(kx,ky,Δz) for an input pressure plane described in Eq. 8 is used for angular spectrum simulations, the input pressure field is truncated by a rectangular window in the x and y directions. The size of this window and the location of the plane that contains the input pressure field both influence the accuracy of the result obtained with the angular spectrum approach. The optimal size and location of the input pressure plane are determined from parametric simulations of the planar phased array in Fig. 2, where the spatial sampling interval is δ=λ∕2, and the N×N grid for the 2D FFT is evaluated with N=512.
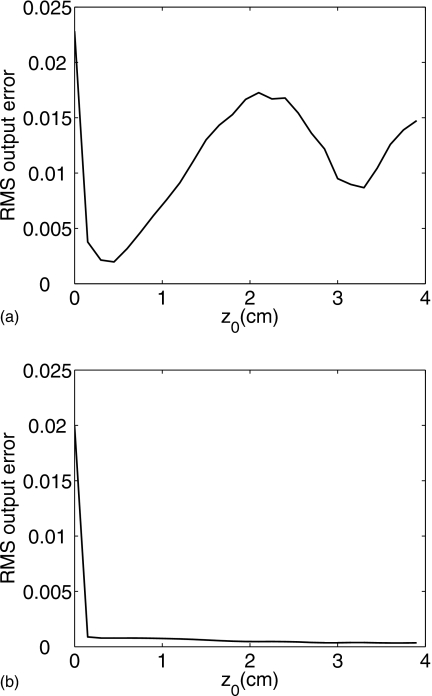
To demonstrate the impact of the input pressure plane location on angular spectrum calculations, the RMS output errors in a 3D volume are calculated in Fig. 6 as a function of the input pressure plane location z0. The input pressure planes for these calculations are evaluated for z0 ranging from 0 to 3.9 cm (26λ) with an interval of 0.15 cm (λ). The input pressure is calculated with the fast nearfield method using 20 abscissas for each integral. In Fig. 6a, the pressure in the input plane is evaluated within a 7.8 cm×7.8 cm (52λ×52λ) square window, which is slightly larger than the 7.31 cm×7.31 cm (48.7λ×48.7λ) array aperture. The resulting RMS output error decreases for a short distance and then oscillates between 0 and 0.02 as z0 increases. In Fig. 6b, the input pressure is evaluated in a 20.4 cm×20.4 cm (136λ×136λ) plane. The 20.4 cm×20.4 cm input pressure plane also includes the contribution from the grating lobes for each z0. The RMS output error in Fig. 6b drops sharply when z0 increases from 0 to 0.15 cm (λ), and then the error remains small for z0⩾λ. Figure 6 shows that when a smaller window is used, the RMS output error oscillates as z0 changes, but the output error is relatively flat for a much larger window with z0⩾λ. In Fig. 6a, the minimum error occurs at z0=0.45 cm (3λ); however, the error is also small at z0=λ. In Fig. 6b, the error is very small for all values of z0⩾λ. Figure 6 shows that the input pressure plane should be at least one wavelength from the array aperture to avoid sampling problems with evanescent waves near the array aperture. Figure 6a also suggests that when the window that truncates the input pressure plane is slightly larger than the array aperture, the resulting error is sufficiently small for z0 equal to 0.15 cm (λ). Thus, for either a 7.8 cm×7.8 cm or a 20.4 cm×20.4 cm window, z0=λ is an appropriate input pressure plane location for the 32×32 element array. For smaller input pressure planes, selecting z0=λ successfully prevents the truncation of grating lobes that could otherwise occur with larger values of z0.
Figure 6.
RMS output errors obtained with the 32×32 element array evaluated in 3D volumes as a function of the input pressure plane location z0. The size of the input pressure plane is (a) 7.8 cm×7.8 cm (52λ×52λ) and (b) 20.4 cm×20.4 cm (136λ×136λ). The location of the input pressure plane ranges between z0=0 and z0=3.9 cm (26λ) with an increment of 0.15 cm (λ).
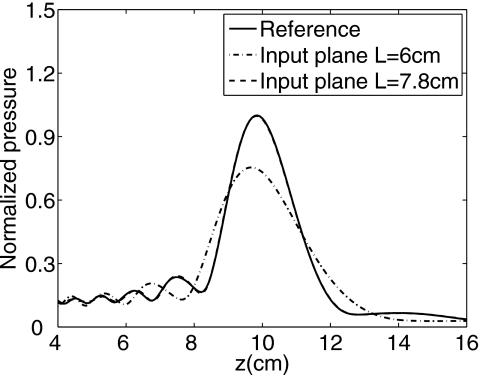
To demonstrate the influence of the size of the input pressure plane window on the RMS output error, the angular spectrum calculations are evaluated for a 6 cm×6 cm (40λ×40λ) input pressure plane and a 7.8 cm×7.8 cm (52λ×52λ) input pressure plane located at z0=λ. The resulting axial pressures are shown in Fig. 7. The input pressure plane extent specified by L=6 cm (40λ) is smaller than the 7.31 cm×7.31 cm array aperture, so the resulting pressure field (dash-dot line) deviates from the reference by a significant amount, especially in the region around the focus. When the extent of the input pressure plane is specified by L=7.8 cm (52λ), the axial pressure (dashed line) closely matches the reference pressure (solid line) in Fig. 7.
Figure 7.
Axial pressures simulated with the angular spectrum approach using input pressure planes that are truncated by square windows of different sizes. The reference pressure is indicated by the solid line, the output pressure computed with the angular spectrum approach using a 6 cm×6 cm (40λ×40λ) input pressure plane is represented by the dash-dot line, and the axial pressure computed with the angular spectrum approach using a 7.8 cm×7.8 cm (52λ×52λ) input pressure plane is represented by the dashed line. The solid line and the dashed line are nearly coincident, which indicates that L=7.8 cm (L=52λ) is sufficiently large for the 7.31 cm×7.31 cm phased array in Fig. 2.
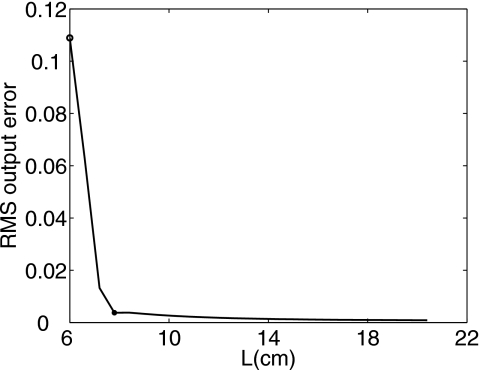
Figure 8 shows the RMS output errors evaluated in a 3D volume, where the input pressure planes are truncated by square windows with sizes ranging from L=6 cm (L=40λ) to L=20.4 cm (L=136λ). For all of the results shown in Fig. 8, the input pressure plane is located at z0=λ. The two markers in Fig. 8 indicate the values of L evaluated in Fig. 7, where the circle denotes L=6 cm (L=40λ) and the solid mark denotes L=7.8 cm (L=52λ). In Fig. 8, the errors monotonically decrease as L increases. The errors are larger when the window size is smaller than the 7.31 cm×7.31 cm array aperture, and the errors are smaller when the window size is larger than the array aperture. Figure 8 suggests that only a moderate reduction in the output error is achieved for values of L>7.8 cm. Furthermore, in Fig. 7, the results for L=7.8 cm are nearly coincident with the reference. If L<7.8 cm is used, the truncation of the pressure wavefront causes an increase in the RMS output errors. An input pressure plane with L>7.8 cm consistently produces small errors. However, there is a trade-off between the accuracy and the efficiency of these calculations for larger L. On the one hand, accurate results are achieved when large values of L are used, and larger input pressure planes are often necessary for array simulations that also include grating lobes, as in Fig. 3. On the other hand, L should be as small as possible because the computation time and computer memory required are proportional to the number of grid points, which is determined by the value of L when δ is fixed. Figure 6 indicates that the minimum error is achieved at z0=0.45 cm (z0=3λ) and that the error at z0=0.15 cm (z0=λ) is acceptably small, and Fig. 8 suggests that L=7.8 cm (L=52λ) is optimal for the 32×32 element planar array in Fig. 2.
Figure 8.
RMS output errors plotted as a function of the extent L of the input pressure plane. The input pressure plane for angular spectrum simulations is located at z0=0.15 cm (z0=λ) and truncated by L×L square windows, where L ranges from 6 cm (40λ) to 20.4 cm (136λ) with an increment of 0.15 cm (λ). The two markers indicate the values of L shown in Fig. 7.
Evaluation of input and output errors
In angular spectrum calculations that use the spectral propagator Hp(kx,ky,Δz), the input pressure is typically simulated with analytical integral approaches, and the angular spectrum simulations then evaluate the output pressure in a 3D volume. For these simulations, fast and accurate calculations of the input pressure are desirable. This motivates numerical evaluations of the errors associated with the input pressure that impact the error in the computed 3D pressure output.
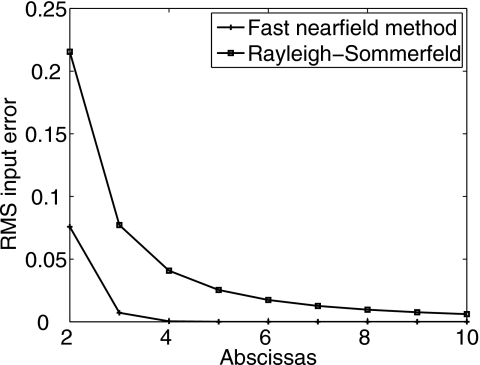
Using the spatial impulse response method as the reference, two analytical integral methods are compared for simulations of the input pressure: the Rayleigh–Sommerfeld integral and the fast nearfield method. The accuracy of these methods is determined by the number of abscissas used in evaluations of the integrals in Eqs. 1, 4, respectively. As demonstrated in Ref. 24, the fast nearfield method achieves higher accuracy with fewer abscissas relative to other single integral approaches for simulations of single transducers. This result also holds for phased array simulations. To demonstrate the change in the RMSE in the input pressure plane as the number of abscissas increases, the pressure field is computed in a 7.8 cm×7.8 cm (52λ×52λ) plane at a depth of z0=0.15 cm (z0=λ), where 7.8 cm (52λ) is the optimal value of L determined in the previous section for the phased array in Fig. 2. With a spatial sampling interval of 0.075 cm (λ∕2), the input pressure plane is discretized to 105 points in both the x and the y directions. The RMSE values are evaluated for the input pressure computed with the Rayleigh–Sommerfeld integral using 2×2 to 10×10 abscissas and with the fast nearfield method using two to ten abscissas. The results are plotted in Fig. 9, where the errors from both methods decrease as the number of abscissas increases. The RMSE for the input pressure obtained with the Rayleigh–Sommerfeld integral approach is 0.216 for 2×2 abscissas, and the error decreases to 0.006 for 10×10 abscissas. In contrast, the RMSE for the input pressure obtained with the fast nearfield method is 0.076 for two abscissas, and the error quickly decreases to 0.0004 with only four abscissas. In Fig. 9, errors less than or equal to 0.0004 are coincident with the horizontal axis when the values in the range shown are plotted on a linear scale.
Figure 9.
RMSE values in the input pressure plane plotted as a function of the number of abscissas. The input pressure plane is located at z0=0.15 cm (z0=λ) and truncated by a 7.8 cm×7.8 cm (52λ×52λ) window. The input pressure is computed with the Rayleigh–Sommerfeld integral using 2×2 to 10×10 abscissas and with the fast nearfield method using two to ten abscissas.
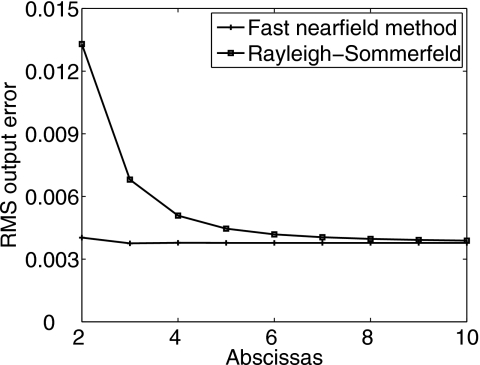
Figure 10 demonstrates the influence of the number of abscissas used for input pressure calculations on the 3D angular spectrum results. In Fig. 10, the horizontal axis contains the number of abscissas for input pressure calculations with the Rayleigh–Sommerfeld integral and the fast nearfield method, and the vertical axis contains the output RMSE values in the 3D pressure field computed with the angular spectrum approach. The output RMSE approaches a limiting value of 0.004 when the fast nearfield method with three or more abscissas calculates the input pressure. When the input pressure is calculated with the Rayleigh–Sommerfeld integral, the output error asymptotically approaches the same value. The saturation of the RMSE in Fig. 10 indicates that there is a lower limit for the output error in angular spectrum calculations that is determined by the grid size, the grid spacing, and the location of the input pressure plane. Moreover, Fig. 10 shows that the fast nearfield method requires far fewer abscissas to achieve the minimum output error. Therefore, the fast nearfield method is a much more efficient approach for calculating the input pressure.
Figure 10.
RMSE values for 3D pressure field outputs plotted as a function of the number of abscissas used for input pressure calculations. The input pressure is calculated with the Rayleigh–Sommerfeld integral using 2×2 to 10×10 abscissas and with the fast nearfield method using two to ten abscissas. The errors obtained from both methods approach the same limiting value, but the fast nearfield method achieves convergence with far fewer abscissas.
Temperature simulations
In thermal therapy simulations, the power deposition is generally modeled by Eq. 14. The resulting power deposition provides the input to the BHTE,29 which simulates the temperature distribution. To determine the influence of the angular spectrum simulation parameters on the calculated temperature, the bio-heat transfer model in Eq. 15 is evaluated for the 32×32 element planar array in Fig. 2, which generates a single focus at (0,0,10) cm. In these simulations, the temperature field is computed in a 7.8 cm×7.8 cm×12 cm (52λ×52λ×80λ) volume, where the boundaries of the computational grid are maintained at 37 °C, the blood perfusion is 8 kg∕m3∕s, the thermal conductivity is 0.55 W∕m∕°C, and the specific heat of blood is 4000 J∕kg∕°C. The goal of each simulation is to elevate the temperature at the focus to 43 °C for hyperthermia cancer therapy31 or for targeted drug delivery.
The temperature fields are calculated with power depositions as inputs, and the power depositions are obtained from the pressure fields calculated with the angular spectrum approach. The results from three types of inputs are compared for these angular spectrum calculations: (1) an input normal particle velocity plane, (2) an input pressure plane obtained from the Rayleigh–Sommerfeld integral, and (3) an input pressure plane obtained from the fast nearfield method. The reference temperature distribution is computed from the power deposition calculated with the spatial impulse response method. In these simulations, the input particle velocity plane is coincident with the array surface at z0=0, whereas both of the input pressure planes are located at z0=0.15 cm (z0=λ). The extent of each input pressure plane is 7.8 cm×7.8 cm (52λ×52λ), and the computational grid is discretized with a sampling rate of δ=0.075 cm (δ=λ∕2). An N×N grid with N=512 is used in all angular spectrum calculations. The power deposition corresponding to the reference pressure is normalized such that the resulting reference temperature field has a maximum value of 43 °C. The power depositions obtained from the angular spectrum simulations are normalized by the same factor.
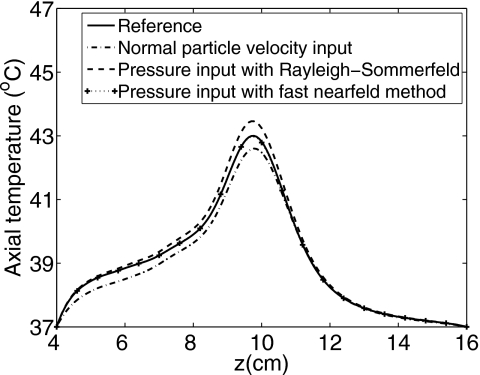
The resulting axial temperature field evaluated along the array normal is shown in Fig. 11. In this figure, the solid line represents the reference, the dash-dot line is obtained from the angular spectrum approach using an input normal particle velocity plane, the dotted line with “+” markers is obtained from the angular spectrum approach using an input pressure plane computed with two abscissas applied to the fast nearfield method, and the dashed line is obtained from the angular spectrum approach using an input pressure computed with 2×2 abscissas applied to the Rayleigh–Sommerfeld integral. Figure 11 shows that when the angular spectrum calculation is performed with an input normal particle velocity plane, the largest errors are in the focal zone, and the simulated axial temperature field deviates from the reference by as much as 0.40 °C, where the maximum target temperature rise is 6 °C. When the input pressure for angular spectrum calculations is computed with the Rayleigh–Sommerfeld integral using 2×2 abscissas, the largest deviations in the simulated temperature field are again located in the focal zone, and the maximum axial temperature difference is 0.45 °C. When the input pressure is computed with the fast nearfield method using two abscissas, the axial temperature field closely matches the reference, and the maximum axial temperature difference is 0.027 °C, which is more than an order of magnitude smaller than the maximum axial temperature errors computed for the other two methods. Figure 11 shows that the temperature obtained from the reference and the temperature obtained from the results of the angular spectrum approach are almost indistinguishable when the input pressure is computed with the fast nearfield method using two abscissas. However, if the input pressure for the angular spectrum simulation is computed with the Rayleigh–Sommerfeld integral approach using 2×2 abscissas or with the input normal particle velocity, the simulated temperature contains noticeable errors. As shown in Fig. 10, the output errors in the 3D pressure field are the same when the input pressure is computed with the Rayleigh–Sommerfeld integral using 7×7 abscissas or with the fast nearfield method using two abscissas. In addition, the simulated 3D temperature fields demonstrate that the temperature distribution obtained from the angular spectrum approach using the input normal particle velocity plane underestimates the temperature field everywhere and that the temperature distribution obtained from the angular spectrum approach combined with the Rayleigh–Sommerfeld calculation using 2×2 abscissas overestimates the temperature field everywhere. In contrast, the temperature distribution obtained from the angular spectrum approach when the input pressure is computed with the fast nearfield method closely matches the reference temperature throughout the 3D volume. This suggests that the fast nearfield method is the preferred method for computing the input pressure in angular spectrum calculations, especially for thermal therapy simulations with large ultrasound phased arrays.
Figure 11.
Axial temperatures computed with the BHTE for power depositions calculated with the angular spectrum approach using different input planes. The pressures are generated by the 32×32 element planar phased array in Fig. 2, which is electronically focused at (0,0,10) cm. The temperature obtained from the reference power deposition is indicated by the solid line, the temperature obtained from the power deposition calculated with the angular spectrum approach using the input normal particle velocity plane is indicated by the dash-dot line, the temperature obtained from the power deposition calculated with the angular spectrum approach when the input pressure is computed with the Rayleigh–Sommerfeld integral using 2×2 abscissas is represented by the dashed line, and the temperature obtained from the power deposition calculated with the angular spectrum approach when the input pressure is computed with the fast nearfield method using two abscissas is represented by the dotted line with “+” markers. The result obtained with the angular spectrum approach where the input pressure is computed with the fast nearfield method is nearly coincident with the reference temperature field, whereas the other simulated temperature fields contain noticeable errors.
DISCUSSION
Simulations with other arrays
The simulation results from Sec. 3 were also validated with two other planar arrays driven by a 1 MHz continuous wave source. The first was a 14.45 cm×14.45 cm (96.67λ×96.67λ) planar array containing 50×50 square elements. The size of each element was 2.4 mm×2.4 mm (1.6λ×1.6λ), and the kerf between adjacent elements was 0.5 mm. The first array was electronically focused at (0,0,12) cm. The computational grid for this array extended from 6 cm (40λ) to 18 cm (120λ) in the z direction. The second was a 4.55 cm×4.55 cm (30.33λ×30.33λ) planar array containing 20×20 elements. The size of each element was 1.8 mm×1.8 mm (1.2λ×1.2λ), and the kerf between adjacent elements was 0.5 mm. The second array was electronically focused at (0,0,8) cm. The computational grid for the second array extended from 3 cm (20λ) to 12 cm (80λ) in the z direction. The sampling rate in the x, y, and z directions was δ=λ∕2 for both arrays. Angular spectrum simulation results computed for these arrays consistently demonstrated that smaller errors were achieved with the input pressure plane than with the input normal particle velocity plane. Results also showed that the smallest errors were obtained when the input pressure plane was located a short distance from the array and that z0=0.15 cm (z0=λ) produced acceptably small errors. The largest errors were consistently obtained when the input pressure plane was coincident with the array aperture (z0=0). For the 20×20 element array, the optimal value of L was 4.8 cm (32λ) or 1.056 times the lateral extent of the array aperture, and for the 50×50 element array, the optimal value of L was 14.7 cm (98λ) or 1.017 times the lateral extent of the array aperture. In general, the optimal input plane size is between 1 and 1.1 times the lateral extent of the array aperture when the input pressure plane is located at z0=λ.
Other focal patterns were simulated with the 32×32 element planar array in Fig. 2, including a pressure field with a steered focus at (0,3,10) cm and a pressure field with a mode32 consisting of two symmetric foci. These pressure patterns are of interest for thermal therapy applications because most tumors are much larger than the size of a single focal spot. The location of the input pressure plane and the size of the truncating window had similar influence on both the off-axis focal pattern and the multiple-focus pattern. The temperature fields for the 32×32 element planar array with a steered focus and multiple focal spots were also simulated with the BHTE after the pressure was computed with the angular spectrum approach. The error in the temperature distributions was again very small when the input pressure was calculated by the fast nearfield method in a plane located one wavelength from the array aperture, where the truncating window was slightly larger than the array aperture.
A 38×38 element spherical-section array33 with square elements was also simulated with the angular spectrum approach. The opening angles in both lateral directions were equal to 60°. Each element in this array was 0.24 cm high and 0.24 cm wide. The array was geometrically focused at 12 cm. The pressure generated by this spherical-section array was also obtained with the angular spectrum approach. As for each of the results presented in previous sections, accurate results were obtained when the input pressure was calculated by the fast nearfield method in a plane truncated by a window slightly larger than the array aperture and located one wavelength from the nearest point on the array aperture.
The size and location of the input pressure plane
The location z0 and the extent L of the input pressure plane determine the accuracy of the calculated pressure field. As demonstrated in Fig. 6b, when a sufficiently large L is used, consistently small errors are achieved for any z0⩾λ. In contrast, Fig. 6a shows that when an intermediate value of L is used, the error oscillates as z0 varies. In this case, the input pressure plane should be closer to z0=λ. When z0=λ and L=7.8 cm (L=52λ) for the array in Fig. 2, the computed axial pressures are coincident with the reference pressure. Figures 78 show that an input pressure plane with L=7.8 cm is sufficient for this array when z0=λ. A larger input pressure plane is required to capture the wave energy when z0 is larger because the pressure wavefront in the corresponding input plane is broader. However, larger input pressure planes require more computer memory and computation time.
The spatial sampling rate
The spatial sampling interval δ is an important parameter in angular spectrum simulations. Undersampling in the spatial domain leads to aliased spectra in the spatial frequency domain. In Fig. 5, the large errors produced by the input normal particle velocity plane or the input pressure plane located at z0=0 are largely due to aliasing. In the phased array model evaluated here, the normal particle velocity distribution on each transducer element is represented by a 2D rect function. The discontinuities at the edge of each element and at the edge of the array aperture introduce high spatial frequency components that are inherently aliased. Thus, the normal particle velocity field encounters some sampling difficulties that cause aliasing. In contrast, the changes in the input pressure distribution are less abrupt. In fact, the angular spectra for the input pressure plane sampled by δ=λ∕2 and λ∕4 are similar, while the angular spectra for the input particle velocity plane sampled by δ=λ∕2 and λ∕4 differ by a significant amount due to aliasing.
For either the normal particle velocity or the input pressure, the output error is reduced by decreasing the spatial sampling interval. By decreasing δ from λ∕2 to λ∕4, the maximum RMSE for the result obtained from the input particle velocity plane is reduced from 0.084 in Fig. 5 to 0.035, and the maximum RMSE for the result obtained from the input pressure is reduced from 0.044 to 0.005. The RMSE values in Fig. 10 are also reduced by decreasing δ. However, smaller values of δ increase the computation time and the amount of computer memory required, and as shown in Figs. 711, λ∕2 sampling is sufficient for angular spectrum simulations of the 32×32 element planar array when the input pressure is computed with the fast nearfield method using appropriate values for L and z0.
The spectral sampling rate
The spectral sampling interval Δk describes the resolution of the angular spectrum. If the angular spectrum is undersampled, wrap-around errors will appear in the reconstructed spatial field. The spectral sampling interval is determined by the relationship Δk=2π∕(Nδ), where increasing N enhances the angular resolution of the angular spectrum and reduces wrap-around errors for a fixed value of δ. In the simulations presented here, the spectral propagator is evaluated within a 512×512 grid. The input pressure plane is discretized to 113 points in the x and the y directions and then zero-padded on a 512×512 grid before the 2D FFT is performed. If no zero-padding is used, the RMSE for the simulated pressure in the 113×113×161 grid is about 37 times higher than the result obtained from the 512×512×161 grid. However, as indicated earlier, N=512 is sufficiently accurate for the results presented here. Further increases in N will result in an unnecessary increase in the computation time and the amount of computer memory.
The numerical error can be especially large for simulations in non-attenuating media, as demonstrated in Ref. 17. An angular restriction technique15 that applies a lowpass filter to the spectral propagator can eliminate some of the high spatial frequency components in the angular spectrum that contribute to the numerical error. However, the numerical simulations shown here are evaluated in an attenuating medium, so the excessive high spatial frequency spectra are filtered out by the attenuation term in Eq. 10. The angular spectrum simulations in this paper produce accurate results without angular restriction, which is not needed for simulations in attenuating media.17
Computation time
The angular spectrum approach computes pressures in parallel planes by propagating fields in the spatial frequency domain. This method reduces the computation time significantly compared to conventional integral approaches, which compute the pressure at individual field points and superpose the results. The pressure field in a 7.8 cm×7.8 cm×12 cm volume is discretized to a 105×105×161 grid when the spatial sampling rate is δ=0.075 cm. To compute the pressure field generated by the 32×32 element planar array in Fig. 2 in this 3D grid, the Rayleigh–Sommerfeld integral calculation in Eq. 1 is completed in 46.15 min if each integral is evaluated with 2×2 abscissas. In contrast, the angular spectrum approach with N=512 only uses 2.12 min to compute the pressure in the same grid, where 0.52 min of this time is spent computing the 105×105 point input pressure plane with the fast nearfield method using two abscissas. In comparison, the Rayleigh–Sommerfeld integral with 7×7 abscissas computes the input pressure plane in 2.84 min and achieves similar accuracy, so the total calculation time for a 3D pressure field with the angular spectrum approach is 4.44 min. Based on this analysis and the results presented in previous sections, the fast nearfield method is preferred for calculations of the input pressure plane in angular spectrum simulations.
CONCLUSION
The angular spectrum approach is a computationally efficient method for simulating 3D pressure fields generated by large ultrasound phased arrays comprised of hundreds or thousands of elements. The results show that the input pressure plane produces more accurate simulation results than the input normal particle velocity plane in angular spectrum computations. In addition, for angular spectrum calculations performed with an input pressure plane, the largest errors are obtained when this plane is coincident with the array aperture, and much smaller errors are obtained when this plane is located one wavelength away from the array aperture. Furthermore, the error in the simulated pressure field decreases as the extent L of the input pressure plane increases. When L reaches a sufficiently large value, the error in the simulated pressure field becomes very small. The optimal value of L is between 1 and 1.1 times the lateral extent of the array aperture. Results also show that the output errors from angular spectrum computations asymptotically approach a limiting value as the number of abscissas used for input pressure plane calculations increases. To achieve this error limit in the computed 3D pressure field, fewer abscissas are required by the fast nearfield method than the Rayleigh–Sommerfeld integral approach for input pressure plane calculations due to the rapid convergence of the fast nearfield method. Evaluations of angular spectrum results in bio-heat transfer simulations demonstrate that the angular spectrum approach combined with the fast nearfield method achieves much smaller errors than the angular spectrum approach combined with the Rayleigh–Sommerfeld integral approach or angular spectrum calculations with an input normal particle velocity plane. Thus, the angular spectrum approach is an accurate and robust method for thermal therapy simulations with large ultrasound phased arrays when the input pressure is computed with the fast nearfield method in a plane located one wavelength away from the array and truncated by a window slightly larger than the array aperture.
ACKNOWLEDGMENTS
This work was supported in part by NIH Grant No. R21CA121235 and NSF Theoretical Foundations Grant No. 0634786.
References
- Ebbini E. S. and Cain C. A., “Multiple-focus ultrasound phased-array pattern synthesis: Optimal driving signal distributions for hyperthermia,” IEEE Trans. Ultrason. Ferroelectr. Freq. Control 10.1109/58.31798 36, 540–548 (1989). [DOI] [PubMed] [Google Scholar]
- Moros E. G., Fan X., and Straube W. L., “An investigation of penetration depth control using parallel opposed ultrasound arrays and a scanning reflector,” J. Acoust. Soc. Am. 10.1121/1.418154 101, 1734–1741 (1997). [DOI] [PubMed] [Google Scholar]
- Saleh K. Y. and Smith N. B., “Two-dimensional ultrasound phased array design for tissue ablation for treatment of benign prostatic hyperplasia,” Int. J. Hyperthermia 20, 7–31 (2004). [DOI] [PubMed] [Google Scholar]
- Ocheltree K. B. and Frizzell L. A., “Sound field calculation for rectangular sources,” IEEE Trans. Ultrason. Ferroelectr. Freq. Control 10.1109/58.19157 36, 242–248 (1989). [DOI] [PubMed] [Google Scholar]
- Tan J. S., Frizzell L. A., Sanghvi N., Wu S.-J., Seip R., and Kouzmanoff J. T., “Ultrasound phased arrays for prostate treatment,” J. Acoust. Soc. Am. 10.1121/1.1373444 109, 3055–3064 (2001). [DOI] [PubMed] [Google Scholar]
- McGough R. J., Cindric D., and Samulski T. V., “Shape calibration of a conformal ultrasound therapy array,” IEEE Trans. Ultrason. Ferroelectr. Freq. Control 48, 494–505 (2001). [DOI] [PubMed] [Google Scholar]
- Lockwood J. C. and Willette J. G., “High-speed method for computing the exact solution for the pressure variations in the nearfield of a baffled piston,” J. Acoust. Soc. Am. 10.1121/1.1913385 53, 735–741 (1973). [DOI] [Google Scholar]
- Piwakowski B. and Sbai K., “A new approach to calculate the field radiated from arbitrarily structured transducer arrays,” IEEE Trans. Ultrason. Ferroelectr. Freq. Control 10.1109/58.753032 46, 422–440 (1999). [DOI] [PubMed] [Google Scholar]
- Piwakowski B. and Sbai K., “A new calculation procedure for spatial impulse responses in ultrasound,” J. Acoust. Soc. Am. 10.1121/1.424654 105, 3266–3274 (1999). [DOI] [Google Scholar]
- Goodman J. W., Introduction to Fourier Optics, 2nd ed. (McGraw-Hill, New York, 1996). [Google Scholar]
- Williams E. G. and Maynard J. D., “Numerical evaluation of the Rayleigh integral for planar radiators using the FFT,” J. Acoust. Soc. Am. 10.1121/1.388633 72, 2020–2030 (1982). [DOI] [Google Scholar]
- Orofino D. P. and Pedersen P. C., “Efficient angular spectrum decomposition of acoustic sources. 1. Theory,” IEEE Trans. Ultrason. Ferroelectr. Freq. Control 10.1109/58.216837 40, 238–249 (1993). [DOI] [PubMed] [Google Scholar]
- Orofino D. P. and Pedersen P. C., “Efficient angular spectrum decomposition of acoustic sources. 2. Results,” IEEE Trans. Ultrason. Ferroelectr. Freq. Control 10.1109/58.216838 40, 250–257 (1993). [DOI] [PubMed] [Google Scholar]
- Wu P., Kazys R., and Stepinski T., “Analysis of the numerically implemented angular spectrum approach based on the evaluation of two-dimensional acoustic fields. Part I. Errors due to the discrete Fourier transform and discretization,” J. Acoust. Soc. Am. 10.1121/1.414712 99, 1339–1348 (1996). [DOI] [Google Scholar]
- Wu P., Kazys R., and Stepinski T., “Analysis of the numerically implemented angular spectrum approach based on the evaluation of two-dimensional acoustic fields. Part II. Characteristics as a function of angular range,” J. Acoust. Soc. Am. 10.1121/1.414713 99, 1349–1359 (1996). [DOI] [Google Scholar]
- Wu P., Kazys R., and Stepinski T., “Optimal selection of parameters for the angular spectrum approach to numerically evaluate acoustic fields,” J. Acoust. Soc. Am. 10.1121/1.418013 101, 125–134 (1997). [DOI] [Google Scholar]
- Zeng X. and McGough R. J., “Evaluation of the angular spectrum approach for simulations of nearfield pressures,” J. Acoust. Soc. Am. 10.1121/1.2812579 123, 68–76 (2008). [DOI] [PMC free article] [PubMed] [Google Scholar]
- Clement G. T. and Hynynen K., “Field characterization of therapeutic ultrasound phased arrays through forward and backward planar projection,” J. Acoust. Soc. Am. 10.1121/1.429477 108, 441–446 (2000). [DOI] [PubMed] [Google Scholar]
- Godden P., ter Haar G., and Rivens I., “Numerical modelling of high intensity focused ultrasound phased arrays by an angular spectrum decomposition using highly-oscillatory quadrature,” in International Symposium on Therapeutic Ultrasound (2007), pp. 36–42.
- Zemp R. J. and Tavakkoli J. T., “Modeling of nonlinear ultrasound propagation in tissue from array transducers,” J. Acoust. Soc. Am. 10.1121/1.1528926 113, 139–152 (2003). [DOI] [PubMed] [Google Scholar]
- Kinsler L. E., Frey A. R., Coppens A. B., and Sanders J. V., Fundamentals of Acoustics, 4th ed. (Wiley, New York, 2000). [Google Scholar]
- Linfield G. R. and Penny J., Numerical Methods Using MATLAB (Prentice-Hall, Upper Saddle River, NJ, 1999). [Google Scholar]
- Zemanek J., “Beam behavior within the nearfield of a vibrating piston,” J. Acoust. Soc. Am. 10.1121/1.1912316 49, 181–191 (1971). [DOI] [Google Scholar]
- McGough R. J., “Rapid calculations of time-harmonic nearfield pressures produced by rectangular piston,” J. Acoust. Soc. Am. 10.1121/1.1694991 115, 1934–1941 (2004). [DOI] [PMC free article] [PubMed] [Google Scholar]
- Chen D. and McGough R. J., “A 2D fast nearfield method for calculating nearfield pressures generated by apodized rectangular pistons,” J. Acoust. Soc. Am. 10.1121/1.2950081 124, 1526–1537 (2008). [DOI] [PMC free article] [PubMed] [Google Scholar]
- Ibbini M. S. and Cain C. A., “A field conjugation method for direct synthesis of hyperthermia phased-array heating patterns,” IEEE Trans. Ultrason. Ferroelectr. Freq. Control 36, 3–9 (1989). [DOI] [PubMed] [Google Scholar]
- Stepanishen P. R. and Benjamin K. C., “Forward and backward projection of acoustic fields using FFT methods,” J. Acoust. Soc. Am. 10.1121/1.387606 71, 803–812 (1982). [DOI] [PubMed] [Google Scholar]
- Liu D. and Wagg R. C., “Propagation and backpropagation for ultrasonic wavefront design,” IEEE Trans. Ultrason. Ferroelectr. Freq. Control 10.1109/58.585184 44, 1–13 (1997). [DOI] [PubMed] [Google Scholar]
- Pennes H. H., “Analysis of tissue and arterial blood temperatures in the resting human forearm,” J. Appl. Physiol. 1, 93–122 (1948). [DOI] [PubMed] [Google Scholar]
- Ocheltree K. B. and Frizzell L. A.,“Determination of power deposition patterns for localized hyperthermia: A steady state analysis,” Int. J. Hyperthermia 3, 269–279 (1987). [DOI] [PubMed] [Google Scholar]
- Stauffer P. R., “Evolving technology for thermal therapy of cancer,” Int. J. Hyperthermia 21, 731C744 (2005). [DOI] [PubMed] [Google Scholar]
- McGough R. J., Wang H., Ebbini E. S., and Cain C. A., “Mode scanning: Heating pattern synthesis with ultrasound phased arrays,” Int. J. Hyperthermia 10, 433–442 (1994). [DOI] [PubMed] [Google Scholar]
- Ebbini E. S. and Cain C. A., “A spherical-section ultrasound phased array applicator for deep localized hyperthermia,” IEEE Trans. Biomed. Eng. 10.1109/10.83562 38, 634–643 (1991). [DOI] [PubMed] [Google Scholar]


