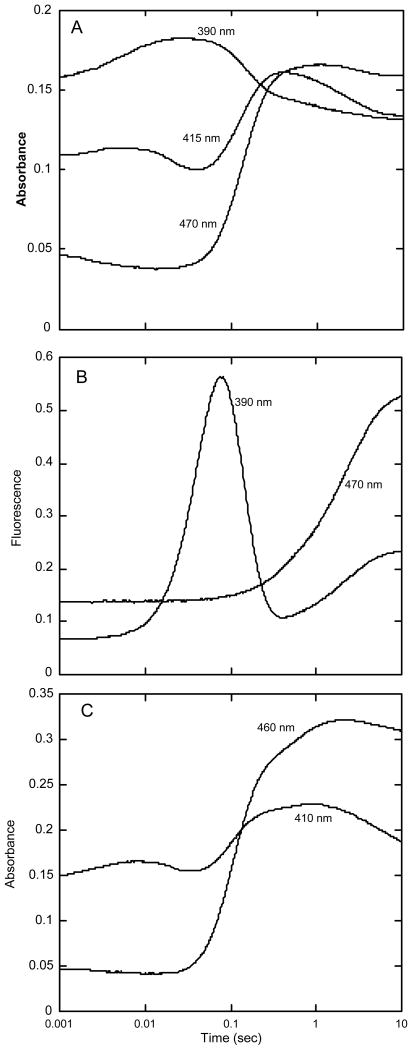
Figure 3.
Reaction of oxygen with HpaA in complex with FADH− and HPA. A – A solution of FADH− (15.5 μM), oxygenase (33 μM) and HPA (0.5 mM) in buffer (50 mM K phosphate, pH 7.2, containing 2.5% glycerol) was mixed with an equal volume of buffer containing oxygen (0.62 mM) in a stopped-flow spectrophotometer at 4 °C. The concentrations given are for the reaction mixtures after mixing in the stopped-flow instrument. The reaction was followed by the change in absorbance at the indicated wavelengths. The wavelengths (390, 415 and 470 nm) selected are those that best characterized the various steps of the reaction. B – The same experiment as in A after reconfiguration of the instrument to record fluorescence emission beyond 500 nm. One trace was from fluorescence excited at 390 nm (to monitor the formation of the C4a-hydroxyflavin), and the other was from fluorescence excited at 470 nm (to monitor the formation of oxidized FAD). C – Selected absorbance traces at 410 and 460 nm from an experiment similar to those in A and B, but with inclusion of 0.1 M KCl in the reaction. The final concentrations in this experiment were 26.8 μM FADH−, 60 μM oxygenase, 1.25 mM HPA, and 0.62 mM oxygen in the same buffer at 4 °C.

