Fig. 4.
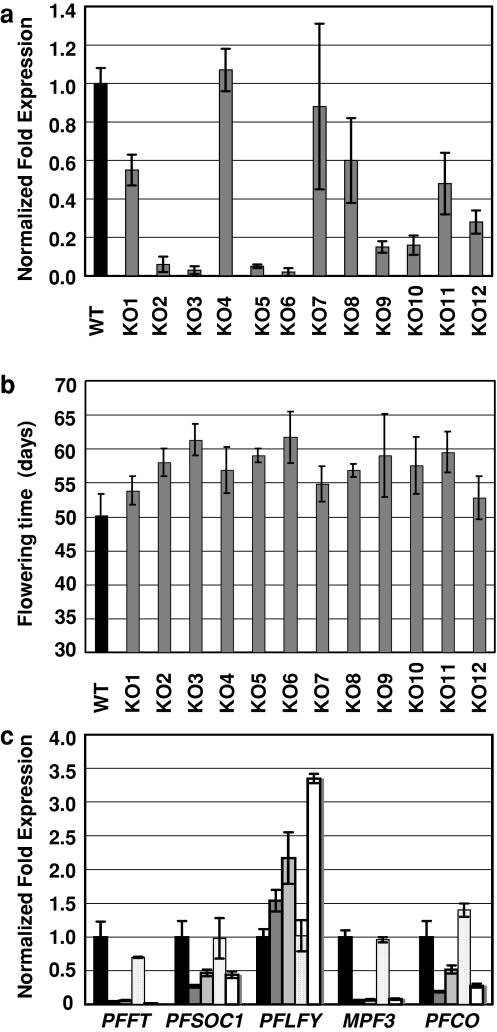
Expression of MPF1 and flowering time of 35S:MPF1-RNAi transgenic Physalis lines. a Expression of MPF1 in 35S:MPF1-RNAi lines. MPF1 expression was measured in the 12 knockdown (KO) transgenic lines using real-time RT-PCR, and expression levels were normalized relative to wild-type (WT). Error bars represent ±SD (n = 3). b Flowering time of the transgenic 35S:MPF1-RNAi lines and wild-type Physalis. Flowering time is given in days to anthesis. The black column represents wild type and the gray columns represent individual transgenic lines. Days 0–30 were condensed to allow magnification of days 30–70 for apparent differences. Error bars represent ±SD (n = 4). c The expression levels of the putative flowering-time genes (from left to right) in wild-type Physalis (black column) and the transgenic knockdown lines KO2 (dark gray), KO3 (middle gray), KO4 (light gray) and KO10 (white). Plant lines were grown for 28 days under long-day conditions. The expression level of each gene was normalized relative to wild type (black column). Error bars represent ±SD (n = 3)

