

Abstract
The cellular form of the prion protein (PrPc) is necessary for the development of prion diseases and is a highly conserved protein that may play a role in neuroprotection. PrPc is found in both blood and cerebrospinal fluid and is likely produced by both peripheral tissues and the central nervous system (CNS). Exchange of PrPc between the brain and peripheral tissues could have important pathophysiologic and therapeutic implications, but it is unknown whether PrPc can cross the blood–brain barrier (BBB). Here, we found that radioactively labeled PrPc crossed the BBB in both the brain-to-blood and blood-to-brain directions. PrPc was enzymatically stable in blood and in brain, was cleared by liver and kidney, and was sequestered by spleen and the cervical lymph nodes. Circulating PrPc entered all regions of the CNS, but uptake by the lumbar and cervical spinal cord, hypothalamus, thalamus, and striatum was particularly high. These results show that PrPc has bidirectional, saturable transport across the BBB and selectively targets some CNS regions. Such transport may play a role in PrPc function and prion replication.
Keywords: Prion, Blood-brain barrier, Scrapie, Transport, Peptide
Introduction
Cellular prion protein (PrPc) is perhaps best known as a source for the misfolded protein PrPsc (Prusiner, 1997) and as a prerequisite for the development of prion diseases (Mallucci et al., 2000). However, PrPc itself likely has important biological functions. It is found circulating in blood (Volkel et al., 2001) and is found in even higher levels in the cerebrospinal fluid (CSF) (Picard-Hagen et al., 2006). After ischemic events, PrPc levels increase in blood (Mitsios et al., 2007) and in neurons and brain endothelial cells in the peri-infarct region (Mitsios et al., 2007; Weise et al., 2004). These increases may reflect cytoprotective and neuroprotective roles for PrPc as recently reviewed (Roucou & LeBlanc, 2005). PrPc null mice have larger infarct volumes after ischemic events (Weise et al., 2006; Nasu-Nishimura et al., 2008) and more neuronal apoptosis after viral infections (Nasu-Nishimura et al., 2008) than wild type mice. In comparison, mice that overexpress PrPc have smaller infarcts and better neurological outcomes than wild type mice after ischemic events (Shyu et al., 2005). These protective events are likely mediated by PrPc through activation of anti-apoptotic (Spudich et al., 2005) and anti-oxidant pathways (White et al., 1999).
Sources of circulating PrPc likely include platelets (Robertson et al., 2006), endothelial cells (Simak et al., 2002), and lymphocytes (Politopoulou et al., 2000). Among lymphocytes, CD3 and CD8 lymphocytes have especially high levels which increase with aging (Politopoulou et al., 2000) All these cells have membrane bound PrPc that apparently can be released into the circulation. Platelet activation (Robertson et al., 2006) or endothelial apoptosis (Simak et al., 2002), for example, results in release of PrPc from those cells.
Thus, PrPc occurs in both blood and in CSF with levels that are likely responsive to disease states. This raises the question of whether PrPc can cross the blood–brain barrier (BBB). Such passage could link the two pools of PrPc and the events that control their levels. Here, we examined the ability of PrPc to cross the BBB in both the blood-to-brain and the brain-to-blood directions.
Materials and methods
Production and purification of PrPc
Murine prpc gene (residues 23–230) was PCR-amplified from mouse blood sample using standard molecular biology techniques. The amplicon was inserted in a pET303/CT His vector (Invitrogen®) and propagated in DH10B-T1R E. coli cells (Invitrogen®). The plasmid was purified and then transformed into BL21-Star E. coli cells (Invitrogen®). For expression, freshly transformed cells were grown in 5 ml of TB medium supplemented with kanamicin (100 μg/ml) at 37 °C for 6 h. The starter culture was then diluted into 50 ml of the same medium and grown for another 6 h. This culture was finally diluted in 750 ml of the same medium and grown until it reached 0.7 OD. 1 mM IPTG was then added and the cells were induced for an additional 5 h. The cells were harvested by centrifugation and kept at −80 °C until purification. For purification, cell pellets were thawed and resuspended in buffer A (50 mM Tris–HCl pH 8.0, 1 mM EDTA and 100 mM NaCl). Cells were lysed by adding 0.5 mg/ml Lysozyme and subsequently sonicated. The released inclusion bodies were pelleted by centrifugation at 22,000 ×g and then washed twice with buffer A supplemented with 0.05% (v/v) Triton X-100. The inclusion bodies containing PrPc were solubilized for 2 h with buffer B (10 mM Tris–HCl, 100 mM Na2HPO4 pH 8.0, 100 mM NaCl, 10 mM B-Mercaptoethanol, 6 M GdnCl) and then purified by using standard IMAC procedure. Briefly, the sample was bound to Ni Sepharose 6 Fast Flow resin (GE Healthcare®) in batch-mode for 1 h at RT and then washed with buffer B. PrPc was on-column refolded for 6 h and eluted with 500 mM Imidazole. The main peak was collected and quickly filtered to remove aggregates. The sample was buffer-exchanged by using Zeba-desalting columns (Pierce®), further concentrated to ∼0.5 mg/ml and flash-frozen at −80 °C. Protein inhibitors (Complete Protease Inhibitor Cocktail from Roche®) were used throughout the purification to minimize degradation. The protein was confirmed to be monomeric and folded by SDS-PAGE, Western blotting and Circular Dichroism.
Radioactive Labeling of PrPc was radioactively labeled by the iodobead method. In brief, 100 μl of 0.1% SB3-14 (Sigma Chemical Co., St. Louis, MO) in 0.25 M sodium phosphate buffer solution was added to a polypropylene tube containing 2 mCi 131 I. A washed iodiobead (Pierce, Inc., Rockford, IL) was added to the mixture and left to incubate for 5 min at room temperature. PrPc (10 μg) was added and allowed to incubate for 5 min. This mixture was added to a G-10 Sephadex column previously washed and then eluted with 0.1%SB3-14 in 0.25 M sodium phosphate buffer, pH 7.4. The I-PrPc eluted in fraction 8 (RF 1.6) with 83% precipitation in acidified brine (30% trichloroacetic acid in a saturated solution of NaCl).
Distribution uptake by brain and peripheral tissues
Male CD-1 mice from our in-house colony (VA-St. Louis) were anesthetized with 40% urethane. All animal studies were done in accordance with international standards and under protocols approved by our local animal use committee. The right jugular vein and the left carotid artery were exposed. At t = 0, 0.2 ml of lactated Ringer's solution containing 1% bovine serum albumin (LR-BSA) and 250,000 cpm I-PrPc was injected into the jugular vein. At various times after the iv injection, blood was collected from the carotid artery and the mouse immediately decapitated and kidney, liver, spleen, and cervical lymph nodes were collected and weighed. The arterial blood was centrifuged and arterial serum collected. The levels of radioactivity were determined in the serum and tissues. Results were expressed as the percent of the iv injected dose of I-PrPc in 1 ml of serum (%Inj/ml) or as tissue/serum ratios (μl/g).
Whole body distribution and clearance from blood was determined by plotting the log of %Inj/ml vs time. The antilog of the inverse of this intercept was multiplied by 100 to yield Vd (ml). A two phase exponential decay curve was applied to calculate the fast and slow clearance rates from blood.
The unidirectional influx rate (Ki, in units of μl/g-min) from blood-to-brain was calculated by multiple-time regression analysis (Blasberg et al., 1983; Patlak et al., 1983). In brief, the brain/serum ratio was plotted against exposure time, where exposure time (Expt) was calculated as:
The slope for the linear portion of the relation between brain/serum ratios and Expt measures Ki. The intercept for this line (Vi, in units of μl/g) measures the initial (t = 0) distribution space in brain and reflects the vascular space of the brain plus any reversible binding to the luminal surface of brain endothelial cells. Uptake rates for the peripheral tissues were measured by plotting their tissue/serum ratios against Expt.
Regional uptake within the CNS
Male CD-1 mice from our in-house colony were anesthetized with 40% urethane and given an injection into the right jugular vein of LR-BSA containing I-PrPc with or without 10 μg/mouse of unlabeled PrPc (n = 6/group). Twenty minutes later, arterial serum, olfactory bulb, whole brain, and spinal cord were collected from each mouse. The whole brain was dissected into 10 regions (frontal cortex, parietal cortex, occipital cortex, striatum, hippocampus, hypothalamus, thalamus, pons-medulla, cerebellum, and midbrain) after the method of Glowinski & Iversen (1966) and the spinal cord divided into its cervical, thoracic, and lumbar regions. Brain and spinal cord regions were weighed, the level of radioactivity determined, and the results expressed as the brain/serum ratios in units of μl/g. The values for whole brain were calculated by adding together the levels of radioactivity or weights for the 10 brain regions with exclusion of data for olfactory bulb and spinal cord regions.
In vivo stability in brain and blood
Arterial serum obtained 5–60 min after the iv injection of I-PrPc was allowed to clot and 50 μl of the resulting serum added to 250 μl of LR-BSA and then to 250 μl of acidified brine containing 30% trichloroacetic acid. The mixture was vigorously mixed and centrifuged at 5400 ×g for 15 min at 4 °C. The resultant supernatant and precipitate were separated and counted and the results expressed as the percent of total counts that were precipitated.
Brains obtained 5–60 min after the iv injection of I-PrPc were homogenized with a glass homogenizer in 3 ml of LR-BSA and then centrifuged at 5400 ×g for 10 min at 4 °C. An aliquot of 1.5 ml of the supernatant was added to 1.5 ml of acidified brine containing 30% trichoroacetic acid, the mixture vigorously mixed, and then centrifuged at 5400 ×g for 10 min at 4 °C. The supernatant and precipitate were separated and counted and the results expressed as the percent of total counts that precipitated.
To correct for any degradation that might have occurred during the processing for acid precipitation, we added I-PrPc to non-radioactive arterial whole blood or to whole brain. These samples were then processed as above and the percent of total counts that were precipitated determined. The mean of 4 processing controls was 72% for serum and 63% for brain. The values for the biological samples were divided by the value of the processing control and multiplied by 100 to give the reported results.
Capillary depletion
Capillary depletion as modified for use in the mouse (Triguero et al., 1990; Gutierrez et al., 1993) was used to determine the degree to which PrPc was sequestered and retained by the vascular bed of the brain. Mice were anesthetized with urethane and given an injection into the jugular vein of 0.2 ml saline containing 750,000 cpm of PrPc labeled with 131I and albumin labeled with 125I. Twenty minutes later, arterial blood was obtained from the abdominal aorta. In other mice, the thorax was opened and the descending thoracic aorta clamped after obtaining the blood, both jugular veins severed, and the blood washed out of the brain by injecting 20 ml of lactated Ringer's solution into the left ventricle of the heart in 60 s. The brain was removed and emulsified in a glass homogenizer (8–10 strokes) at 4 °C in a 9-fold volume of physiological buffer (10 mM HEPES, 141 mM NaCl, 4 mM KCl, 2.8 mM CaCl2, 1 mM MgSO4, 1 mM NaH2PO4, and 10 mM d-glucose adjusted to pH 7.4). Dextran solution was added to the homogenate to a final concentration of 26%. An aliquot was centrifuged at 5400 ×g for 15 min at 4 °C in a swinging bucket rotor. The pellet containing the brain microvessels and the supernatant containing the brain parenchyma were carefully separated. Results were expressed as capillary/serum and parenchyma/serum ratios. Values for albumin were subtracted from those for PrPc to yield values corrected for residual vascular contamination.
Brain-to-blood efflux
The intracerebroventricular (icv) injection method as previously described was used to quantify efflux of I-PrPc (Banks & Kastin, 1989; Banks et al., 1997a; Banks & Broadwell, 1994; Cashion et al., 1996). Two month old male CD-1 mice from our in-house colonies were kept on a 12/12 h light/dark cycle with food and water freely available. They were anesthetized on day of study with 0.15 ml of 40% urethane. The scalp was removed and a hole made into the lateral ventricle, 1.0 mm lateral and 1.0 mm posterior to the bregma, with a 26 ga needle with a tubing guard which kept the depth of the holes constant (3.0–3.5 mm). Mice received 1.0 μl icv injections containing 5(103) cpm I-PrPc in LR-BSA. Mice were decapitated at 2, 5, 10, and 20 min after injection. The whole brain was removed, the pituitary and pineal glands were discarded, and the level of residual radioactivity in the whole brain was determined from the counts after 3 min in a gamma counter. The level of radioactivity in whole brain at t = 0 was determined in mice overdosed with anesthetic as previously described (Banks & Kastin, 1989). The cpm remaining in the brain was divided by the cpm injected and multiplied by 100 to yield the percent of the injected dose remaining in brain (%Inj/brain). The log of %Inj/brain was regressed against time. A significant correlation between log (%Inj/brain) and time indicated a measurable efflux from brain-to-blood of the injected substance, with the slope of this relation measuring the rate of efflux. In other mice, only the 10 min value was assessed with some injections containing 1 μg/mouse of non-radioactive PrPc. These data were not transformed by log but the arithmetic means compared by t-test.
Statistics
Linear regression analysis including calculation of slopes with error terms was conducted by the least squares method with the Prism 5.0 statistical package (GraphPad, Inc., San Diego, CA). Means are reported with their error terms and number per statistical cell (n). Means were compared by t-test.
Results
Fig. 1 shows the clearance of I-PrPc from blood after its iv injection. A two phase decay model was applied to the results which yielded a fast half-life of 0.65 min and a slow half-life of 12 min (n = 28, r = 0.911). As shown in Table 1, no degradation was detected in blood for 60 min. Fig. 2 shows the uptake of I-PrPc by brain. The inset shows that a steady state of 21.6 μl/g was approached. Entry into brain was linear for the first 30 min of exposure time after iv injection with a Ki of 0.305 ± 0.020 μl/g-min (n = 17, r = 0.969, p <0.0001). Table 1 shows degradation in brain beyond 20 min of clock time (about 30 min exposure time) but with significant amounts of intact I-PrPc still in brain at 60 min.
Fig. 1.
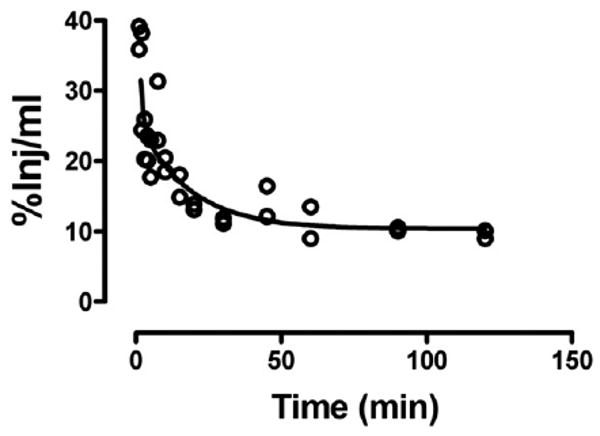
Clearance of radioactively labeled PrPc from blood after iv injection. Fast and slow components to the half-time clearance were 0.65 and 12 min, respectively.
Table 1.
TCA precipitation of radioactivity in brain or serum.
| 5 min | 20 min | 30 min | 60 min | |
|---|---|---|---|---|
| Serum (% of control) | 113 ± 2.2 | 108 ± 0.41 | 102 ± 1.1 | 103 ± 0.30 |
| Brain (% of control) | 111 ± 1.6 | 93 ± 3.9 | 68 ± 6.0 | 72 ± 4.4 |
Results are expressed as the percent of processing control radioactivity that precipitates with acidified brine. Means ± SE (n = 2).
Fig. 2.
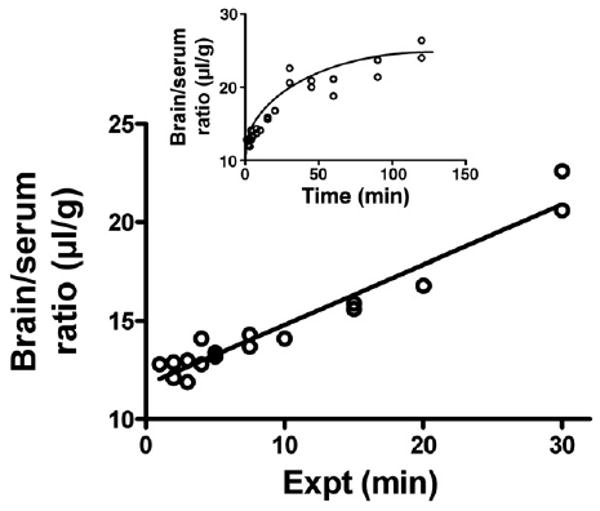
Uptake by brain of PrPc after its iv injection. The inset shows that a steady state maximum value of 21.6 μl/g was approached. The unidirectional influx rate (main panel) showed a Ki = 0.305 ± 0.02 μl/g-min.
Fig. 3 shows that the majority of I-PrPc taken up by brain was able to traverse the width of the capillary wall to enter the parenchymal space of the brain. Only a small percent was retained by the capillaries. Inclusion of washout did not affect results, demonstrating that little or no I-PrPc was reversibly adhering to the luminal surface of the capillary bed.
Fig. 3.
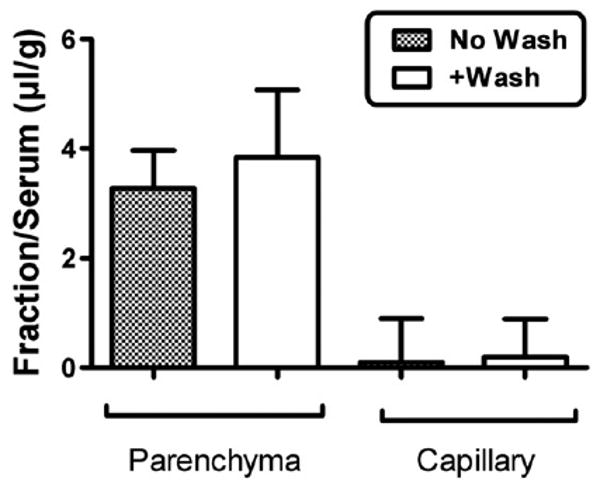
Capillary depletion with or without vascular washout. The majority of PrPc was in the parenchymal space, demonstrating that PrPc was not sequestered by the capillary bed but crossed the full thickness of the capillary wall. Washout produced no difference in parenchymal values, showing that PrPc was not reversibly retained by the luminal surface of the capillary bed.
I-PrPc was also taken up by the peripheral tissues of spleen, liver, kidney and cervical lymph nodes (Table 2). Uptake was not saturated by the inclusion of 10 μg/mouse in the iv injection for any of the peripheral tissues nor was clearance from blood affected. However, there was a statistically significant decrease in the Ki for brain: F(1,8) = 7.97, p <0.05. This demonstrates that transport of PrPc across the BBB involves a saturable transport system.
Table 2.
Uptake rates by tissues: effect of unlabeled PrPc.
| Brain | Spleen | Liver | Kidney | Cervical lymph nodes | |
|---|---|---|---|---|---|
| I-PrPc only | 0.207 ± 0.052 | 7.34 ± 2.19 | 13.2 ± 3.6 | 26.1 ± 9.7 | 5.08 ± 1.62 |
| I-PrPc + 10 μg/mouse of unlabeled PrPc | 0.076 ± 0.010* | 6.43 ± 1.13 | 10.4 ± 1.6 | 31 ± 5.8 | 4.50 ± 1.61 |
Values are in μl/g-min.
p <0.05 compared to I-PrPc only group.
Fig. 4 shows values for brain and spinal cord regions. Statistical comparison of the whole brain value to brain regions and olfactory bulb (spinal cord regions excluded) showed a statistically significant variation: F(22,62) = 18.3, p <0.001. The hypothalamus, thalamus, and striatum showed statistically (p <0.01) greater uptake in comparison to whole brain. The highest uptake, however, was into the lumbar region of the spinal cord. Inhibition of uptake by unlabeled PrPc (Table 3; p <0.05) was found for whole brain, olfactory bulb, 4 of the 10 brain regions (occipital cortex, thalamus, striatum, and midbrain) and two of the spinal cord regions (cervical and lumbar).
Fig. 4.
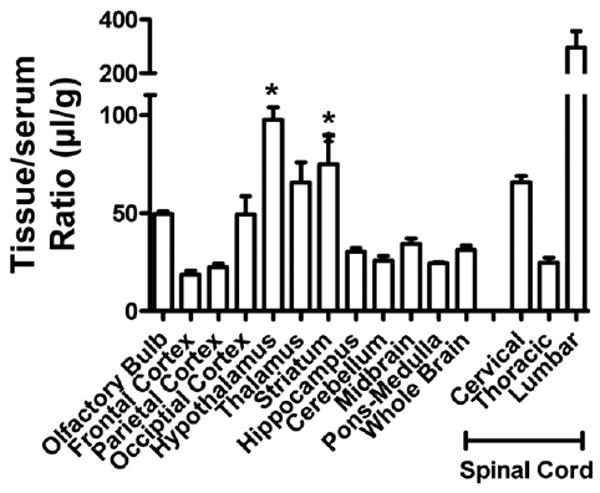
Regional uptake of PrPc by the CNS. *p <0.05 compares brain regions to whole brain values. The cervical and lumbar thoracic regions also differed from whole brain values.
Table 3.
Inhibition of I-PrPc uptake by 10 μg/mouse unlabeled PrPc.
| CNS region | I-PrPc only | +PrPc |
|---|---|---|
| Whole brain | 31.2 ± 2.0 | 22.3 ± 0.8** |
| Olfactory bulb | 49.5 ± 1.2 | 34.8 ± 3.6** |
| Frontal cortex | 18.4 ± 2.0 | 16.1 ± 2.0 |
| Parietal cortex | 22.2 ± 1.8 | 17.7 ± 1.4 |
| Occipital cortex | 49.3 ± 9.1 | 26.8 ± 4.3* |
| Hypothalamus | 97.4 ± 6.6 | 105 ± 13.1 |
| Thalamus | 65.5 ± 10.2 | 32.8 ± 5.8* |
| Striatum | 74.8 ± 14.9 | 32.9 ± 8.2* |
| Hippocampus | 30.2 ± 1.8 | 29.4 ± 2.6 |
| Cerebellum | 25.6 ± 2.3 | 20.2 ± 1.2 |
| Midbrain | 34.1 ± 2.9 | 22.8 ± 1.7** |
| Pons medulla | 24.2 ± 0.8 | 21.8 ± 1.5 |
| Cervical spinal cord | 65.6 ± 3.0 | 47.5 ± 4.6* |
| Thoracic spinal cord | 24.6 ± 2.6 | 23.5 ± 2.1 |
| Lumbar spinal cord | 295 ± 62 | 73.5 ± 20.3* |
Means are shown with their SE (n = 4–6/group). Tissue/serum ratios expressed in ml/g.
p <0.05 and
p <0.01 when compared to I-PrPc. Only for the respective region.
I-PrPc was rapidly cleared from the brain after its injection into the lateral ventricle (Fig. 5), with a half-time clearance from brain of 15.7 min (n = 10, r = 0–832, p <0.005). The inset of Fig. 4 shows that inclusion of 1 μg/mouse of unlabeled PrPc significantly inhibited the efflux of I-PrPc [n = 7/group, t(13) = 2.61, p <0.05].
Fig. 5.
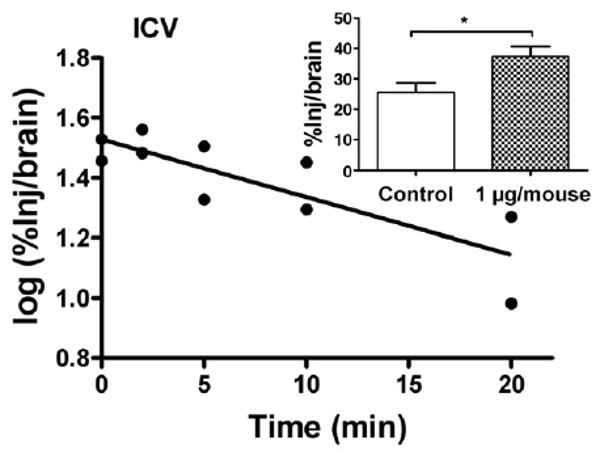
Brain-to-blood efflux of PrPc after icv injection. Half-time clearance from brain was 15.7 min. Inset shows that inclusion of unlabeled PrPc in the icv injection increased retention of radioactively labeled PrPc by brain, demonstrating a saturable component to the brain-to-blood transport of PrPc.
Discussion
Here, we examined the ability of PrPsc to cross the BBB. Whereas there has been interest in how PrPsc crosses the BBB, no work to date has been done on PrPc. It is clear, however, that PrPc is present in both the blood and in the CNS and that both brain and blood levels of PrPc are responsive to CNS injury. These findings raise the question of whether PrPc can cross the BBB. Furthermore, the results suggesting a neuroprotective role for PrPc also raise the question of whether it can cross the BBB and potentially be used therapeutically.
Here we found that PrPc crossed the BBB bidirectionally; that is, in both the brain-to-blood (efflux) and blood-to-brain (influx) directions. Transport of radioactively labeled PrPc in either direction was shown to be saturable with unlabeled PrPc. Such bidirectional transport occurs for other molecules whose CNS levels are important to function and are tightly regulated, such as potassium and glucose (Daniel et al., 1978; Bradbury et al., 1972). Bidirectional transport has also been found for many peptides with therapeutic or pathological potential, such as pituitary adenylate cyclase activating polypeptide (Banks et al., 1993) and beta amyloid protein (Deane et al., 2004a; LaRue et al., 2004). Which direction dominates can vary as a function of substance (Deane et al., 2004b) or physiologic state (Bradbury et al., 1972).
The unidirectional influx rate of 0.305 μl/g-min is about 300 times slower than found for large neutral amino acids (Segal et al., 1990) and about 100 times faster than typically found for albumin (Banks et al., 1988). This rate is similar to the rates found for CNS active proteins such as leptin, insulin, and cytokines (Banks et al., 1996; Banks et al., 1997b; Banks et al., 1991).
We used the icv injection method to determine the rate of brain-to-blood transport. This method can also be used for direct brain injection (Banks et al., 1994), but when the icv injection route is used, it assesses contributions by both the choroid plexus and capillary bed (Maness et al., 1996; Maness et al., 1998). Use of the full time course as used here produces actual efflux kinetics rather than values indexed to a reference molecule.
PrPc showed enzymatic stability in both blood and brain tissue. This suggests that blood-borne PrPc could contribute significantly to brain levels of PrPc and that efflux from brain could also contribute to blood levels. Similar mixing of CNS and peripheral pools of peptide also occurs for amyloid beta protein (DeMattos et al., 2002), another protein that can result in CNS toxicity because of misfolding (Soto et al., 2000). The pathophysiological implications of such mixing are not well understood, nor is it clearly determined for either amyloid beta protein or for PrPc whether efflux or influx dominate in determining levels in brain. Levels of PrPc in sheep CSF (Picard-Hagen et al., 2006) and human blood (Volkel et al., 2001) are similar (9.6 ng/ml and 6.2 ng/ml, respectively), suggesting that an equilibrium between the two exists. Here, radioactively labeled PrPc had a significant residence time in blood, with about 10% of the injected dose still present in 1 ml of blood 120 min after iv injection. Thus, any secreted PrPc has a significant period in which to cross the BBB. This also indicates that PrPc has a favorable pharmacokinetic profile if used as a therapeutic for neuroprotection.
Capillary depletion with washout showed that little or no PrPc adhered to the luminal surface of the capillaries. Irreversible adherence or uptake by the capillaries is shown by high uptake in the capillary fraction and reversible adherence is indicated by a lower value for the parenchymal fraction in washout compared to non-washout animals. The Vi in Fig. 2 is about 11 μl/g which is comparable to the brain's vascular space and supports the conjecture that there is little adherence to the luminal surface of brain endothelial cells. This lack of adherence is in marked contrast to amyloid beta protein, especially the 40mer form (Maness et al., 1994; Martel et al., 1996), which shows the majority of material associated with the capillary fraction.
PrPc was also taken up by peripheral tissues. Uptake of PrPc by liver and kidney was high, indicating that both of these tissues are important for clearance. Spleen and cervical lymph nodes also took up PrPc. These tissues also take up PrPsc, suggesting that both the native and misfolded forms of the protein may be using similar mechanisms for uptake and distribution in the body. No saturable component to PrPc uptake by kidney, liver, spleen, or cervical nodes could be demonstrated with 10 μg/mouse of unlabeled material. These results suggest that PrPc is taken up by these tissues by a non-saturable mechanism, but it is theoretically possible that a saturable system is present that requires higher doses for saturation. Based on the pharmacokinetics shown in Fig. 1, the dose of 10 μg/mouse produces blood levels of about 1 μg/ml. Since this exceeds the endogenous blood level of PrPc in humans of 6.2 ng/ml (3134) by over 100 fold, it is unlikely that PrPc by itself would ever saturate any such transporter. These findings emphasize the importance of examining uptake, especially of the BBB, for saturable components.
Brain uptake of PrPc was found to be saturable in two separate experiments shown in Table 2 and in Table 3. PrPc uptake was also widely distributed throughout the CNS. However, the hypothalamus, thalamus, and striatum had high rates of uptake and are often the regions most affected in prion disease (DeArmond et al., 1993). Although it is known that PrPsc can cross the BBB (Banks et al., 2004), it is not known whether PrPsc uses the PrPc transporter to do so. Most of the highest transport regions showed saturable inhibition, the one exception being the hypothalamus. This high rate of entry with absence of saturation could be caused by a system with a high transport capacity. The lumbar spinal cord showed the highest uptake rate of any CNS region and we showed that it had a significant saturable component. Interestingly, the spinal cord has been suggested as an important entry site for PrPsc (Kimberlin et al., 1987), again suggesting that both forms of the protein may be using the same transporters for uptake, clearance, or distribution.
The uptake of PrPc by a number of brain regions raises the possibility that it may be affecting various aspects of brain function or even altering BBB function. Amyloid beta protein, for example, has been shown to alter various aspects of BBB function, including monocyte migration (Giri et al., 2000). Such actions would be consistent with the neuroprotective role suggested for PrPc as discussed above.
In summary, PrPc is transported by a saturable mechanism both into and out of the CNS. Uptake from blood occurs throughout the CNS and is particularly high for lumbar and cervical spinal cord, hypothalamus, thalamus, striatum the olfactory bulb, and occipital cortex. Radioactively labeled PrPc is stable in blood and brain, suggesting that PrPc produced in either the CNS or peripheral tissue compartment could contribute to the levels in the other compartment. Overall, these results show that PrPc can readily cross the BBB in both the brain-to-blood or blood-to-brain directions.
Acknowledgments
Supported by VA Merit Review, R01 NS050547 (WAB), and R01 AG029839 (WAB).
Footnotes
Publisher's Disclaimer: This article appeared in a journal published by Elsevier. The attached copy is furnished to the author for internal non-commercial research and education use, including for instruction at the authors institution and sharing with colleagues.
Other uses, including reproduction and distribution, or selling or licensing copies, or posting to personal, institutional or third party websites are prohibited.
In most cases authors are permitted to post their version of the article (e.g. in Word or Tex form) to their personal website or institutional repository. Authors requiring further information regarding Elsevier's archiving and manuscript policies are encouraged to visit: http://www.elsevier.com/copyright
References
- Banks WA, Kastin AJ. Quantifying carrier-mediated transport of peptides from the brain to the blood. In: Conn PM, editor. Methods in Enzymology. Vol. 168. Academic Press; San Diego: 1989. pp. 652–660. [DOI] [PubMed] [Google Scholar]
- Banks WA, Broadwell RD. Blood to brain and brain to blood passage of native horseradish peroxidase, wheat germ agglutinin and albumin: pharmacokinetic and morphological assessments. J Neurochem. 1994;62:2404–2419. doi: 10.1046/j.1471-4159.1994.62062404.x. [DOI] [PubMed] [Google Scholar]
- Banks WA, Kastin AJ, Fasold MB. Differential effect of aluminum on the blood–brain barrier transport of peptides, technetium and albumin. J Pharmacol Exp Ther. 1988;244:579–585. [PubMed] [Google Scholar]
- Banks WA, Kastin AJ, Huang W, Jaspan JB, Maness LM. Leptin enters the brain by a saturable system independent of insulin. Peptides. 1996;17:305–311. doi: 10.1016/0196-9781(96)00025-3. [DOI] [PubMed] [Google Scholar]
- Banks WA, Ortiz L, Plotkin SR, Kastin AJ. Human interleukin (IL) 1α, murine IL-1α and murine IL-1β are transported from blood to brain in the mouse by a shared saturable mechanism. J Pharmacol Exp Ther. 1991;259:988–996. [PubMed] [Google Scholar]
- Banks WA, Kastin AJ, Komaki G, Arimura A. Passage of pituitary adenylate cyclase activating polypeptide1–27 and pituitary adenylate cyclase activating polypeptide1–38 across the blood–brain barrier. J Pharmacol Exp Ther. 1993;267:690–696. [PubMed] [Google Scholar]
- Banks WA, Kastin AJ, Sam HM, Cao VT, King B, Maness LM, Schally AV. Saturable efflux of the peptides RC-160 and Tyr-MIF-1 by different parts of the blood–brain barrier. Brain Res Bull. 1994;35:179–182. doi: 10.1016/0361-9230(94)90100-7. [DOI] [PubMed] [Google Scholar]
- Banks WA, Fasold MB, Kastin AJ. Measurement of efflux rate from brain to blood. In: Irvine GB, Williams CH, editors. Methods in Molecular Biology. In Neuropeptides Protocols. Humana Press; Totowa, NJ: 1997a. pp. 353–360. [DOI] [PubMed] [Google Scholar]
- Banks WA, Jaspan JB, Huang W, Kastin AJ. Transport of insulin across the blood-brain barrier: saturability at euglycemic doses of insulin. Peptides. 1997b;18:1423–1429. doi: 10.1016/s0196-9781(97)00231-3. [DOI] [PubMed] [Google Scholar]
- Banks WA, Niehoff ML, Adessi C, Soto C. Passage of murine scrapie prion protein across the vascular blood–brain barrier of the mouse. Biochem Biophys Res Commun. 2004;18:125–130. doi: 10.1016/j.bbrc.2004.04.009. [DOI] [PubMed] [Google Scholar]
- Blasberg RG, Fenstermacher JD, Patlak CS. Transport of α-aminoisobutyric acid across brain capillary and cellular membranes. J Cereb Blood Flow Metab. 1983;3:8–32. doi: 10.1038/jcbfm.1983.2. [DOI] [PubMed] [Google Scholar]
- Bradbury MWB, Segal MB, Wilson J. Transport of potassium at the blood–brain barrier. J Physiol (London) 1972;221:617–632. doi: 10.1113/jphysiol.1972.sp009771. [DOI] [PMC free article] [PubMed] [Google Scholar]
- Cashion MF, Banks WA, Kastin AJ. Sequestration of centrally administered insulin by the brain: effects of starvation, aluminum, and TNF-α. Hormone Behav. 1996;30:280–286. doi: 10.1006/hbeh.1996.0034. [DOI] [PubMed] [Google Scholar]
- Daniel PM, Love ER, Pratt OE. The effect of age upon the influx of glucose into the brain. J Physiol (London) 1978;274:141–148. doi: 10.1113/jphysiol.1978.sp012139. [DOI] [PMC free article] [PubMed] [Google Scholar]
- Deane R, Wu Z, Sagare A, Davis J, Du Yan S, Hamm K, Xu F, Parisi M, LaRue B, Hu HW, Spijkers P, Guo H, Song X, Lenting PJ, Van Nostrand WE, Zlokovic B. LRP/amyloid beta-peptide interaction mediates differential brain efflux of Abeta isoforms. Neuron. 2004a;43:333–344. doi: 10.1016/j.neuron.2004.07.017. [DOI] [PubMed] [Google Scholar]
- Deane R, Wu Z, Zlokovic BV. RAGE (yin) versus LRP (yang) balance regulates Alzheimer amyloid beta-peptide clearance through transport across the blood–brain barrier. Stroke. 2004b;35:2628–2631. doi: 10.1161/01.STR.0000143452.85382.d1. [DOI] [PubMed] [Google Scholar]
- DeArmond SJ, Yang SL, Lee A, Bowler R, Taraboulos A, Groth D, Prusiner SB. Three scrapie prion isolates exhibit different accumulation patterns of the prion protein scrapie isoform. Proc Natl Acad Sci U S A. 1993;90:6449–6453. doi: 10.1073/pnas.90.14.6449. [DOI] [PMC free article] [PubMed] [Google Scholar]
- DeMattos RB, Bales KR, Cummins DJ, Paul SM, Holtzman DM. Brain to plasma amyloid-β efflux: a measure of brain amyloid burden in a mouse model of Alzheimer's disease. Science. 2002;295:2264. doi: 10.1126/science.1067568. [DOI] [PubMed] [Google Scholar]
- Giri R, Shen Y, Stins M, Du Yan S, Schmidt AM, Stern D, Kim KS, Zlokovic B, Kalra VK. Beta-amyloid-induced migration of monocytes across human brain endothelial cells involves RAGE and PECAM-1. Am J Physiology. 2000;279:C1772–C1781. doi: 10.1152/ajpcell.2000.279.6.C1772. [DOI] [PubMed] [Google Scholar]
- Glowinski J, Iversen LL. Regional studies of catecholamines in the rat brain. I. The disposition of [3H]norepinephrine, [3H]dopamine and [3H]dopa in various regions of the brain. J Neurochem. 1966;13:655–669. doi: 10.1111/j.1471-4159.1966.tb09873.x. [DOI] [PubMed] [Google Scholar]
- Gutierrez EG, Banks WA, Kastin AJ. Murine tumor necrosis factor alpha is transported from blood to brain in the mouse. J Neuroimmunol. 1993;47:169–176. doi: 10.1016/0165-5728(93)90027-v. [DOI] [PubMed] [Google Scholar]
- Kimberlin RH, Cole S, Walker CA. Pathogenesis of scrapie is faster when infection is intraspinal instead of intracerebral. Microbial Pathogenesis. 1987;2:405–415. doi: 10.1016/0882-4010(87)90047-7. [DOI] [PubMed] [Google Scholar]
- LaRue B, Hogg E, Sagare A, Jovanovic S, Maness L, Maurer C, Deane R, Zlokovic BV. Method for measurement of the blood–brain barrier permeability in the perfused mouse brain: application to amyloid-beta peptide in wild type and Alzheimer's Tg2576 mice. J Neurosci Methods. 2004;138:233–242. doi: 10.1016/j.jneumeth.2004.04.026. [DOI] [PubMed] [Google Scholar]
- Mallucci G, Dickinson A, Linehan J, Klohn PC, Brandner S, Collinge J. Depleting neuronal PrP in prion infection prevents disease and reverses spongiosis. Science. 2000;302:871–874. doi: 10.1126/science.1090187. [DOI] [PubMed] [Google Scholar]
- Maness LM, Banks WA, Podlisny MB, Selkoe DJ, Kastin AJ. Passage of human amyloid β protein 1–40 across the murine blood–brain barrier. Life Sci. 1994;21:1643–1650. doi: 10.1016/0024-3205(94)00331-9. [DOI] [PubMed] [Google Scholar]
- Maness LM, Banks WA, Zadina JE, Kastin AJ. Periventricular penetration and disappearance of icv Tyr-MIF-1, DAMGO, tyrosine, and albumin. Peptides. 1996;17:247–250. doi: 10.1016/0196-9781(95)02135-3. [DOI] [PubMed] [Google Scholar]
- Maness LM, Kastin AJ, Farrell CL, Banks WA. Fate of leptin after intracerebroventricular injection into the mouse brain. Endocrinology. 1998;139:4556–4562. doi: 10.1210/endo.139.11.6319. [DOI] [PubMed] [Google Scholar]
- Martel CL, Mackic JB, McComb JG, Ghiso J, Zlokovic BV. Blood–brain barrier uptake of the 40 and 42 amino acid sequences of circulating Alzheimer's amyloid beta in guinea pigs. Neurosci Lett. 1996;206:157–160. doi: 10.1016/s0304-3940(96)12462-9. [DOI] [PubMed] [Google Scholar]
- Mitsios N, Saka M, Krupinksi J, Pennucci R, Sanfeliu C, Miguel Tura M, Gaffney J, Kumar P, Kumar S, Sullivan M, Stevin M. Cellular prion protein is increased in the plasma and peri-infarcted brain tissue after acute stroke. J Neurosci Res. 2007;85:602–611. doi: 10.1002/jnr.21142. [DOI] [PubMed] [Google Scholar]
- Nasu-Nishimura Y, Taniuchi Y, Nishimura T, Sakudo A, Nakajima K, Ano Y, Sugiura K, Sakaguchi S, Itohara S, Onodera T. Cellular prion protein prevents brain damage after encephalomyocarditis virus infection in mice. Arch Virol. 2008;153:1007–1012. doi: 10.1007/s00705-008-0086-x. [DOI] [PubMed] [Google Scholar]
- Patlak CS, Blasberg RG, Fenstermacher JD. Graphical evaluation of blood-to-brain transfer constants from multiple-time uptake data. J Cereb Blood Flow Metab. 1983;3:1–7. doi: 10.1038/jcbfm.1983.1. [DOI] [PubMed] [Google Scholar]
- Picard-Hagen N, Gayrard V, Viguie C, Moudjou M, Imbs C, Toutain PL. Prion protein in the cerebrospinal fluid of healthy and naturally scrapie-affected sheep. J Gen Virol. 2006;87:3723–3727. doi: 10.1099/vir.0.81859-0. [DOI] [PubMed] [Google Scholar]
- Politopoulou G, Seebach JD, Schmugge M, Schwarz HP, Aguzzi A. Age-related expression of cellular prion protein in human peripheral blood leukocytes. Haematologica. 2000;85:580–587. [PubMed] [Google Scholar]
- Prusiner SB. Cell biology and transgenic models of prion diseases. In: Collinge J, Palmer MS, editors. Prion Diseases. Oxford University Press; Oxford: 1997. pp. 130–162. [Google Scholar]
- Robertson C, Booth SA, Beniac DR, Coulthart MB, Booth TF, McNicol A. Cellular prion protein is released on exosomes from activated platelets. Blood. 2006;107:3907–3911. doi: 10.1182/blood-2005-02-0802. [DOI] [PubMed] [Google Scholar]
- Roucou X, LeBlanc AC. Cellular prion protein neuroprotective function: implications in prion disease. J Mol Med. 2005;83:3–11. doi: 10.1007/s00109-004-0605-5. [DOI] [PubMed] [Google Scholar]
- Segal MB, Preston JE, Collis CS, Zlokovic BV. Kinetics and Na independence of amino acid uptake by blood side of perfused sheep choroid plexus. Am J Physiology. 1990;258:F1288–F1294. doi: 10.1152/ajprenal.1990.258.5.F1288. [DOI] [PubMed] [Google Scholar]
- Shyu WC, Lin SZ, Chiang MF, Ding DC, Li KW, Chen SF, Yang HI, Li H. Overexpression of PrPc by adenovirus-mediated gene targeting reduces ischemic injury in a stroke rat model. J Neurosci. 2005;25:8967–8977. doi: 10.1523/JNEUROSCI.1115-05.2005. [DOI] [PMC free article] [PubMed] [Google Scholar]
- Simak J, Holada K, D'Agnillo F, Janota J, Vostal JG. Cellular prion protein is expressed on endothelial cells and is released during apoptosis on membrane microparticles found in human plasma. Transfusion. 2002;42:334–342. doi: 10.1046/j.1537-2995.2002.00072.x. [DOI] [PubMed] [Google Scholar]
- Soto C, Kascsak RJ, Saborio GP, Aucouturier P, Wisniewski T, Preilli F, Kascsak R, Mendez E, Harris DA, Ironside J, Tagliavini F, Carp RI, Frangione B. Reversion of prion protein conformational changes by synthetic β-sheet breaker peptides. Lancet. 2000;355:192–197. doi: 10.1016/s0140-6736(99)11419-3. [DOI] [PubMed] [Google Scholar]
- Spudich A, Frigg R, Killic E, Oesch B, Raeber A, Bassetti CL, Hermann DM. Aggravation of ischemic brain injury by prion protein deficiency: role of ERK-1/-2 and STAT-1. Neruobiol Dis. 2005;20:442–449. doi: 10.1016/j.nbd.2005.04.002. [DOI] [PubMed] [Google Scholar]
- Triguero D, Buciak J, Pardridge WM. Capillary depletion method for quantification of blood–brain barrier transport of circulating peptides and plasma proteins. J Neurochem. 1990;54:1882–1888. doi: 10.1111/j.1471-4159.1990.tb04886.x. [DOI] [PubMed] [Google Scholar]
- Volkel D, Zimmerman K, Zerr I, Bodemer M, Lindner T, Turecek PL, Poser S, Schwarz HP. Immunochemical determination of cellular prion protein in plasma from healthy subjects and patients with sporadic CJD or other neurologic diseases. Transfusion. 2001;41:441–448. doi: 10.1046/j.1537-2995.2001.41040441.x. [DOI] [PubMed] [Google Scholar]
- Weise J, Crome O, Sandau R, Schulz-Schaeffer W, Bahr M, Zerr I. Upregulation of cellular prion protein (PrPc) after focal ischemia and influence of lesion severity. Neurosci Lett. 2004;372:146–150. doi: 10.1016/j.neulet.2004.09.030. [DOI] [PubMed] [Google Scholar]
- Weise J, Sandau R, Schwarting S, Crome O, Wrede A. Deletion of cellular prion protein results in reduced Akt activation, enhanced postischemic caspase-3 activation, and markers detected in the brains of mice devoid of prion protein. J Neurochem. 2006;76:565–572. doi: 10.1161/01.STR.0000217262.03192.d4. [DOI] [PubMed] [Google Scholar]
- White AR, Collins SJ, Maher F, Jobling MF, Stewart LR, Thyer JM, Beyreuther K, Masters CL, Cappai R. Prion protein-deficient neurons reveal lower glutathione reductase activity and increased susceptibility to hydrogen peroxide toxicity. Am J Pathology. 1999;155:1723–1730. doi: 10.1016/S0002-9440(10)65487-9. [DOI] [PMC free article] [PubMed] [Google Scholar]